Jordan Laboratory Furniture Market (2026-2032) | Analysis, Growth, Industry, Trends, Size, Companies, Revenue, Forecast, Outlook, Share & Value
Market Forecast By Product Type (Lab Bench, Lab Cabinet, Fume Hood, Stool, Accessories), By Applications (Education, Government, Industry, Research, Pharmaceutical) And Competitive Landscape
| Product Code: ETC029466 | Publication Date: Oct 2020 | Updated Date: Jun 2026 | Product Type: Report | |
| Publisher: 6Wresearch | Author: Ravi Bhandari | No. of Pages: 70 | No. of Figures: 35 | No. of Tables: 5 |
Jordan Laboratory Furniture Market Summary
The jordan laboratory furniture market was estimated at USD 241 Million in 2025 and is projected to reach USD 318 Million by 2032, growing at a CAGR of 4.4% from 2026 to 2032.
Jordan Laboratory Furniture Market Year-wise Growth Rate and Key Drivers
This graph highlights how the Jordan Laboratory Furniture Market has steadily grown over the past five years, supported by major growth factors.
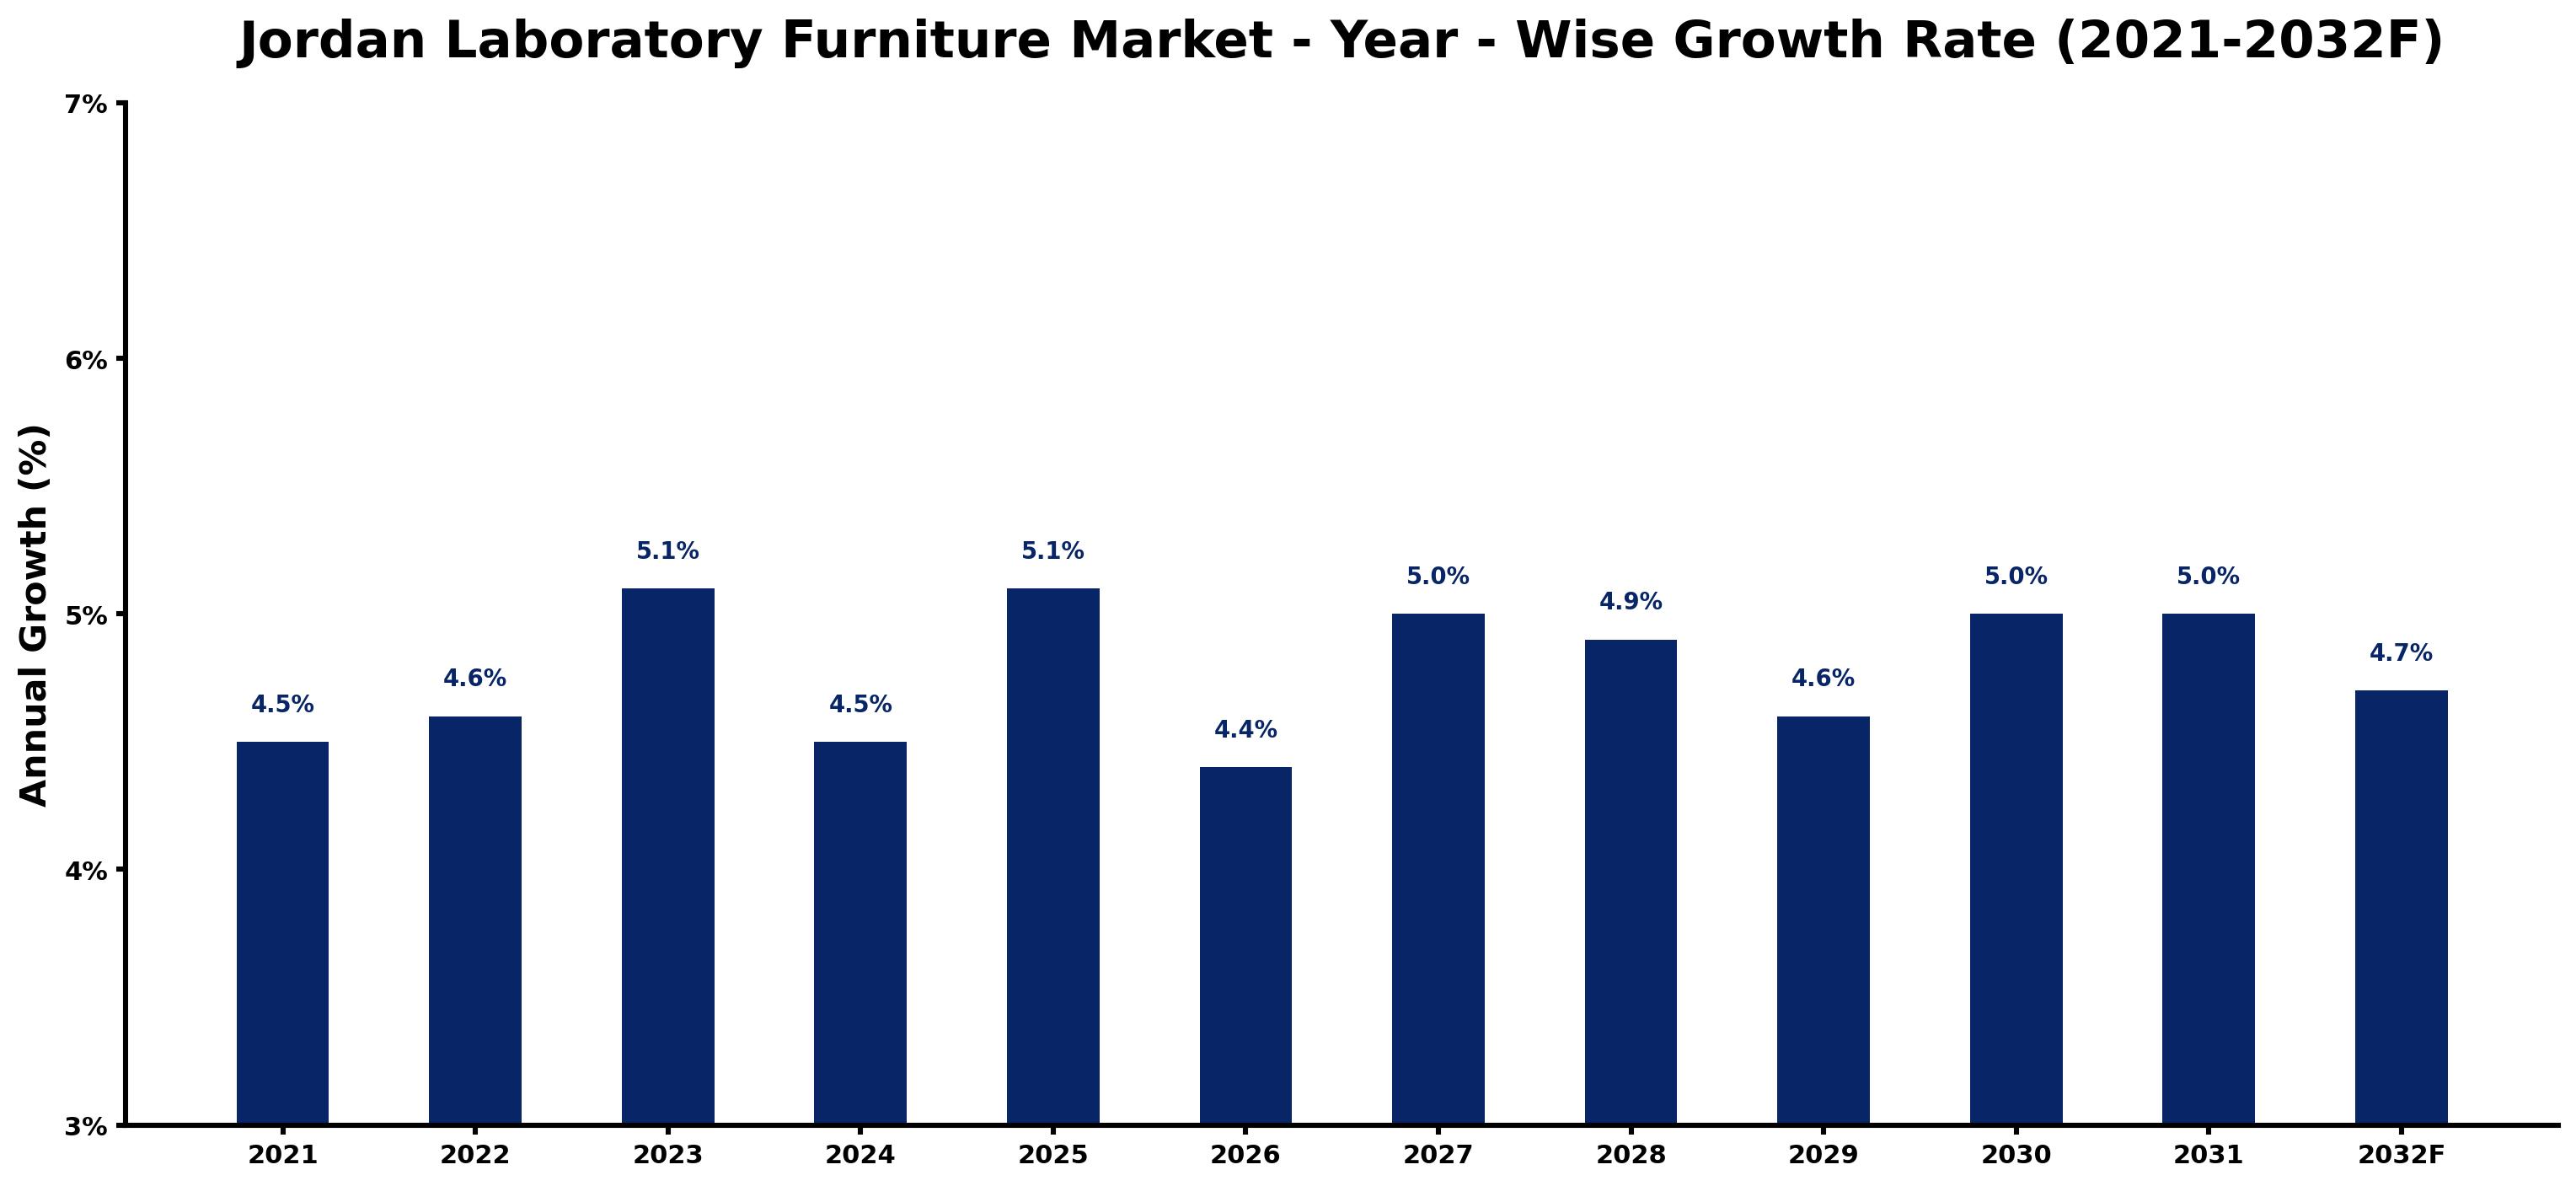
The table below presents the year wise growth rates along with the key drivers influencing the market
| Year | Growth Rate | Major Drivers |
| 2021 | 4.5% | Laboratory modernization projects emphasize the need for high-quality furniture solutions. |
| 2022 | 4.6% | Increased investments in healthcare facilities lead to heightened laboratory furniture demand. |
| 2023 | 5.1% | Local manufacturers respond to competition by enhancing product quality and customization options. |
| 2024 | 4.5% | Educational institutions expand research capabilities, boosting laboratory furniture requirements significantly. |
| 2025 | 5.1% | Sustainable materials gain traction in laboratory designs, influencing purchasing decisions. |
| 2026 | 4.4% | Technological innovations in laboratory settings necessitate ergonomic and adaptable furniture solutions. |
| 2027 | 5.0% | Healthcare sector growth drives the establishment of more specialized laboratories nationwide. |
| 2028 | 4.9% | Regional collaborations enhance supply chain efficiencies for laboratory furniture distribution. |
| 2029 | 4.6% | Emerging biotech firms increasingly prioritize modern laboratory environments for research activities. |
| 2030 | 5.0% | Government incentives encourage investment in research and development facilities across Jordan. |
| 2031 | 5.0% | A surge in environmental awareness shifts preferences towards eco-friendly laboratory furniture options. |
| 2032 | 4.7% | International partnerships enable knowledge transfer, enhancing local capabilities in laboratory furniture manufacturing. |
Note - Market size estimations and growth projections presented in this report are based on 6Wresearch's advanced forecasting approach, validated with industry datasets as of June 2026.
Jordan Laboratory Furniture Market Synopsis
The Jordan Laboratory Furniture Market is projected to reach 4.4% and witness significant growth during the forecast period (2026-2032). This market is primarily driven by the increasing expansion of research institutions and educational facilities within Jordan, fostering a heightened need for specialized laboratory furniture. The demand encompasses a broad array of products, including lab benches, cabinets, fume hoods, and various other bespoke furniture tailored to the specific requirements of laboratory environments.
Jordan Laboratory Furniture Market Growth Drivers
The growth of the Jordan laboratory furniture market can be attributed to several key factors:
- Increased investments in healthcare infrastructure that drive demand for modern lab setups.
- A rising emphasis on scientific research and development activities across multiple sectors, including academia and pharmaceuticals.
- Stringent regulations pertaining to laboratory safety and operational standards that necessitate compliance through the use of appropriate furniture.
- The growing trend of ergonomic and customizable designs that cater to specific laboratory needs and enhance user efficiency.
- Investment in sustainable materials that align with global environmental standards, appealing to conscientious buyers.
Jordan Laboratory Furniture Market Trends and Opportunities
Current trends in the Jordan laboratory furniture market reveal a significant shift toward modern, ergonomic, and customizable solutions. Laboratories are increasingly prioritizing:
- Space optimization in furniture designs that contribute to improved workflow and efficiency.
- Diverse aesthetic choices—colors and designs—that allow customization according to laboratory branding and user preferences.
- Integration of technology in laboratory furniture to facilitate better data management and connectivity within lab settings.
- A strong preference for durable and sustainable materials aimed at reducing environmental impact while ensuring longevity.
- An increase in investment towards innovative solutions that emphasize usability, flexibility, and functionality in laboratory furniture.
Jordan Laboratory Furniture Market Challenges and Restraints
Despite the growth prospects, the Jordan laboratory furniture market faces several challenges that could hinder development:
- Limited availability of high-quality materials that meet international safety and performance standards poses a challenge for manufacturers.
- A shortfall in local specialized manufacturers creates dependence on imported goods, which can lead to higher costs and longer lead times.
- Infrastructure constraints coupled with logistical challenges can disrupt timely delivery and installation of essential lab furniture.
- Regulatory hurdles and compliance issues regarding safety standards and environmental regulations may complicate the market landscape.
- To overcome these challenges, there is a pressing need for investment in local manufacturing capabilities and partnerships with international suppliers.
Jordan Laboratory Furniture Market Investment Opportunities
The Jordan Laboratory Furniture Market offers promising investment opportunities driven by increasing demand in various sectors such as research institutions, universities, and healthcare facilities. Key areas of opportunity include:
- Growing needs for specialized laboratory equipment such as fume hoods, workbenches, and safety storage solutions.
- An upward trend toward environmentally friendly and sustainable lab furniture, appealing to increasingly responsible consumers.
- Potential for innovation in ergonomic and customizable furniture solutions that can effectively cater to the diverse needs of end-users.
- Advancements in scientific research and government initiatives designed to bolster healthcare infrastructure drive further demand.
- Engagement in strategic partnerships and collaborations to bolster manufacturing capabilities and supply chain efficiencies.
Jordan Laboratory Furniture Market Government Investment and Initiatives
The Jordanian government has rolled out various policies to stimulate growth within the laboratory furniture sector. These policies focus on:
- Encouraging public and private investment in the laboratory furniture market through incentives and funding support.
- Promoting local manufacturing capabilities to reduce reliance on imports and enhance product quality.
- Implementing regulations that ensure compliance with safety standards and environmental regulations to safeguard consumers.
- Fostering innovation and technological advancements within the sector to enhance competitiveness.
- Strengthening partnerships between government entities and industry leaders to support development initiatives aimed at enhancing laboratory standards.
Jordan Laboratory Furniture Market Latest Developments (May 2025 - June 2026)
Recent developments in the Jordan laboratory furniture market from May 2025 to June 2026 indicate a dynamic shift towards increased investments in innovation and sustainability. Manufacturers are focusing on integrating smart technology into their products to facilitate enhanced data management and operational efficiency. Furthermore, there is a notable rise in collaborative efforts aimed at improving supply chain logistics to mitigate delays in product availability. The market is also seeing a gradual increase in the diversification of offerings, catering to a wider range of specialized laboratory needs, responding to the ongoing evolution of user expectations.
Jordan Laboratory Furniture Market - Key Attractiveness of the Report
- 10 Years of Market Numbers
- Historical Data Starting from 2022 to 2025
- Base Year: 2025
- Forecast Data until 2032
- Key Performance Indicators Impacting the Market
- Major Upcoming Developments and Projects
Key Highlights of the Report:
- Jordan Laboratory Furniture Market Outlook
- Market Size of Jordan Laboratory Furniture Market, 2025
- Forecast of Jordan Laboratory Furniture Market, 2032F
- Historical Data and Forecast of Jordan Laboratory Furniture Revenues & Volume for the Period 2022-2032F
- Jordan Laboratory Furniture Market Trend Evolution
- Jordan Laboratory Furniture Market Drivers and Challenges
- Jordan Laboratory Furniture Price Trends
- Jordan Laboratory Furniture Porter's Five Forces
- Jordan Laboratory Furniture Industry Life Cycle
- Historical Data and Forecast of Jordan Laboratory Furniture Market Revenues & Volume By Product Type for the Period 2022-2032F
- Historical Data and Forecast of Jordan Laboratory Furniture Market Revenues & Volume By Lab Bench for the Period 2022-2032F
- Historical Data and Forecast of Jordan Laboratory Furniture Market Revenues & Volume By Lab Cabinet for the Period 2022-2032F
- Historical Data and Forecast of Jordan Laboratory Furniture Market Revenues & Volume By Fume Hood for the Period 2022-2032F
- Historical Data and Forecast of Jordan Laboratory Furniture Market Revenues & Volume By Stool for the Period 2022-2032F
- Historical Data and Forecast of Jordan Laboratory Furniture Market Revenues & Volume By Accessories for the Period 2022-2032F
- Historical Data and Forecast of Jordan Laboratory Furniture Market Revenues & Volume By Applications for the Period 2022-2032F
- Historical Data and Forecast of Jordan Laboratory Furniture Market Revenues & Volume By Education for the Period 2022-2032F
- Historical Data and Forecast of Jordan Laboratory Furniture Market Revenues & Volume By Government for the Period 2022-2032F
- Historical Data and Forecast of Jordan Laboratory Furniture Market Revenues & Volume By Industry for the Period 2022-2032F
- Historical Data and Forecast of Jordan Laboratory Furniture Market Revenues & Volume By Research for the Period 2022-2032F
- Historical Data and Forecast of Jordan Laboratory Furniture Market Revenues & Volume By Pharmaceutical for the Period 2022-2032F
- Jordan Laboratory Furniture Import Export Trade Statistics
- Market Opportunity Assessment By Product Type
- Market Opportunity Assessment By Applications
- Jordan Laboratory Furniture Top Companies Market Share
- Jordan Laboratory Furniture Competitive Benchmarking By Technical and Operational Parameters
- Jordan Laboratory Furniture Company Profiles
- Jordan Laboratory Furniture Key Strategic Recommendations
Frequently Asked Questions About the Market Study (FAQs):
The market growth is primarily driven by increased investments in healthcare infrastructure, the expansion of research and educational institutions, and growing emphasis on compliance with laboratory safety standards.
The market includes a variety of products such as lab benches, cabinets, fume hoods, and other specialized furniture tailored for laboratory environments.
Key challenges include limited availability of high-quality materials, reliance on imports, infrastructure constraints, and regulatory compliance issues.
Investors can capitalize on the demand for modern, ergonomic, and sustainable laboratory furniture, alongside advancements in technology integration to address evolving user needs.
6Wresearch actively monitors the Jordan Laboratory Furniture Market and publishes its comprehensive annual report, highlighting emerging trends, growth drivers, revenue analysis, and forecast outlook. Our insights help businesses to make data-backed strategic decisions with ongoing market dynamics. Our analysts track relevent industries related to the Jordan Laboratory Furniture Market, allowing our clients with actionable intelligence and reliable forecasts tailored to emerging regional needs.
Yes, we provide customisation as per your requirements. To learn more, feel free to contact us on sales@6wresearch.com
1 Executive Summary |
2 Introduction |
2.1 Key Highlights of the Report |
2.2 Report Description |
2.3 Market Scope & Segmentation |
2.4 Research Methodology |
2.5 Assumptions |
3 Jordan Laboratory Furniture Market Overview |
3.1 Jordan Country Macro Economic Indicators |
3.2 Jordan Laboratory Furniture Market Revenues & Volume, 2022 & 2032F |
3.3 Jordan Laboratory Furniture Market - Industry Life Cycle |
3.4 Jordan Laboratory Furniture Market - Porter's Five Forces |
3.5 Jordan Laboratory Furniture Market Revenues & Volume Share, By Product Type, 2022 & 2032F |
3.6 Jordan Laboratory Furniture Market Revenues & Volume Share, By Applications, 2022 & 2032F |
4 Jordan Laboratory Furniture Market Dynamics |
4.1 Impact Analysis |
4.2 Market Drivers |
4.3 Market Restraints |
5 Jordan Laboratory Furniture Market Trends |
6 Jordan Laboratory Furniture Market, By Types |
6.1 Jordan Laboratory Furniture Market, By Product Type |
6.1.1 Overview and Analysis |
6.1.2 Jordan Laboratory Furniture Market Revenues & Volume, By Product Type, 2022-2032F |
6.1.3 Jordan Laboratory Furniture Market Revenues & Volume, By Lab Bench, 2022-2032F |
6.1.4 Jordan Laboratory Furniture Market Revenues & Volume, By Lab Cabinet, 2022-2032F |
6.1.5 Jordan Laboratory Furniture Market Revenues & Volume, By Fume Hood, 2022-2032F |
6.1.6 Jordan Laboratory Furniture Market Revenues & Volume, By Stool, 2022-2032F |
6.1.7 Jordan Laboratory Furniture Market Revenues & Volume, By Accessories, 2022-2032F |
6.2 Jordan Laboratory Furniture Market, By Applications |
6.2.1 Overview and Analysis |
6.2.2 Jordan Laboratory Furniture Market Revenues & Volume, By Education, 2022-2032F |
6.2.3 Jordan Laboratory Furniture Market Revenues & Volume, By Government, 2022-2032F |
6.2.4 Jordan Laboratory Furniture Market Revenues & Volume, By Industry, 2022-2032F |
6.2.5 Jordan Laboratory Furniture Market Revenues & Volume, By Research, 2022-2032F |
6.2.6 Jordan Laboratory Furniture Market Revenues & Volume, By Pharmaceutical, 2022-2032F |
7 Jordan Laboratory Furniture Market Import-Export Trade Statistics |
7.1 Jordan Laboratory Furniture Market Export to Major Countries |
7.2 Jordan Laboratory Furniture Market Imports from Major Countries |
8 Jordan Laboratory Furniture Market Key Performance Indicators |
9 Jordan Laboratory Furniture Market - Opportunity Assessment |
9.1 Jordan Laboratory Furniture Market Opportunity Assessment, By Product Type, 2022 & 2032F |
9.2 Jordan Laboratory Furniture Market Opportunity Assessment, By Applications, 2022 & 2032F |
10 Jordan Laboratory Furniture Market - Competitive Landscape |
10.1 Jordan Laboratory Furniture Market Revenue Share, By Companies, 2025 |
10.2 Jordan Laboratory Furniture Market Competitive Benchmarking, By Operating and Technical Parameters |
11 Company Profiles |
12 Recommendations |
13 Disclaimer |
Global Go To Market Strategy - 2030
Export potential enables firms to identify high-growth global markets with greater confidence by combining advanced trade intelligence with a structured quantitative methodology. The framework analyzes emerging demand trends and country-level import patterns while integrating macroeconomic and trade datasets such as GDP and population forecasts, bilateral import–export flows, tariff structures, elasticity differentials between developed and developing economies, geographic distance, and import demand projections. Using weighted trade values from 2020–2024 as the base period to project country-to-country export potential for 2030, these inputs are operationalized through calculated drivers such as gravity model parameters, tariff impact factors, and projected GDP per-capita growth. Through an analysis of hidden potentials, demand hotspots, and market conditions that are most favorable to success, this method enables firms to focus on target countries, maximize returns, and global expansion with data, backed by accuracy.
By factoring in the projected importer demand gap that is currently unmet and could be potential opportunity, it identifies the potential for the Exporter (Country) among 190 countries, against the general trade analysis, which identifies the biggest importer or exporter.
To discover high-growth global markets and optimize your business strategy:
Click Here
Pricing
- Single User License$ 1,995
- Department License$ 2,400
- Site License$ 3,120
- Global License$ 3,795

Leadership Perspectives from Industry Events
Search
Thought Leadership and Analyst Meet


Our Clients
6WResearch In News
- India Air Conditioner Market Set for Strong Rebound in 2026 After Weather-Led Correction and GST-Driven Recovery: 6Wresearch
- ADAS in India: How Automatic Emergency Braking, Blind Spot Detection & Driver Monitoring are Transforming Road Safety
- Doha a strategic location for EV manufacturing hub: IPA Qatar
- Demand for luxury TVs surging in the GCC, says Samsung
- Empowering Growth: The Thriving Journey of Bangladesh’s Cable Industry
- Demand for luxury TVs surging in the GCC, says Samsung
Latest Reports
- Nicaragua RPG Gaming Market (2026-2032)
- New Zealand RPG Gaming Market (2026-2032)
- Netherlands RPG Gaming Market (2026-2032)
- Nauru RPG Gaming Market (2026-2032)
- Namibia RPG Gaming Market (2026-2032)
- Mozambique RPG Gaming Market (2026-2032)
- Montenegro RPG Gaming Market (2026-2032)
- Mongolia RPG Gaming Market (2026-2032)
- Monaco RPG Gaming Market (2026-2032)
- Micronesia RPG Gaming Market (2026-2032)
Industry Events and Analyst Meet

EV India Expo 2026

HIMTEX 2026

India Refining Summit 2026

India EV Show 2026

EV tech India Expo 2026
Whitepaper
- Middle East & Africa Commercial Security Market Click here to view more.
- Middle East & Africa Fire Safety Systems & Equipment Market Click here to view more.
- GCC Drone Market Click here to view more.
- Middle East Lighting Fixture Market Click here to view more.
- GCC Physical & Perimeter Security Market Click here to view more.