Jordan N-propanol Market (2025-2031) Outlook | Companies, Growth, Value, Trends, Analysis, Size, Forecast, Revenue, Share & Industry
Market Forecast By Type (Ethylene Hydrogenation Method, Allyl Alcohol Hydrogenation Method, Other Compounds Byproduct Method), By Application (Coatings, Food Additive, Pharmaceutical, Cosmetics, Others) And Competitive Landscape
| Product Code: ETC335086 | Publication Date: Aug 2022 | Updated Date: Aug 2025 | Product Type: Market Research Report | |
| Publisher: 6Wresearch | Author: Shubham Padhi | No. of Pages: 75 | No. of Figures: 35 | No. of Tables: 20 |
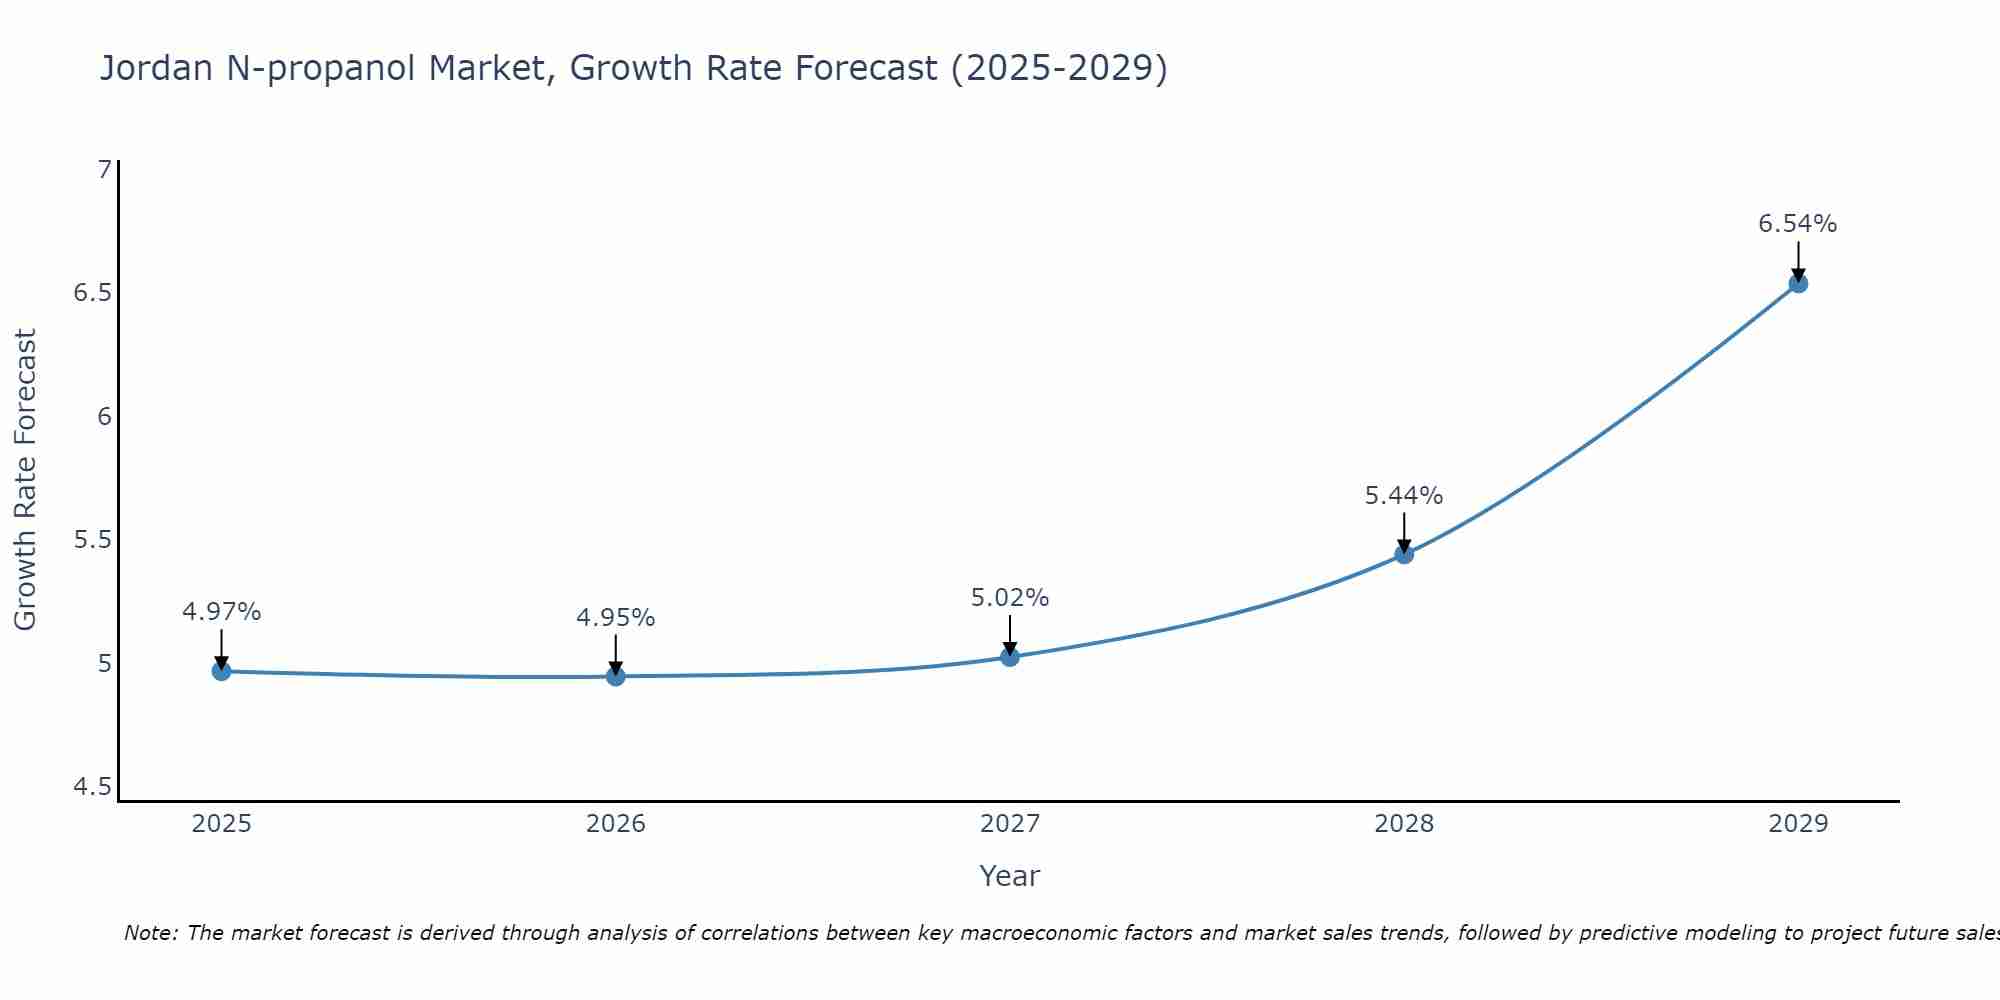
Jordan N-propanol Market Size Growth Rate
The Jordan N-propanol Market is projected to witness mixed growth rate patterns during 2025 to 2029. Commencing at 4.97% in 2025, growth builds up to 6.54% by 2029.
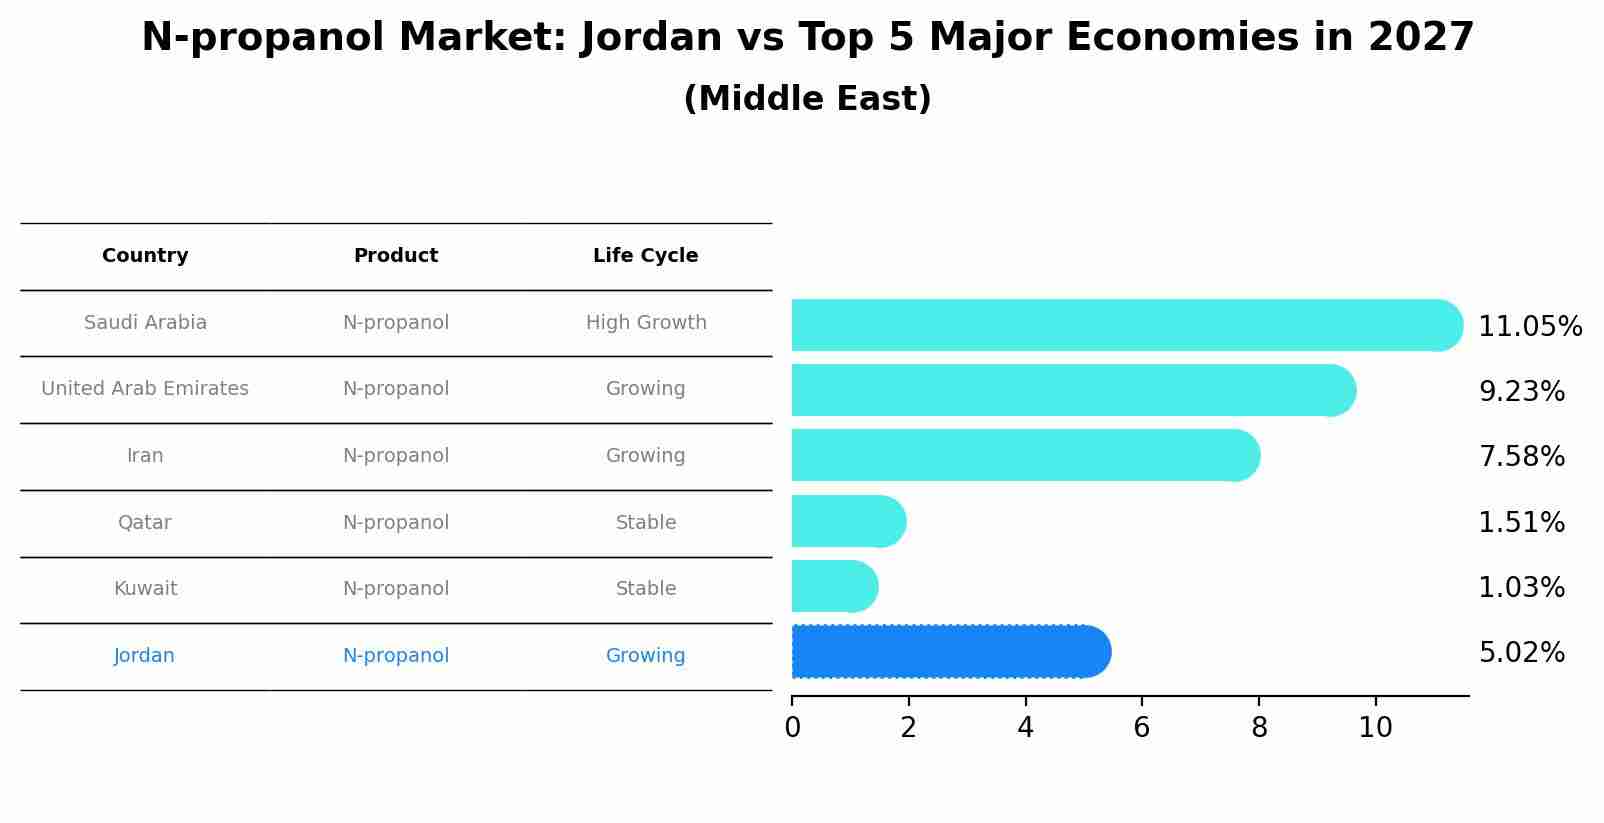
N-propanol Market: Jordan vs Top 5 Major Economies in 2027 (Middle East)
Jordan's N-propanol market is anticipated to experience a growing growth rate of 5.02% by 2027, reflecting trends observed in the largest economy Saudi Arabia, followed by United Arab Emirates, Iran, Qatar and Kuwait.
Jordan N-propanol Market Overview
The N-propanol market in Jordan is witnessing growth as the chemical compound finds applications in various industries, including pharmaceuticals, coatings, printing inks, and cosmetics. N-propanol, also known as 1-propanol, is a solvent and intermediate used in the synthesis of pharmaceuticals, fragrances, and specialty chemicals. The market expansion is driven by industrial growth, manufacturing activities, and the demand for high-purity solvents for critical processes.
Drivers of the market
The N-propanol market in Jordan is driven by its increasing use as a solvent in various industries, including pharmaceuticals, cosmetics, and paints. The growing demand for personal care products and industrial applications supports market expansion.
Challenges of the market
The N-propanol market in Jordan is constrained by high production costs and regulatory compliance. Producing N-propanol, a solvent used in various industrial applications, involves significant investment in manufacturing infrastructure and raw materials. Ensuring the quality and safety of N-propanol while keeping production costs manageable is a persistent challenge. The market also faces stringent regulatory requirements that necessitate adherence to high standards of safety and environmental compliance. Additionally, there is a need for skilled professionals who can manage the production and quality control of N-propanol. Market players must invest in sustainable practices to address these challenges effectively.
Government Policy of the market
Government policies in Jordan for the N-propanol market focus on ensuring product quality, safety, and environmental sustainability. Regulations govern the production, transportation, and use of N-propanol, with a focus on occupational health, chemical safety, and pollution prevention measures. Additionally, the government supports initiatives that promote research, innovation, and responsible manufacturing practices in the N-propanol industry.
Key Highlights of the Report:
- Jordan N-propanol Market Outlook
- Market Size of Jordan N-propanol Market, 2024
- Forecast of Jordan N-propanol Market, 2031
- Historical Data and Forecast of Jordan N-propanol Revenues & Volume for the Period 2021-2031
- Jordan N-propanol Market Trend Evolution
- Jordan N-propanol Market Drivers and Challenges
- Jordan N-propanol Price Trends
- Jordan N-propanol Porter's Five Forces
- Jordan N-propanol Industry Life Cycle
- Historical Data and Forecast of Jordan N-propanol Market Revenues & Volume By Type for the Period 2021-2031
- Historical Data and Forecast of Jordan N-propanol Market Revenues & Volume By Ethylene Hydrogenation Method for the Period 2021-2031
- Historical Data and Forecast of Jordan N-propanol Market Revenues & Volume By Allyl Alcohol Hydrogenation Method for the Period 2021-2031
- Historical Data and Forecast of Jordan N-propanol Market Revenues & Volume By Other Compounds Byproduct Method for the Period 2021-2031
- Historical Data and Forecast of Jordan N-propanol Market Revenues & Volume By Application for the Period 2021-2031
- Historical Data and Forecast of Jordan N-propanol Market Revenues & Volume By Coatings for the Period 2021-2031
- Historical Data and Forecast of Jordan N-propanol Market Revenues & Volume By Food Additive for the Period 2021-2031
- Historical Data and Forecast of Jordan N-propanol Market Revenues & Volume By Pharmaceutical for the Period 2021-2031
- Historical Data and Forecast of Jordan N-propanol Market Revenues & Volume By Cosmetics for the Period 2021-2031
- Historical Data and Forecast of Jordan N-propanol Market Revenues & Volume By Others for the Period 2021-2031
- Jordan N-propanol Import Export Trade Statistics
- Market Opportunity Assessment By Type
- Market Opportunity Assessment By Application
- Jordan N-propanol Top Companies Market Share
- Jordan N-propanol Competitive Benchmarking By Technical and Operational Parameters
- Jordan N-propanol Company Profiles
- Jordan N-propanol Key Strategic Recommendations
Frequently Asked Questions About the Market Study (FAQs):
6Wresearch actively monitors the Jordan N-propanol Market and publishes its comprehensive annual report, highlighting emerging trends, growth drivers, revenue analysis, and forecast outlook. Our insights help businesses to make data-backed strategic decisions with ongoing market dynamics. Our analysts track relevent industries related to the Jordan N-propanol Market, allowing our clients with actionable intelligence and reliable forecasts tailored to emerging regional needs.
Yes, we provide customisation as per your requirements. To learn more, feel free to contact us on sales@6wresearch.com
1 Executive Summary |
2 Introduction |
2.1 Key Highlights of the Report |
2.2 Report Description |
2.3 Market Scope & Segmentation |
2.4 Research Methodology |
2.5 Assumptions |
3 Jordan N-propanol Market Overview |
3.1 Jordan Country Macro Economic Indicators |
3.2 Jordan N-propanol Market Revenues & Volume, 2021 & 2031F |
3.3 Jordan N-propanol Market - Industry Life Cycle |
3.4 Jordan N-propanol Market - Porter's Five Forces |
3.5 Jordan N-propanol Market Revenues & Volume Share, By Type, 2021 & 2031F |
3.6 Jordan N-propanol Market Revenues & Volume Share, By Application, 2021 & 2031F |
4 Jordan N-propanol Market Dynamics |
4.1 Impact Analysis |
4.2 Market Drivers |
4.2.1 Increasing demand for solvents and chemical intermediates in various industries |
4.2.2 Growing adoption of n-propanol as a solvent in pharmaceuticals and cosmetics |
4.2.3 Expansion of manufacturing and construction sectors in the region |
4.3 Market Restraints |
4.3.1 Fluctuating prices of raw materials such as propylene and ethylene |
4.3.2 Stringent regulations on the usage of volatile organic compounds (VOCs) in manufacturing processes |
5 Jordan N-propanol Market Trends |
6 Jordan N-propanol Market, By Types |
6.1 Jordan N-propanol Market, By Type |
6.1.1 Overview and Analysis |
6.1.2 Jordan N-propanol Market Revenues & Volume, By Type, 2021-2031F |
6.1.3 Jordan N-propanol Market Revenues & Volume, By Ethylene Hydrogenation Method, 2021-2031F |
6.1.4 Jordan N-propanol Market Revenues & Volume, By Allyl Alcohol Hydrogenation Method, 2021-2031F |
6.1.5 Jordan N-propanol Market Revenues & Volume, By Other Compounds Byproduct Method, 2021-2031F |
6.2 Jordan N-propanol Market, By Application |
6.2.1 Overview and Analysis |
6.2.2 Jordan N-propanol Market Revenues & Volume, By Coatings, 2021-2031F |
6.2.3 Jordan N-propanol Market Revenues & Volume, By Food Additive, 2021-2031F |
6.2.4 Jordan N-propanol Market Revenues & Volume, By Pharmaceutical, 2021-2031F |
6.2.5 Jordan N-propanol Market Revenues & Volume, By Cosmetics, 2021-2031F |
6.2.6 Jordan N-propanol Market Revenues & Volume, By Others, 2021-2031F |
7 Jordan N-propanol Market Import-Export Trade Statistics |
7.1 Jordan N-propanol Market Export to Major Countries |
7.2 Jordan N-propanol Market Imports from Major Countries |
8 Jordan N-propanol Market Key Performance Indicators |
8.1 Capacity utilization rate of n-propanol production facilities |
8.2 Percentage of market share held by n-propanol compared to alternative solvents |
8.3 Number of new applications or industries adopting n-propanol |
8.4 Average selling price of n-propanol compared to historical data |
8.5 Rate of investment in research and development for n-propanol products |
9 Jordan N-propanol Market - Opportunity Assessment |
9.1 Jordan N-propanol Market Opportunity Assessment, By Type, 2021 & 2031F |
9.2 Jordan N-propanol Market Opportunity Assessment, By Application, 2021 & 2031F |
10 Jordan N-propanol Market - Competitive Landscape |
10.1 Jordan N-propanol Market Revenue Share, By Companies, 2024 |
10.2 Jordan N-propanol Market Competitive Benchmarking, By Operating and Technical Parameters |
11 Company Profiles |
12 Recommendations |
13 Disclaimer |
Global Go To Market Strategy - 2030
Export potential enables firms to identify high-growth global markets with greater confidence by combining advanced trade intelligence with a structured quantitative methodology. The framework analyzes emerging demand trends and country-level import patterns while integrating macroeconomic and trade datasets such as GDP and population forecasts, bilateral import–export flows, tariff structures, elasticity differentials between developed and developing economies, geographic distance, and import demand projections. Using weighted trade values from 2020–2024 as the base period to project country-to-country export potential for 2030, these inputs are operationalized through calculated drivers such as gravity model parameters, tariff impact factors, and projected GDP per-capita growth. Through an analysis of hidden potentials, demand hotspots, and market conditions that are most favorable to success, this method enables firms to focus on target countries, maximize returns, and global expansion with data, backed by accuracy.
By factoring in the projected importer demand gap that is currently unmet and could be potential opportunity, it identifies the potential for the Exporter (Country) among 190 countries, against the general trade analysis, which identifies the biggest importer or exporter.
To discover high-growth global markets and optimize your business strategy:
Click Here
Pricing
- Single User License$ 1,995
- Department License$ 2,400
- Site License$ 3,120
- Global License$ 3,795

Leadership Perspectives from Industry Events
Search
Thought Leadership and Analyst Meet


Our Clients
6WResearch In News
- Doha a strategic location for EV manufacturing hub: IPA Qatar
- Demand for luxury TVs surging in the GCC, says Samsung
- Empowering Growth: The Thriving Journey of Bangladesh’s Cable Industry
- Demand for luxury TVs surging in the GCC, says Samsung
- Video call with a traditional healer? Once unthinkable, it’s now common in South Africa
- Intelligent Buildings To Smooth GCC’s Path To Net Zero
Latest Reports
- New Zealand Aseptic Manufacturing Market (2026-2032)
- Netherlands Aseptic Manufacturing Market (2026-2032)
- Nauru Aseptic Manufacturing Market (2026-2032)
- Namibia Aseptic Manufacturing Market (2026-2032)
- Mozambique Aseptic Manufacturing Market (2026-2032)
- Montenegro Aseptic Manufacturing Market (2026-2032)
- Mongolia Aseptic Manufacturing Market (2026-2032)
- Monaco Aseptic Manufacturing Market (2026-2032)
- Micronesia Aseptic Manufacturing Market (2026-2032)
- Mauritius Aseptic Manufacturing Market (2026-2032)
Industry Events and Analyst Meet

HIMTEX 2026

India Refining Summit 2026

India EV Show 2026

EV tech India Expo 2026

Auto Tech Asia 2026
Whitepaper
- Middle East & Africa Commercial Security Market Click here to view more.
- Middle East & Africa Fire Safety Systems & Equipment Market Click here to view more.
- GCC Drone Market Click here to view more.
- Middle East Lighting Fixture Market Click here to view more.
- GCC Physical & Perimeter Security Market Click here to view more.