Jordan Paints & varnishes Market (2026-2032) | Trends, Companies, Share, Value, Size, Forecast, Outlook, Growth, Revenue, Analysis, COVID-19 IMPACT & Industry
Market Forecast By Type (Water-borne paints and varnishes, Solvent-borne paints and varnishes, Others), By Applications (Transportations paints and varnishes, Industrial paints and varnishes, Construction paints and varnishes) And Competitive Landscape
| Product Code: ETC017766 | Publication Date: Jun 2023 | Product Type: Report | ||
| Publisher: 6Wresearch | Author: Ravi Bhandari | No. of Pages: 70 | No. of Figures: 35 | No. of Tables: 5 |
Jordan Paints & varnishes Market Summary
The jordan paints & varnishes market was estimated at USD 630 Million in 2025 and is projected to reach USD 1116 Million by 2032, growing at a CAGR of 9.8% from 2026 to 2032.
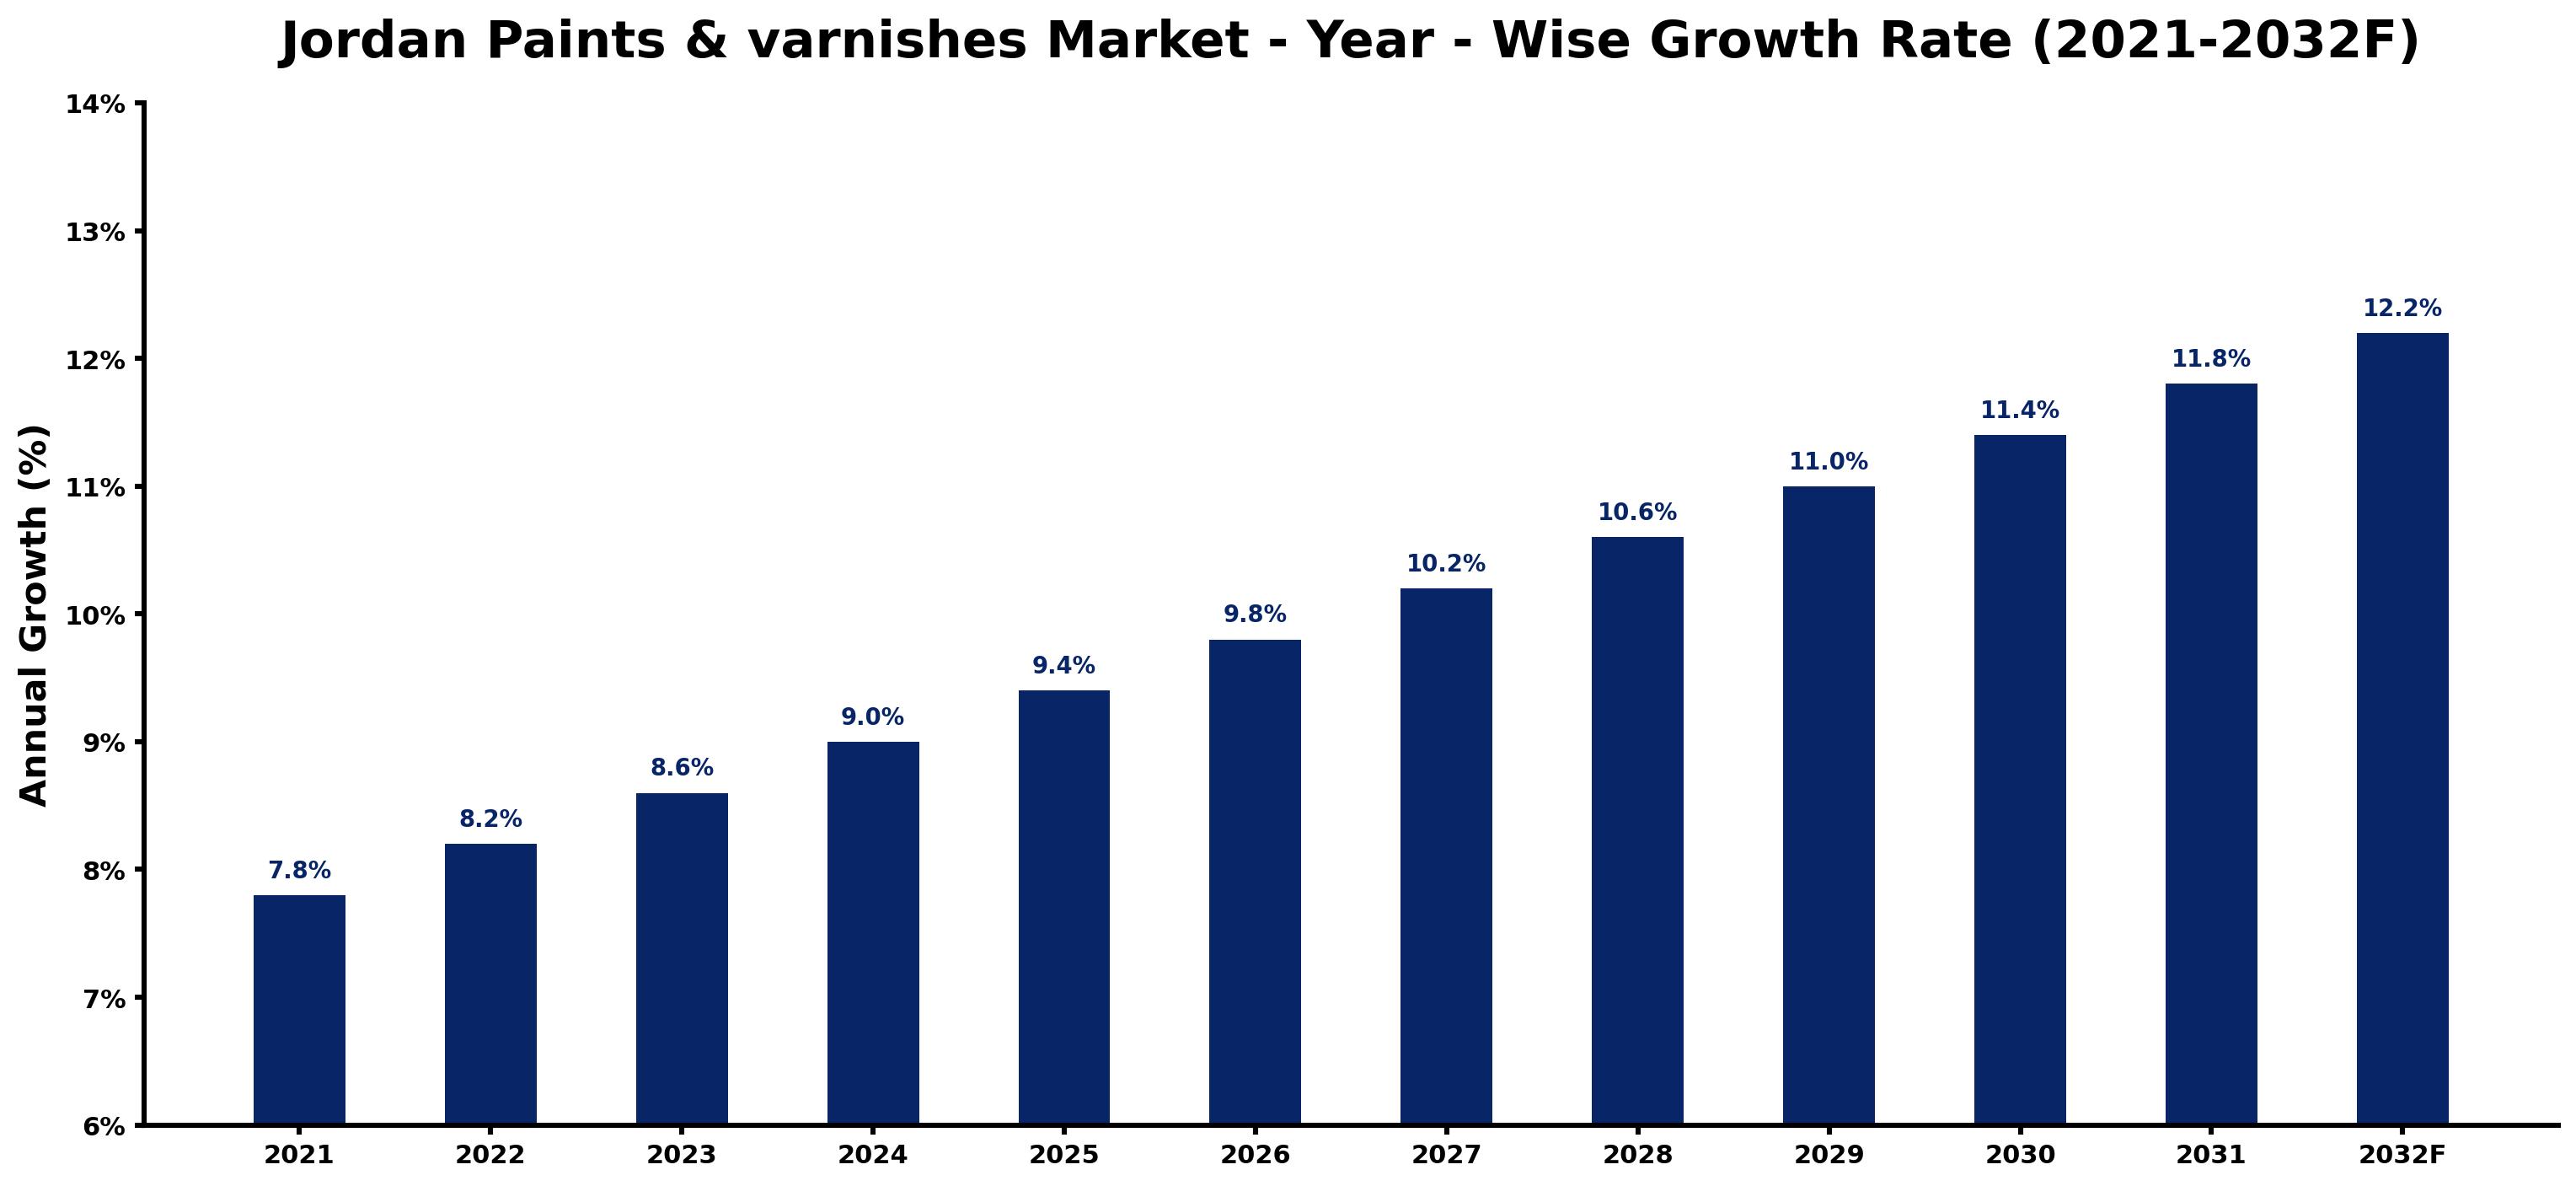
Jordan Paints & varnishes Market Growth Rate Analysis (2021-2032)
The Jordan paints and varnishes market is experiencing robust growth, reflecting an upward trend fueled by rising consumer demand and significant investments in the construction sector. In 2021, the market saw a growth rate of 7.8%, which escalated to 8.2% in 2022 and further to 8.6% in 2023. This momentum is expected to maintain momentum, with projections of 9.0% in 2024 and climbing steadily to 12.2% by 2032. The increasing focus on eco-friendly products, alongside advancements in digitalization and infrastructure projects, is driving innovation and market expansion. This favorable environment presents ample opportunities for stakeholders aiming to capitalize on the evolving landscape of Jordan's paints and varnishes industry.
Jordan Paints & varnishes Market Year-wise Growth Rate and Key Drivers
This graph highlights how the Jordan Paints & varnishes Market has steadily grown over the past five years, supported by major growth factors.
The table below presents the year wise growth rates along with the key drivers influencing the market
| Year | Growth Rate | Major Drivers |
| 2021 | 7.8% | Post-lockdown retail projects in urban areas bolster paint consumption significantly. |
| 2022 | 8.2% | Construction sector recovery fuels demand for decorative and protective coatings. |
| 2023 | 8.6% | Local manufacturers focus on eco-friendly products, aligning with consumer preferences. |
| 2024 | 9.0% | Expansion of residential developments in Amman drives increased varnish utilization. |
| 2025 | 9.4% | Emergence of sustainable practices encourages investments in green coating technologies. |
| 2026 | 9.8% | Increased tourism leads to higher demand for aesthetically pleasing commercial spaces. |
| 2027 | 10.2% | Infrastructure projects, including transport networks, boost industrial coating requirements. |
| 2028 | 10.6% | Urbanization intensifies, with more buildings needing durable protective finishes. |
| 2029 | 11.0% | Technological innovations in paint applications enhance efficiency and reduce waste. |
| 2030 | 11.4% | Focus on maintenance and renovation projects revitalizes existing structures significantly. |
| 2031 | 11.8% | Shifts towards smart building solutions promote integrated paint and coating systems. |
| 2032 | 12.2% | Market diversification encourages niche products, catering to specialized customer needs. |
Note - Market size estimations and growth projections presented in this report are based on 6Wresearch's advanced forecasting approach, validated with industry datasets as of June 2026.
Jordan Paints & varnishes Market Synopsis
The Jordan Paints varnishes Market is projected to reach 9.8% and witness significant growth during the forecast period (2026-2032). The market is characterized by a robust increase in demand driven by several converging factors, including rapid urbanization, rising living standards, and an increase in disposable income. Consumer preferences are evolving, leading to a shift towards both decorative and protective coatings. In particular, a vigorous housing construction sector is playing a pivotal role in propelling the demand for paints and varnishes across various applications.
Jordan Paints & varnishes Market Growth Drivers
A multitude of factors is fueling the growth of the Jordan Paints & varnishes Market. First and foremost, the ongoing urbanization trend is leading to an uptick in housing projects, which significantly boosts the need for a variety of paints and varnishes. Moreover, as living standards improve, consumers are increasingly inclined to invest in high-quality decorative finishes for their homes and businesses. Additionally, the rise in disposable income allows for greater spending on aesthetic improvements and maintenance. These elements amalgamate to create a conducive environment for market growth.
- The surge in residential and commercial construction is a primary driver, necessitating a wide range of coatings.
- Sustainability trends are prompting manufacturers to develop eco-friendly products that align with consumer preferences.
- Advancements in formulation and technology are enhancing product performance, making paints and varnishes more appealing.
- Government initiatives promoting sustainable construction practices are driving demand for compliant coatings.
- The influence of international standards is pushing local manufacturers to innovate and improve their offerings.
Jordan Paints & varnishes Market Trends and Opportunities
Current trends within the Jordan Paints & varnishes Market are reflective of broader shifts towards sustainability and quality in product offerings. Eco-friendly paints with low volatile organic compound (VOC) emissions are gaining traction as consumers become more environmentally conscious. This trend is further supported by government initiatives aimed at sustainable development, which encourage innovation in product formulations that adhere to stringent environmental regulations.
- Use of advanced digital technologies in marketing and distribution is transforming how products reach consumers.
- Emerging DIY trends are encouraging consumers to undertake their own home improvement projects, thereby increasing demand for user-friendly paints.
- The introduction of smart paints, capable of changing color or texture, is anticipated to create new market segments.
- Partnerships between manufacturers and retailers are enhancing market penetration and product visibility.
- Growing awareness about the long-term benefits of high-quality coatings is influencing consumer purchasing decisions.
Jordan Paints & varnishes Market Challenges and Restraints
Despite the encouraging growth trajectory of the Jordan Paints & varnishes Market, several challenges persist. Fluctuating raw material prices can impact production costs and subsequently the pricing structures of final products. Moreover, the presence of low-cost alternatives in the market can deter consumers from investing in premium products. Additionally, adhering to environmental regulations can pose challenges for manufacturers, particularly those transitioning from traditional practices to more sustainable methods.
- The volatility of raw material prices can create uncertainty in production budgets and pricing strategies.
- Intense competition from low-cost alternatives can challenge established brands seeking to maintain market share.
- Navigating complex regulations surrounding environmental standards can complicate production processes.
- Consumer reluctance to pay a premium for high-quality products can hinder growth potential.
- Supply chain disruptions can affect the timely availability of products in the market.
Jordan Paints & varnishes Market Government Investment and Initiatives
The Jordanian government has undertaken various initiatives aimed at bolstering the paints and varnishes market. Investment in infrastructure projects has seen a significant uptick, leading to increased demand for construction materials, including paints and coatings. Moreover, public spending on sustainability initiatives is encouraging manufacturers to align their products with eco-friendly standards. The government is also promoting public awareness about the benefits of sustainable construction practices, which in turn supports the demand for compliant products.
- Government-funded training programs for manufacturers are paving the way for shifts towards sustainable production.
- Policy frameworks supporting green initiatives are incentivizing companies to innovate.
- Investment in urban development projects is catalyzing a need for protective and decorative coatings.
- Public-private partnerships are being fostered to improve market efficiency and responsiveness to consumer needs.
- Regulatory reforms aimed at encouraging local manufacturing are helping to stimulate market growth.
Jordan Paints & varnishes Market Latest Developments (May 2025 - June 2026)
In the period spanning May 2025 to June 2026, the Jordan Paints & varnishes Market witnessed a series of developments reflective of industry trends. Manufacturers have increasingly focused on developing eco-friendly and low-VOC products in response to consumer demand for sustainable options. Furthermore, the integration of digital technologies in the supply chain has enhanced distribution efficiency, allowing for quicker delivery of products to end consumers. The market is also experiencing a rise in collaborations aimed at harnessing innovative technologies that boost product performance and quality. These trends indicate a vibrant market landscape poised for growth.
Jordan Paints & varnishes Market - Key Attractiveness of the Report
- 10 Years of Market Numbers
- Historical Data Starting from 2022 to 2025
- Base Year: 2025
- Forecast Data until 2032
- Key Performance Indicators Impacting the Market
- Major Upcoming Developments and Projects
Key Highlights of the Report:
- Jordan Paints & varnishes Market Outlook
- Market Size of Jordan Paints & varnishes Market, 2025
- Forecast of Jordan Paints & varnishes Market, 2032F
- Historical Data and Forecast of Jordan Paints & varnishes Revenues & Volume for the Period 2022-2032F
- Jordan Paints & varnishes Market Trend Evolution
- Jordan Paints & varnishes Market Drivers and Challenges
- Jordan Paints & varnishes Price Trends
- Jordan Paints & varnishes Porter's Five Forces
- Jordan Paints & varnishes Industry Life Cycle
- Historical Data and Forecast of Jordan Paints & varnishes Market Revenues & Volume By Type for the Period 2022-2032F
- Historical Data and Forecast of Jordan Paints & varnishes Market Revenues & Volume By Water-borne paints and varnishes for the Period 2022-2032F
- Historical Data and Forecast of Jordan Paints & varnishes Market Revenues & Volume By Solvent-borne paints and varnishes for the Period 2022-2032F
- Historical Data and Forecast of Jordan Paints & varnishes Market Revenues & Volume By Others for the Period 2022-2032F
- Historical Data and Forecast of Jordan Paints & varnishes Market Revenues & Volume By Applications for the Period 2022-2032F
- Historical Data and Forecast of Jordan Paints & varnishes Market Revenues & Volume By Transportations paints and varnishes for the Period 2022-2032F
- Historical Data and Forecast of Jordan Paints & varnishes Market Revenues & Volume By Industrial paints and varnishes for the Period 2022-2032F
- Historical Data and Forecast of Jordan Paints & varnishes Market Revenues & Volume By Construction paints and varnishes for the Period 2022-2032F
- Jordan Paints & varnishes Import Export Trade Statistics
- Market Opportunity Assessment By Type
- Market Opportunity Assessment By Applications
- Jordan Paints & varnishes Top Companies Market Share
- Jordan Paints & varnishes Competitive Benchmarking By Technical and Operational Parameters
- Jordan Paints & varnishes Company Profiles
- Jordan Paints & varnishes Key Strategic Recommendations
Frequently Asked Questions About the Market Study (FAQs):
Key drivers include urbanization, improved living standards, and a focus on eco-friendly products.
The government is investing in infrastructure and promoting sustainable practices that boost demand for compliant coatings.
Challenges include fluctuating raw material prices, competition from low-cost alternatives, and regulatory compliance.
Emerging trends include the rise of digital technologies, DIY projects, and the development of smart paints.
6Wresearch actively monitors the Jordan Paints & varnishes Market and publishes its comprehensive annual report, highlighting emerging trends, growth drivers, revenue analysis, and forecast outlook. Our insights help businesses to make data-backed strategic decisions with ongoing market dynamics. Our analysts track relevent industries related to the Jordan Paints & varnishes Market, allowing our clients with actionable intelligence and reliable forecasts tailored to emerging regional needs.
Yes, we provide customisation as per your requirements. To learn more, feel free to contact us on sales@6wresearch.com
1 Executive Summary |
2 Introduction |
2.1 Key Highlights of the Report |
2.2 Report Description |
2.3 Market Scope & Segmentation |
2.4 Research Methodology |
2.5 Assumptions |
3 Jordan Paints & varnishes Market Overview |
3.1 Jordan Country Macro Economic Indicators |
3.2 Jordan Paints & varnishes Market Revenues & Volume, 2022 & 2032F |
3.3 Jordan Paints & varnishes Market - Industry Life Cycle |
3.4 Jordan Paints & varnishes Market - Porter's Five Forces |
3.5 Jordan Paints & varnishes Market Revenues & Volume Share, By Type, 2022 & 2032F |
3.6 Jordan Paints & varnishes Market Revenues & Volume Share, By Applications, 2022 & 2032F |
4 Jordan Paints & varnishes Market Dynamics |
4.1 Impact Analysis |
4.2 Market Drivers |
4.3 Market Restraints |
5 Jordan Paints & varnishes Market Trends |
6 Jordan Paints & varnishes Market, By Types |
6.1 Jordan Paints & varnishes Market, By Type |
6.1.1 Overview and Analysis |
6.1.2 Jordan Paints & varnishes Market Revenues & Volume, By Type, 2022-2032F |
6.1.3 Jordan Paints & varnishes Market Revenues & Volume, By Water-borne paints and varnishes, 2022-2032F |
6.1.4 Jordan Paints & varnishes Market Revenues & Volume, By Solvent-borne paints and varnishes, 2022-2032F |
6.1.5 Jordan Paints & varnishes Market Revenues & Volume, By Others, 2022-2032F |
6.2 Jordan Paints & varnishes Market, By Applications |
6.2.1 Overview and Analysis |
6.2.2 Jordan Paints & varnishes Market Revenues & Volume, By Transportations paints and varnishes, 2022-2032F |
6.2.3 Jordan Paints & varnishes Market Revenues & Volume, By Industrial paints and varnishes, 2022-2032F |
6.2.4 Jordan Paints & varnishes Market Revenues & Volume, By Construction paints and varnishes, 2022-2032F |
7 Jordan Paints & varnishes Market Import-Export Trade Statistics |
7.1 Jordan Paints & varnishes Market Export to Major Countries |
7.2 Jordan Paints & varnishes Market Imports from Major Countries |
8 Jordan Paints & varnishes Market Key Performance Indicators |
9 Jordan Paints & varnishes Market - Opportunity Assessment |
9.1 Jordan Paints & varnishes Market Opportunity Assessment, By Type, 2022 & 2032F |
9.2 Jordan Paints & varnishes Market Opportunity Assessment, By Applications, 2022 & 2032F |
10 Jordan Paints & varnishes Market - Competitive Landscape |
10.1 Jordan Paints & varnishes Market Revenue Share, By Companies, 2025 |
10.2 Jordan Paints & varnishes Market Competitive Benchmarking, By Operating and Technical Parameters |
11 Company Profiles |
12 Recommendations |
13 Disclaimer |
Global Go To Market Strategy - 2030
Export potential enables firms to identify high-growth global markets with greater confidence by combining advanced trade intelligence with a structured quantitative methodology. The framework analyzes emerging demand trends and country-level import patterns while integrating macroeconomic and trade datasets such as GDP and population forecasts, bilateral import–export flows, tariff structures, elasticity differentials between developed and developing economies, geographic distance, and import demand projections. Using weighted trade values from 2020–2024 as the base period to project country-to-country export potential for 2030, these inputs are operationalized through calculated drivers such as gravity model parameters, tariff impact factors, and projected GDP per-capita growth. Through an analysis of hidden potentials, demand hotspots, and market conditions that are most favorable to success, this method enables firms to focus on target countries, maximize returns, and global expansion with data, backed by accuracy.
By factoring in the projected importer demand gap that is currently unmet and could be potential opportunity, it identifies the potential for the Exporter (Country) among 190 countries, against the general trade analysis, which identifies the biggest importer or exporter.
To discover high-growth global markets and optimize your business strategy:
Click Here
Pricing
- Single User License$ 1,995
- Department License$ 2,400
- Site License$ 3,120
- Global License$ 3,795

Leadership Perspectives from Industry Events
Search
Thought Leadership and Analyst Meet


Our Clients
6WResearch In News
- India Air Conditioner Market Set for Strong Rebound in 2026 After Weather-Led Correction and GST-Driven Recovery: 6Wresearch
- ADAS in India: How Automatic Emergency Braking, Blind Spot Detection & Driver Monitoring are Transforming Road Safety
- Doha a strategic location for EV manufacturing hub: IPA Qatar
- Demand for luxury TVs surging in the GCC, says Samsung
- Empowering Growth: The Thriving Journey of Bangladesh’s Cable Industry
- Demand for luxury TVs surging in the GCC, says Samsung
Latest Reports
- Nicaragua RPG Gaming Market (2026-2032)
- New Zealand RPG Gaming Market (2026-2032)
- Netherlands RPG Gaming Market (2026-2032)
- Nauru RPG Gaming Market (2026-2032)
- Namibia RPG Gaming Market (2026-2032)
- Mozambique RPG Gaming Market (2026-2032)
- Montenegro RPG Gaming Market (2026-2032)
- Mongolia RPG Gaming Market (2026-2032)
- Monaco RPG Gaming Market (2026-2032)
- Micronesia RPG Gaming Market (2026-2032)
Industry Events and Analyst Meet

HIMTEX 2026

India Refining Summit 2026

India EV Show 2026

EV tech India Expo 2026

Auto Tech Asia 2026
Whitepaper
- Middle East & Africa Commercial Security Market Click here to view more.
- Middle East & Africa Fire Safety Systems & Equipment Market Click here to view more.
- GCC Drone Market Click here to view more.
- Middle East Lighting Fixture Market Click here to view more.
- GCC Physical & Perimeter Security Market Click here to view more.