Jordan Power Bank Market (2026-2032) | Forecast, Outlook, Growth, Industry, Revenue, Trends, Companies, Size, Analysis, Share & Value
Market Forecast By Capacity Range (Up to 3,000 mAh, 3,001 mAh-8,000 mAh, 8,001 mAh-20,000 mAh, Above 20,000 mAh), By Energy Source (Electric, Solar), By Battery Type (Lithium-ion, Lithium Polymer), By Distribution Channel (E-commerce, Brick and Mortar) And Competitive Landscape
| Product Code: ETC012186 | Publication Date: Oct 2020 | Updated Date: Jun 2026 | Product Type: Report | |
| Publisher: 6Wresearch | Author: Ravi Bhandari | No. of Pages: 70 | No. of Figures: 35 | No. of Tables: 5 |
Jordan Power Bank Market Summary
The jordan power bank market was estimated at USD 307 Million in 2025 and is projected to reach USD 408 Million by 2032, growing at a CAGR of 5.0% from 2026 to 2032.
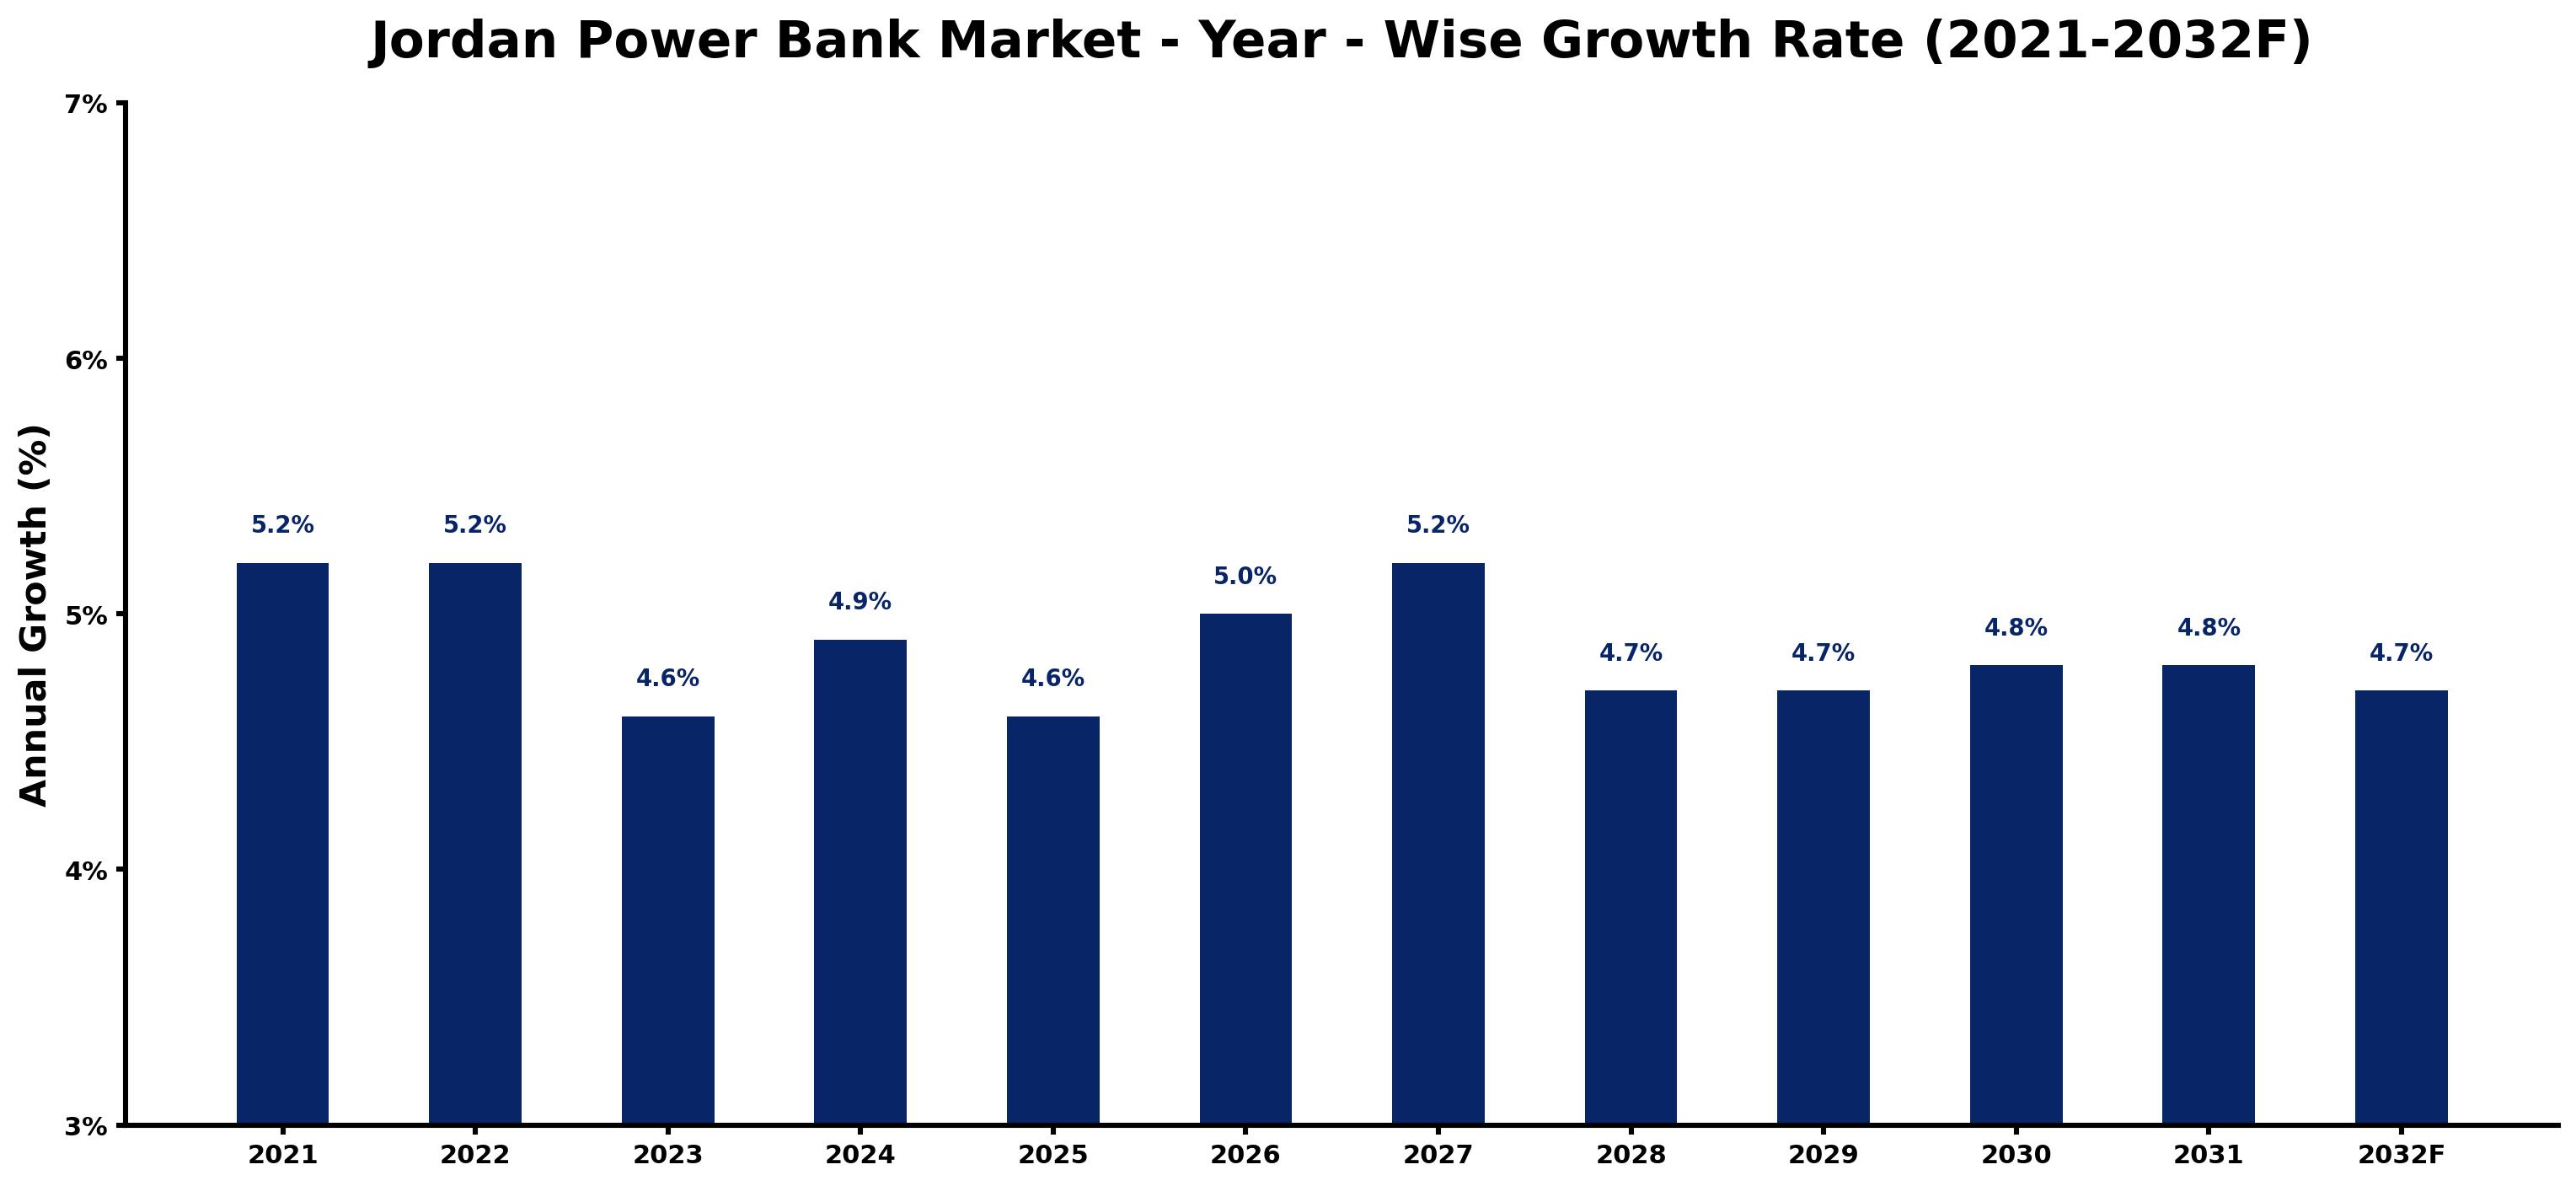
Jordan Power Bank Market Growth Rate Analysis (2021-2032)
The Jordan Power Bank Market experienced stable growth, reflecting a resilient consumer demand for portable energy solutions. In 2021 and 2022, the market grew by 5.2%, driven by increased smartphone penetration and a surge in digital connectivity. Although growth moderated to 4.6% in 2023, factors such as evolving technology and shifts in consumer preferences continued to support investments in product innovation. Projections indicate growth rebounding to 5.0% in 2026, as energy transition initiatives and improved infrastructure bolster market dynamics. Notably, fluctuations between 4.6% to 5.2% from 2024 to 2032 highlight the market's adaptability amid a stable environment, emphasizing enduring consumer reliance on power banks for their daily technological needs.
Jordan Power Bank Market Year-wise Growth Rate and Key Drivers
This graph highlights how the Jordan Power Bank Market has steadily grown over the past five years, supported by major growth factors.
The table below presents the year wise growth rates along with the key drivers influencing the market
| Year | Growth Rate | Major Drivers |
| 2021 | 5.2% | The increasing smartphone penetration in Jordan created a higher need for power banks. |
| 2022 | 5.2% | Local retail outlets began offering a wider variety of power bank brands and models. |
| 2023 | 4.6% | Growing reliance on portable devices fueled consumer interest in efficient charging solutions. |
| 2024 | 4.9% | Technological advancements allowed for faster charging capabilities, attracting tech-savvy customers. |
| 2025 | 4.6% | E-commerce platforms expanded, making power banks more accessible to various demographics. |
| 2026 | 5.0% | The surge in outdoor activities led consumers to seek portable charging solutions. |
| 2027 | 5.2% | Affordability of power banks improved, appealing to budget-conscious consumers in Jordan. |
| 2028 | 4.7% | Partnerships between local vendors and international brands boosted market visibility and sales. |
| 2029 | 4.7% | Corporate sector reliance on mobile devices increased demand for high-capacity power banks. |
| 2030 | 4.8% | Educational institutions adopted power banks for tech-enhanced learning environments and events. |
| 2031 | 4.8% | Infrastructure developments in urban areas enhanced the need for convenient portable charging. |
| 2032 | 4.7% | Sustainability trends prompted interest in eco-friendly power bank options among consumers. |
Note - Market size estimations and growth projections presented in this report are based on 6Wresearch's advanced forecasting approach, validated with industry datasets as of June 2026.
Jordan Power Bank Market Synopsis
The Jordan Power Bank Market is projected to reach 5.0% and witness significant growth during the forecast period (2026-2032). This expansion is driven by a variety of factors including the surging adoption of mobile electronic devices, which necessitate convenient and portable charging solutions. As technology advances, consumers increasingly seek reliable power banks that enhance their on-the-go lifestyle, thus propelling market dynamics in Jordan.
Jordan Power Bank Market Growth Drivers
The key drivers fostering growth in the Jordan Power Bank Market include:
- Rising smartphone penetration: With an increasing number of individuals acquiring smartphones, the demand for portable charging solutions has surged to ensure constant connectivity.
- Technological advancements: Continuous improvements in battery technology, such as energy density and charging speed, are enabling manufacturers to produce more efficient power banks, thus drawing consumer interest.
- Consumer lifestyle changes: The shift towards a mobile-first culture has led consumers to prioritize the convenience of portable charging options, thereby stimulating market demand.
- Affordability: The widespread availability and decreasing prices of power banks have made these devices accessible to a broader demographic, fueling market growth.
- Increased reliance on portable devices: The rise in usage of tablets and other electronics for both personal and professional purposes has amplified the need for reliable backup power sources.
Jordan Power Bank Market Challenges and Restraints
Despite its growth, the Jordan Power Bank Market faces several significant challenges:
- Intense competition: The market is marked by fierce rivalry among local and international brands, leading to price wars which can erode profit margins.
- Quality assurance concerns: Ensuring the safety and reliability of power banks is critical for consumer trust, particularly given the potential risks associated with battery failures.
- Rapid technological evolution: The pace of technological change necessitates constant innovation to meet consumer expectations for higher capacity and faster charging solutions.
- Market saturation: As the market matures, distinguishing products becomes increasingly challenging, compelling manufacturers to innovate continuously.
- Regulatory compliance: Adhering to government regulations regarding product safety and performance standards can impose additional operational challenges for manufacturers.
Jordan Power Bank Market Government Investment and Initiatives
The Jordanian government has implemented various policies to support the growth of the power bank market. These include:
- Safety regulations: The government has established guidelines to ensure the safety and performance of power banks, thereby protecting consumers from potential hazards associated with faulty products.
- Consumer protection initiatives: Policies aimed at safeguarding consumer rights help increase public confidence in purchasing power banks, ultimately stimulating market growth.
- Investment in technology: Initiatives to promote technological advancements in battery technology are crucial for enhancing the quality and efficiency of power banks.
- Support for local manufacturers: By providing incentives for local production, the government aims to strengthen the domestic market and reduce reliance on imports.
- Public awareness campaigns: The government promotes awareness of safe charging practices and the benefits of using quality power banks, further contributing to market expansion.
Jordan Power Bank Market Latest Developments (May 2025 - June 2026)
During the period from May 2025 to June 2026, the Jordan Power Bank Market has witnessed notable developments that reflect evolving consumer preferences and technological advancements. Manufacturers have increasingly focused on enhancing battery life and charge efficiency in response to consumer demand for longer-lasting and faster charging solutions. Moreover, sustainability has gained prominence, with an increased emphasis on environmentally friendly materials and energy-efficient designs in new product lines. The competitive landscape has also tightened, with brands innovating to differentiate their offerings through unique features and enhanced safety standards. Furthermore, e-commerce has become a crucial channel for sales, allowing consumers to access a wider range of products conveniently. Overall, these developments signify a dynamic market responding to both consumer needs and technological change.
Jordan Power Bank Market - Key Attractiveness of the Report
- 10 Years of Market Numbers
- Historical Data Starting from 2022 to 2025
- Base Year: 2025
- Forecast Data until 2032
- Key Performance Indicators Impacting the Market
- Major Upcoming Developments and Projects
Key Highlights of the Report:
- Jordan Power Bank Market Outlook
- Market Size of Jordan Power Bank Market, 2025
- Forecast of Jordan Power Bank Market, 2032
- Historical Data and Forecast of Jordan Power Bank Revenues & Volume for the Period 2022-2032F
- Jordan Power Bank Market Trend Evolution
- Jordan Power Bank Market Drivers and Challenges
- Jordan Power Bank Price Trends
- Jordan Power Bank Porter's Five Forces
- Jordan Power Bank Industry Life Cycle
- Historical Data and Forecast of Jordan Power Bank Market Revenues & Volume By Capacity Range for the Period 2022-2032F
- Historical Data and Forecast of Jordan Power Bank Market Revenues & Volume By Up to 3,000 mAh for the Period 2022-2032F
- Historical Data and Forecast of Jordan Power Bank Market Revenues & Volume By 3,001 mAh-8,000 mAh for the Period 2022-2032F
- Historical Data and Forecast of Jordan Power Bank Market Revenues & Volume By 8,001 mAh-20,000 mAh for the Period 2022-2032F
- Historical Data and Forecast of Jordan Power Bank Market Revenues & Volume By Above 20,000 mAh for the Period 2022-2032F
- Historical Data and Forecast of Jordan Power Bank Market Revenues & Volume By Energy Source for the Period 2022-2032F
- Historical Data and Forecast of Jordan Power Bank Market Revenues & Volume By Electric for the Period 2022-2032F
- Historical Data and Forecast of Jordan Power Bank Market Revenues & Volume By Solar for the Period 2022-2032F
- Historical Data and Forecast of Jordan Power Bank Market Revenues & Volume By Battery Type for the Period 2022-2032F
- Historical Data and Forecast of Jordan Power Bank Market Revenues & Volume By Lithium-ion for the Period 2022-2032F
- Historical Data and Forecast of Jordan Power Bank Market Revenues & Volume By Lithium Polymer for the Period 2022-2032F
- Historical Data and Forecast of Jordan Power Bank Market Revenues & Volume By Distribution Channel for the Period 2022-2032F
- Historical Data and Forecast of Jordan Power Bank Market Revenues & Volume By E-commerce for the Period 2022-2032F
- Historical Data and Forecast of Jordan Power Bank Market Revenues & Volume By Brick and Mortar for the Period 2022-2032F
- Jordan Power Bank Import Export Trade Statistics
- Market Opportunity Assessment By Capacity Range
- Market Opportunity Assessment By Energy Source
- Market Opportunity Assessment By Battery Type
- Market Opportunity Assessment By Distribution Channel
- Jordan Power Bank Top Companies Market Share
- Jordan Power Bank Competitive Benchmarking By Technical and Operational Parameters
- Jordan Power Bank Company Profiles
- Jordan Power Bank Key Strategic Recommendations
Frequently Asked Questions About the Market Study (FAQs):
The growth is primarily driven by the increasing use of mobile devices, technological advancements in battery capacity and charging speed, and the demand for portable charging solutions as lifestyles become increasingly mobile.
The market faces challenges such as intense competition leading to pricing pressures, quality assurance issues regarding safety, and the need for continuous innovation to keep pace with rapid technological changes.
The government supports the market through product safety regulations, consumer protection policies, and initiatives aimed at promoting technological advancements and local manufacturing.
Recent trends include a focus on sustainability, improvements in battery efficiency, innovative features to enhance user experience, and the growing importance of e-commerce as a sales channel.
6Wresearch actively monitors the Jordan Power Bank Market and publishes its comprehensive annual report, highlighting emerging trends, growth drivers, revenue analysis, and forecast outlook. Our insights help businesses to make data-backed strategic decisions with ongoing market dynamics. Our analysts track relevent industries related to the Jordan Power Bank Market, allowing our clients with actionable intelligence and reliable forecasts tailored to emerging regional needs.
Yes, we provide customisation as per your requirements. To learn more, feel free to contact us on sales@6wresearch.com
1 Executive Summary |
2 Introduction |
2.1 Key Highlights of the Report |
2.2 Report Description |
2.3 Market Scope & Segmentation |
2.4 Research Methodology |
2.5 Assumptions |
3 Jordan Power Bank Market Overview |
3.1 Jordan Country Macro Economic Indicators |
3.2 Jordan Power Bank Market Revenues & Volume, 2022 & 2032F |
3.3 Jordan Power Bank Market - Industry Life Cycle |
3.4 Jordan Power Bank Market - Porter's Five Forces |
3.5 Jordan Power Bank Market Revenues & Volume Share, By Capacity Range , 2022 & 2032F |
3.6 Jordan Power Bank Market Revenues & Volume Share, By Energy Source, 2022 & 2032F |
3.7 Jordan Power Bank Market Revenues & Volume Share, By Battery Type, 2022 & 2032F |
3.8 Jordan Power Bank Market Revenues & Volume Share, By Distribution Channel, 2022 & 2032F |
4 Jordan Power Bank Market Dynamics |
4.1 Impact Analysis |
4.2 Market Drivers |
4.3 Market Restraints |
5 Jordan Power Bank Market Trends |
6 Jordan Power Bank Market, By Types |
6.1 Jordan Power Bank Market, By Capacity Range |
6.1.1 Overview and Analysis |
6.1.2 Jordan Power Bank Market Revenues & Volume, By Capacity Range , 2022-2032F |
6.1.3 Jordan Power Bank Market Revenues & Volume, By Up to 3,000 mAh, 2022-2032F |
6.1.4 Jordan Power Bank Market Revenues & Volume, By 3,001 mAh-8,000 mAh, 2022-2032F |
6.1.5 Jordan Power Bank Market Revenues & Volume, By 8,001 mAh-20,000 mAh, 2022-2032F |
6.1.6 Jordan Power Bank Market Revenues & Volume, By Above 20,000 mAh, 2022-2032F |
6.2 Jordan Power Bank Market, By Energy Source |
6.2.1 Overview and Analysis |
6.2.2 Jordan Power Bank Market Revenues & Volume, By Electric, 2022-2032F |
6.2.3 Jordan Power Bank Market Revenues & Volume, By Solar, 2022-2032F |
6.3 Jordan Power Bank Market, By Battery Type |
6.3.1 Overview and Analysis |
6.3.2 Jordan Power Bank Market Revenues & Volume, By Lithium-ion, 2022-2032F |
6.3.3 Jordan Power Bank Market Revenues & Volume, By Lithium Polymer, 2022-2032F |
6.4 Jordan Power Bank Market, By Distribution Channel |
6.4.1 Overview and Analysis |
6.4.2 Jordan Power Bank Market Revenues & Volume, By E-commerce, 2022-2032F |
6.4.3 Jordan Power Bank Market Revenues & Volume, By Brick and Mortar, 2022-2032F |
7 Jordan Power Bank Market Import-Export Trade Statistics |
7.1 Jordan Power Bank Market Export to Major Countries |
7.2 Jordan Power Bank Market Imports from Major Countries |
8 Jordan Power Bank Market Key Performance Indicators |
9 Jordan Power Bank Market - Opportunity Assessment |
9.1 Jordan Power Bank Market Opportunity Assessment, By Capacity Range , 2022 & 2032F |
9.2 Jordan Power Bank Market Opportunity Assessment, By Energy Source, 2022 & 2032F |
9.3 Jordan Power Bank Market Opportunity Assessment, By Battery Type, 2022 & 2032F |
9.4 Jordan Power Bank Market Opportunity Assessment, By Distribution Channel, 2022 & 2032F |
10 Jordan Power Bank Market - Competitive Landscape |
10.1 Jordan Power Bank Market Revenue Share, By Companies, 2025 |
10.2 Jordan Power Bank Market Competitive Benchmarking, By Operating and Technical Parameters |
11 Company Profiles |
12 Recommendations |
13 Disclaimer |
Global Go To Market Strategy - 2030
Export potential enables firms to identify high-growth global markets with greater confidence by combining advanced trade intelligence with a structured quantitative methodology. The framework analyzes emerging demand trends and country-level import patterns while integrating macroeconomic and trade datasets such as GDP and population forecasts, bilateral import–export flows, tariff structures, elasticity differentials between developed and developing economies, geographic distance, and import demand projections. Using weighted trade values from 2020–2024 as the base period to project country-to-country export potential for 2030, these inputs are operationalized through calculated drivers such as gravity model parameters, tariff impact factors, and projected GDP per-capita growth. Through an analysis of hidden potentials, demand hotspots, and market conditions that are most favorable to success, this method enables firms to focus on target countries, maximize returns, and global expansion with data, backed by accuracy.
By factoring in the projected importer demand gap that is currently unmet and could be potential opportunity, it identifies the potential for the Exporter (Country) among 190 countries, against the general trade analysis, which identifies the biggest importer or exporter.
To discover high-growth global markets and optimize your business strategy:
Click Here
Pricing
- Single User License$ 1,995
- Department License$ 2,400
- Site License$ 3,120
- Global License$ 3,795

Leadership Perspectives from Industry Events
Search
Thought Leadership and Analyst Meet


Our Clients
6WResearch In News
- India Air Conditioner Market Set for Strong Rebound in 2026 After Weather-Led Correction and GST-Driven Recovery: 6Wresearch
- ADAS in India: How Automatic Emergency Braking, Blind Spot Detection & Driver Monitoring are Transforming Road Safety
- Doha a strategic location for EV manufacturing hub: IPA Qatar
- Demand for luxury TVs surging in the GCC, says Samsung
- Empowering Growth: The Thriving Journey of Bangladesh’s Cable Industry
- Demand for luxury TVs surging in the GCC, says Samsung
Latest Reports
- Nicaragua RPG Gaming Market (2026-2032)
- New Zealand RPG Gaming Market (2026-2032)
- Netherlands RPG Gaming Market (2026-2032)
- Nauru RPG Gaming Market (2026-2032)
- Namibia RPG Gaming Market (2026-2032)
- Mozambique RPG Gaming Market (2026-2032)
- Montenegro RPG Gaming Market (2026-2032)
- Mongolia RPG Gaming Market (2026-2032)
- Monaco RPG Gaming Market (2026-2032)
- Micronesia RPG Gaming Market (2026-2032)
Industry Events and Analyst Meet

HIMTEX 2026

India Refining Summit 2026

India EV Show 2026

EV tech India Expo 2026

Auto Tech Asia 2026
Whitepaper
- Middle East & Africa Commercial Security Market Click here to view more.
- Middle East & Africa Fire Safety Systems & Equipment Market Click here to view more.
- GCC Drone Market Click here to view more.
- Middle East Lighting Fixture Market Click here to view more.
- GCC Physical & Perimeter Security Market Click here to view more.