Sri Lanka Power Bank Market (2020-2026) | Growth, COVID-19 IMPACT, Outlook, Revenue, Industry, Size, Share, Trends, Companies, Analysis, Forecast & Value
Market Forecast By Capacity Range (Up to 3,000 mAh, 3,001 mAh-8,000 mAh, 8,001 mAh-20,000 mAh, Above 20,000 mAh), By Energy Source (Electric, Solar), By Battery Type (Lithium-ion, Lithium Polymer), By Distribution Channel (E-commerce, Brick and Mortar) And Competitive Landscape
| Product Code: ETC012171 | Publication Date: Jun 2023 | Updated Date: Feb 2026 | Product Type: Report | |
| Publisher: 6Wresearch | Author: Ravi Bhandari | No. of Pages: 70 | No. of Figures: 35 | No. of Tables: 5 |
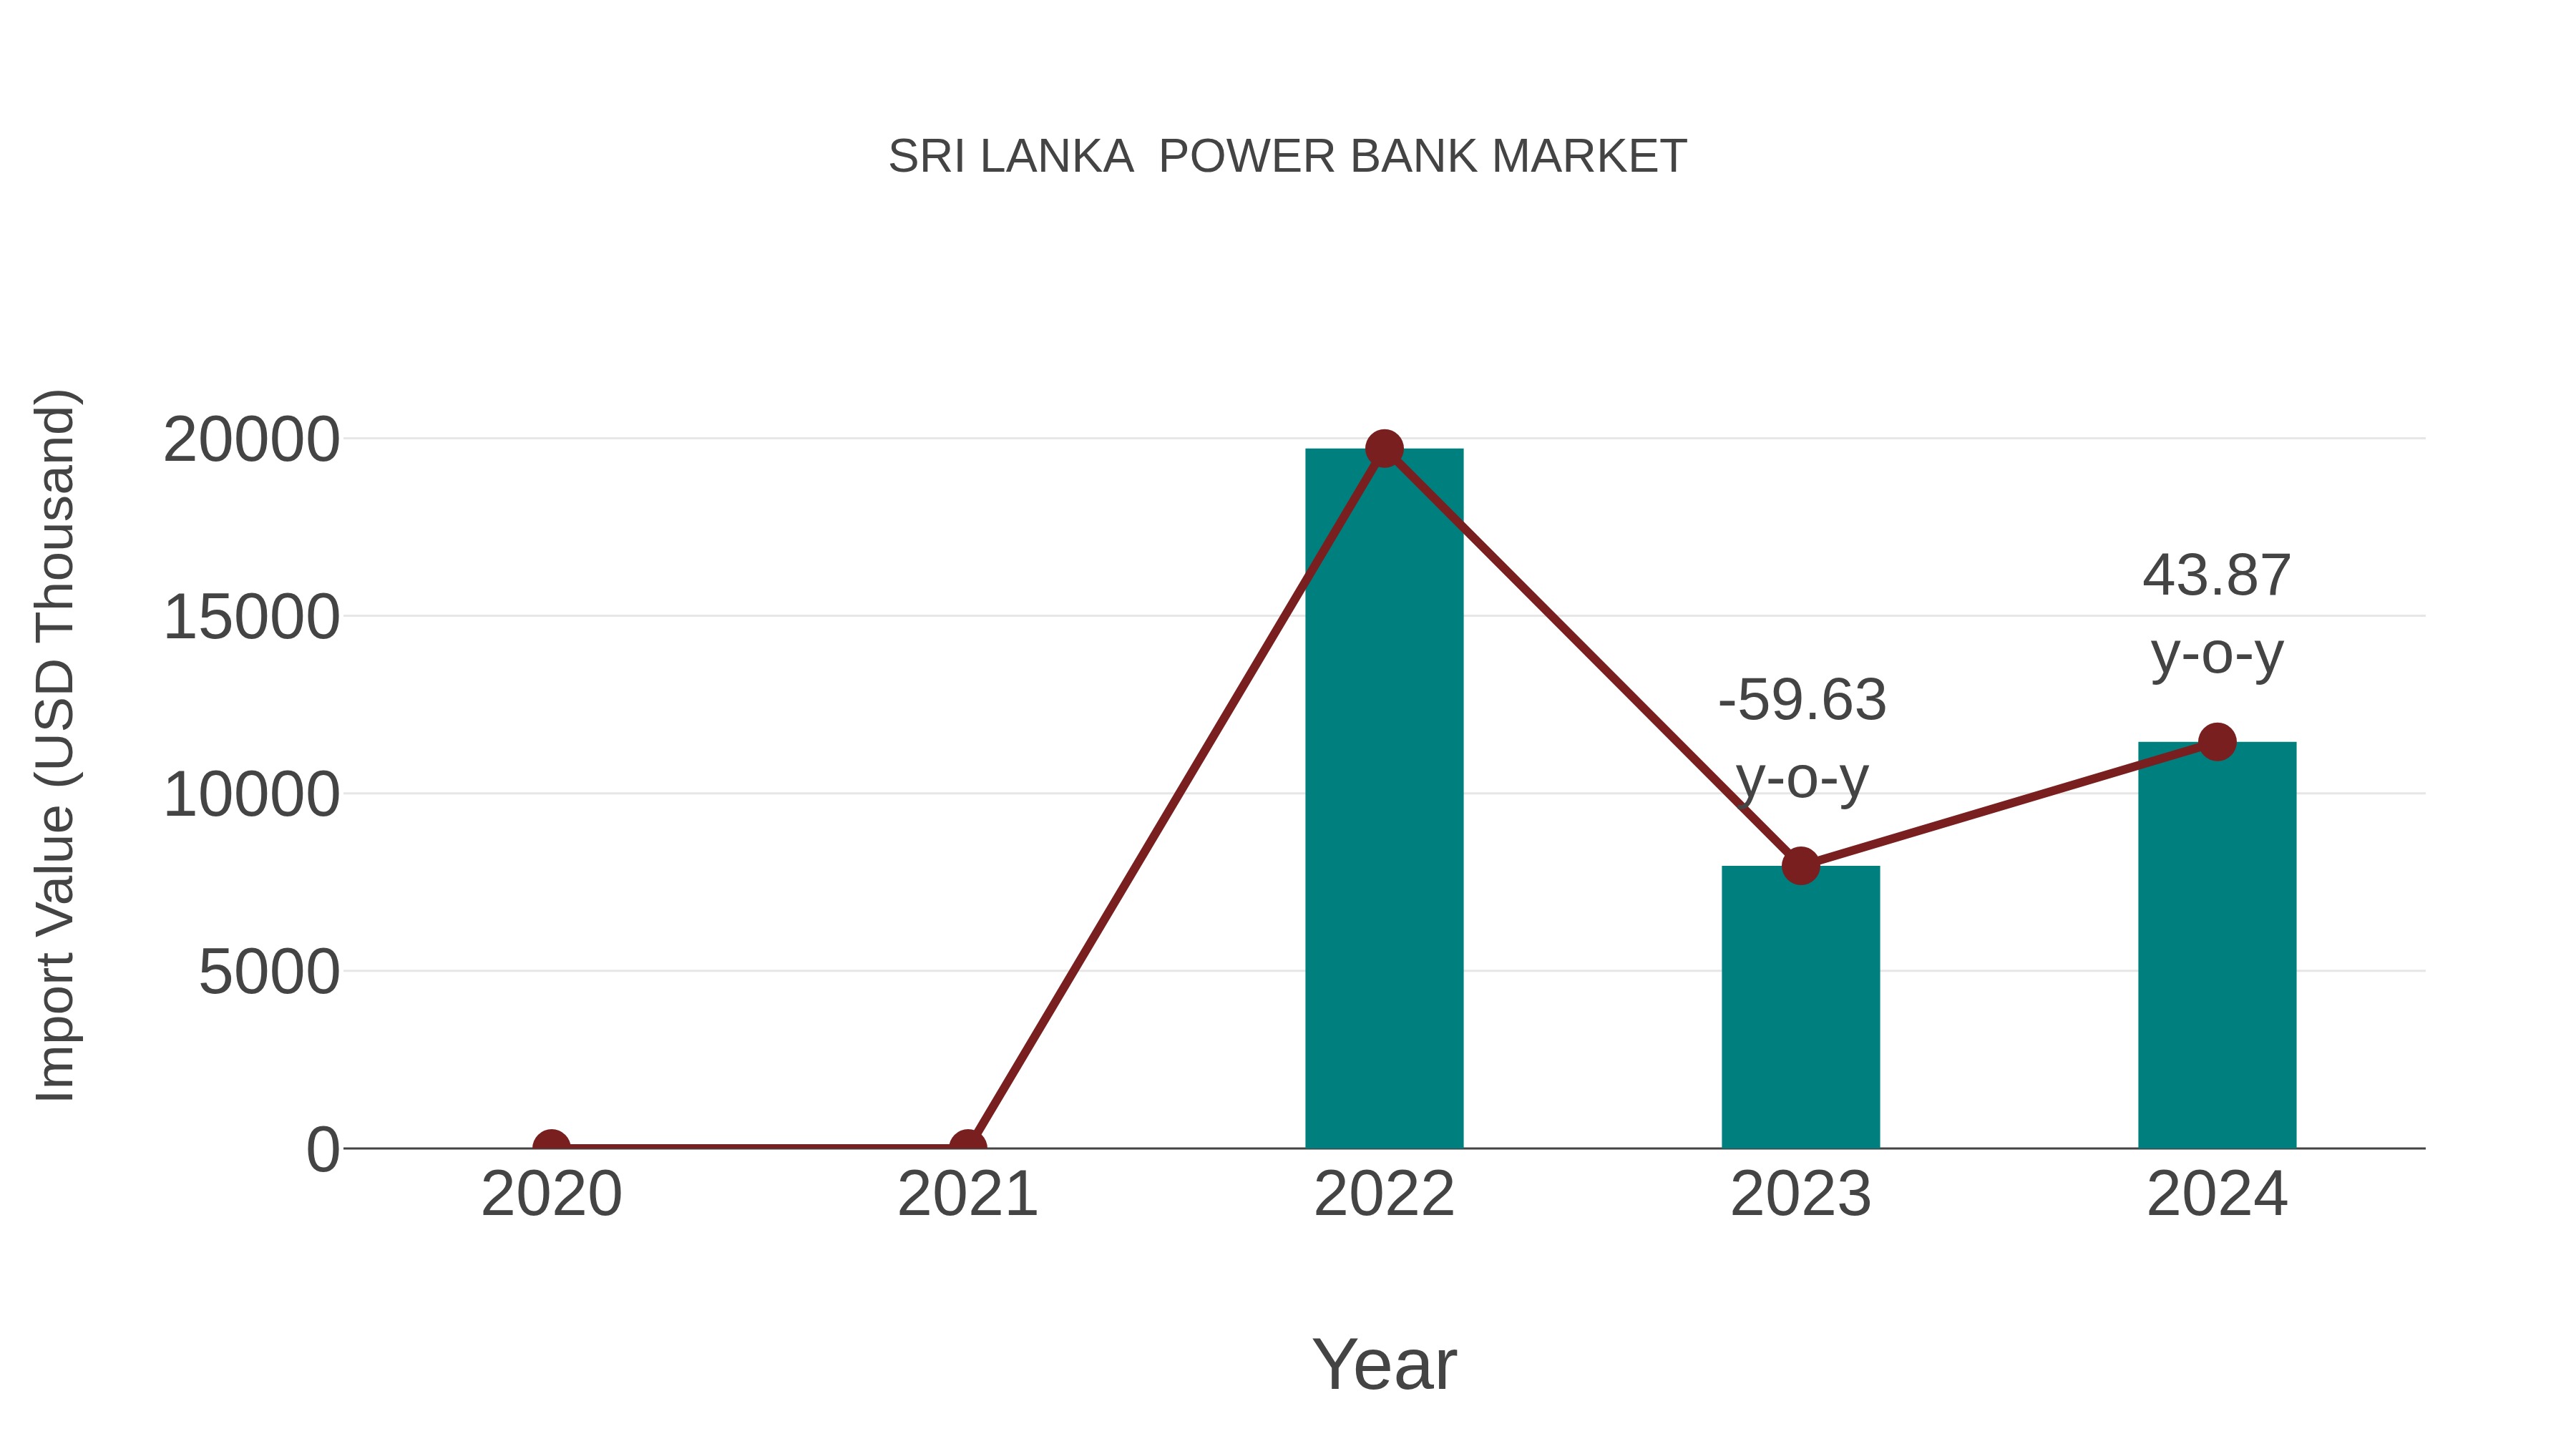
Sri Lanka Power Bank Market: Import Trend Analysis
In 2023-2024, Sri Lanka import trend for the power bank market saw a growth rate of 43.87%. However, the compound annual growth rate (CAGR) from 2020-2024 stood at -23.78%. This fluctuation may be attributed to shifts in consumer demand or changes in trade policies impacting the market dynamics.
sri lanka power bank market synopsis
The Sri Lanka power bank market is projected to grow at a CAGR of 8.2% during the forecast period 2020-2026. The increasing demand for mobile phones and laptop batteries has been driving the growth of the global power bank market, which eventually drives the Sri Lanka power bank market as well. Moreover, growing awareness among consumers about environmental safety and energy conservation are further boosting the sales of portable battery chargers in recent years which is expected to fuel up its growth over forecast period. Therefore, increased disposable income and technological advancements in electronics industry are creating potential opportunities for Sri Lanka players in this sector as well.
Moreover, government initiatives such as tax exemption given on electronic products including power banks have also encouraged local manufacturers to produce quality products with attractive price points that would curb down their cost structure thereby making it affordable for majority of population in Sri Lanka who come from lower economic strata. Furthermore, rising popularity of ecommerce platforms such as Amazon and Flipkart have made it easier for consumers to purchase consumer electronic items especially when they want these devices urgently or without going out physically due to lockdown restrictions caused by COVID 19 pandemic worldwide since mid-2020 thus propelling demand within local country even during pandemic times when other sectors were struggling due to reduced consumer spending levels globally .
However high import duties imposed by Government on imported product might hamper its growth over upcoming years since they increase prices hardly making them unaffordable for many people who cannot afford luxury item like this however there hasn?t been any significant change observed yet so far specially after introduction GST tax exemptions recently implemented by Indian government thus we remain positive about near future prospects of Power Bank Market within our country .
Key Highlights of the Report:
- Sri Lanka Power Bank Market Outlook
- Market Size of Sri Lanka Power Bank Market, 2019
- Forecast of Sri Lanka Power Bank Market, 2026
- Historical Data and Forecast of Sri Lanka Power Bank Revenues & Volume for the Period 2016 - 2026
- Sri Lanka Power Bank Market Trend Evolution
- Sri Lanka Power Bank Market Drivers and Challenges
- Sri Lanka Power Bank Price Trends
- Sri Lanka Power Bank Porter's Five Forces
- Sri Lanka Power Bank Industry Life Cycle
- Historical Data and Forecast of Sri Lanka Power Bank Market Revenues & Volume By Capacity Range for the Period 2016 - 2026
- Historical Data and Forecast of Sri Lanka Power Bank Market Revenues & Volume By Up to 3,000 mAh for the Period 2016 - 2026
- Historical Data and Forecast of Sri Lanka Power Bank Market Revenues & Volume By 3,001 mAh-8,000 mAh for the Period 2016 - 2026
- Historical Data and Forecast of Sri Lanka Power Bank Market Revenues & Volume By 8,001 mAh-20,000 mAh for the Period 2016 - 2026
- Historical Data and Forecast of Sri Lanka Power Bank Market Revenues & Volume By Above 20,000 mAh for the Period 2016 - 2026
- Historical Data and Forecast of Sri Lanka Power Bank Market Revenues & Volume By Energy Source for the Period 2016 - 2026
- Historical Data and Forecast of Sri Lanka Power Bank Market Revenues & Volume By Electric for the Period 2016 - 2026
- Historical Data and Forecast of Sri Lanka Power Bank Market Revenues & Volume By Solar for the Period 2016 - 2026
- Historical Data and Forecast of Sri Lanka Power Bank Market Revenues & Volume By Battery Type for the Period 2016 - 2026
- Historical Data and Forecast of Sri Lanka Power Bank Market Revenues & Volume By Lithium-ion for the Period 2016 - 2026
- Historical Data and Forecast of Sri Lanka Power Bank Market Revenues & Volume By Lithium Polymer for the Period 2016 - 2026
- Historical Data and Forecast of Sri Lanka Power Bank Market Revenues & Volume By Distribution Channel for the Period 2016 - 2026
- Historical Data and Forecast of Sri Lanka Power Bank Market Revenues & Volume By E-commerce for the Period 2016 - 2026
- Historical Data and Forecast of Sri Lanka Power Bank Market Revenues & Volume By Brick and Mortar for the Period 2016 - 2026
- Sri Lanka Power Bank Import Export Trade Statistics
- Market Opportunity Assessment By Capacity Range
- Market Opportunity Assessment By Energy Source
- Market Opportunity Assessment By Battery Type
- Market Opportunity Assessment By Distribution Channel
- Sri Lanka Power Bank Top Companies Market Share
- Sri Lanka Power Bank Competitive Benchmarking By Technical and Operational Parameters
- Sri Lanka Power Bank Company Profiles
- Sri Lanka Power Bank Key Strategic Recommendations
Frequently Asked Questions About the Market Study (FAQs):
6Wresearch actively monitors the Sri Lanka Power Bank Market and publishes its comprehensive annual report, highlighting emerging trends, growth drivers, revenue analysis, and forecast outlook. Our insights help businesses to make data-backed strategic decisions with ongoing market dynamics. Our analysts track relevent industries related to the Sri Lanka Power Bank Market, allowing our clients with actionable intelligence and reliable forecasts tailored to emerging regional needs.
Yes, we provide customisation as per your requirements. To learn more, feel free to contact us on sales@6wresearch.com
1 Executive Summary |
2 Introduction |
2.1 Key Highlights of the Report |
2.2 Report Description |
2.3 Market Scope & Segmentation |
2.4 Research Methodology |
2.5 Assumptions |
3 Sri Lanka Power Bank Market Overview |
3.1 Sri Lanka Country Macro Economic Indicators |
3.2 Sri Lanka Power Bank Market Revenues & Volume, 2019 & 2026F |
3.3 Sri Lanka Power Bank Market - Industry Life Cycle |
3.4 Sri Lanka Power Bank Market - Porter's Five Forces |
3.5 Sri Lanka Power Bank Market Revenues & Volume Share, By Capacity Range , 2019 & 2026F |
3.6 Sri Lanka Power Bank Market Revenues & Volume Share, By Energy Source, 2019 & 2026F |
3.7 Sri Lanka Power Bank Market Revenues & Volume Share, By Battery Type, 2019 & 2026F |
3.8 Sri Lanka Power Bank Market Revenues & Volume Share, By Distribution Channel, 2019 & 2026F |
4 Sri Lanka Power Bank Market Dynamics |
4.1 Impact Analysis |
4.2 Market Drivers |
4.3 Market Restraints |
5 Sri Lanka Power Bank Market Trends |
6 Sri Lanka Power Bank Market, By Types |
6.1 Sri Lanka Power Bank Market, By Capacity Range |
6.1.1 Overview and Analysis |
6.1.2 Sri Lanka Power Bank Market Revenues & Volume, By Capacity Range , 2016 - 2026F |
6.1.3 Sri Lanka Power Bank Market Revenues & Volume, By Up to 3,000 mAh, 2016 - 2026F |
6.1.4 Sri Lanka Power Bank Market Revenues & Volume, By 3,001 mAh-8,000 mAh, 2016 - 2026F |
6.1.5 Sri Lanka Power Bank Market Revenues & Volume, By 8,001 mAh-20,000 mAh, 2016 - 2026F |
6.1.6 Sri Lanka Power Bank Market Revenues & Volume, By Above 20,000 mAh, 2016 - 2026F |
6.2 Sri Lanka Power Bank Market, By Energy Source |
6.2.1 Overview and Analysis |
6.2.2 Sri Lanka Power Bank Market Revenues & Volume, By Electric, 2016 - 2026F |
6.2.3 Sri Lanka Power Bank Market Revenues & Volume, By Solar, 2016 - 2026F |
6.3 Sri Lanka Power Bank Market, By Battery Type |
6.3.1 Overview and Analysis |
6.3.2 Sri Lanka Power Bank Market Revenues & Volume, By Lithium-ion, 2016 - 2026F |
6.3.3 Sri Lanka Power Bank Market Revenues & Volume, By Lithium Polymer, 2016 - 2026F |
6.4 Sri Lanka Power Bank Market, By Distribution Channel |
6.4.1 Overview and Analysis |
6.4.2 Sri Lanka Power Bank Market Revenues & Volume, By E-commerce, 2016 - 2026F |
6.4.3 Sri Lanka Power Bank Market Revenues & Volume, By Brick and Mortar, 2016 - 2026F |
7 Sri Lanka Power Bank Market Import-Export Trade Statistics |
7.1 Sri Lanka Power Bank Market Export to Major Countries |
7.2 Sri Lanka Power Bank Market Imports from Major Countries |
8 Sri Lanka Power Bank Market Key Performance Indicators |
9 Sri Lanka Power Bank Market - Opportunity Assessment |
9.1 Sri Lanka Power Bank Market Opportunity Assessment, By Capacity Range , 2019 & 2026F |
9.2 Sri Lanka Power Bank Market Opportunity Assessment, By Energy Source, 2019 & 2026F |
9.3 Sri Lanka Power Bank Market Opportunity Assessment, By Battery Type, 2019 & 2026F |
9.4 Sri Lanka Power Bank Market Opportunity Assessment, By Distribution Channel, 2019 & 2026F |
10 Sri Lanka Power Bank Market - Competitive Landscape |
10.1 Sri Lanka Power Bank Market Revenue Share, By Companies, 2019 |
10.2 Sri Lanka Power Bank Market Competitive Benchmarking, By Operating and Technical Parameters |
11 Company Profiles |
12 Recommendations |
13 Disclaimer |
Global Go To Market Strategy - 2030
Export potential enables firms to identify high-growth global markets with greater confidence by combining advanced trade intelligence with a structured quantitative methodology. The framework analyzes emerging demand trends and country-level import patterns while integrating macroeconomic and trade datasets such as GDP and population forecasts, bilateral import–export flows, tariff structures, elasticity differentials between developed and developing economies, geographic distance, and import demand projections. Using weighted trade values from 2020–2024 as the base period to project country-to-country export potential for 2030, these inputs are operationalized through calculated drivers such as gravity model parameters, tariff impact factors, and projected GDP per-capita growth. Through an analysis of hidden potentials, demand hotspots, and market conditions that are most favorable to success, this method enables firms to focus on target countries, maximize returns, and global expansion with data, backed by accuracy.
By factoring in the projected importer demand gap that is currently unmet and could be potential opportunity, it identifies the potential for the Exporter (Country) among 190 countries, against the general trade analysis, which identifies the biggest importer or exporter.
To discover high-growth global markets and optimize your business strategy:
Click Here
Pricing
- Single User License$ 1,995
- Department License$ 2,400
- Site License$ 3,120
- Global License$ 3,795

Leadership Perspectives from Industry Events
Search
Thought Leadership and Analyst Meet


Our Clients
6WResearch In News
- India Air Conditioner Market Set for Strong Rebound in 2026 After Weather-Led Correction and GST-Driven Recovery: 6Wresearch
- ADAS in India: How Automatic Emergency Braking, Blind Spot Detection & Driver Monitoring are Transforming Road Safety
- Doha a strategic location for EV manufacturing hub: IPA Qatar
- Demand for luxury TVs surging in the GCC, says Samsung
- Empowering Growth: The Thriving Journey of Bangladesh’s Cable Industry
- Demand for luxury TVs surging in the GCC, says Samsung
Latest Reports
- Nicaragua RPG Gaming Market (2026-2032)
- New Zealand RPG Gaming Market (2026-2032)
- Netherlands RPG Gaming Market (2026-2032)
- Nauru RPG Gaming Market (2026-2032)
- Namibia RPG Gaming Market (2026-2032)
- Mozambique RPG Gaming Market (2026-2032)
- Montenegro RPG Gaming Market (2026-2032)
- Mongolia RPG Gaming Market (2026-2032)
- Monaco RPG Gaming Market (2026-2032)
- Micronesia RPG Gaming Market (2026-2032)
Industry Events and Analyst Meet

EV India Expo 2026

HIMTEX 2026

India Refining Summit 2026

India EV Show 2026

EV tech India Expo 2026
Whitepaper
- Middle East & Africa Commercial Security Market Click here to view more.
- Middle East & Africa Fire Safety Systems & Equipment Market Click here to view more.
- GCC Drone Market Click here to view more.
- Middle East Lighting Fixture Market Click here to view more.
- GCC Physical & Perimeter Security Market Click here to view more.