Jordan Pressure Monitoring Market (2026-2032) | Share, Growth, Industry, Trends, Forecast, Analysis, Outlook, Revenue, Value, Size, Companies
Market Forecast By Product Type (BP Monitors/Cardiac Pressure Monitors, Pulmonary Pressure Monitors, Intraocular Pressure Monitors), By Procedure (Noninvasive, Invasive), By Application (Respiratory Disorders, Glaucoma, Cardiac Disorders, Neurological Disorders, Dialysis, Others), By End-Use (Hospitals, Home Care Settings, Ambulatory Surgical Centers and Clinics, Diagnostic Laboratories, Others) And Competitive Landscape
| Product Code: ETC040827 | Publication Date: Jan 2021 | Updated Date: Jun 2026 | Product Type: Report | |
| Publisher: 6Wresearch | Author: Ravi Bhandari | No. of Pages: 70 | No. of Figures: 35 | No. of Tables: 5 |
Jordan Pressure Monitoring Market Summary
The jordan pressure monitoring market was estimated at USD 233 Million in 2025 and is projected to reach USD 313 Million by 2032, growing at a CAGR of 4.9% from 2026 to 2032.
Jordan Pressure Monitoring Market Year-wise Growth Rate and Key Drivers
This graph highlights how the Jordan Pressure Monitoring Market has steadily grown over the past five years, supported by major growth factors.
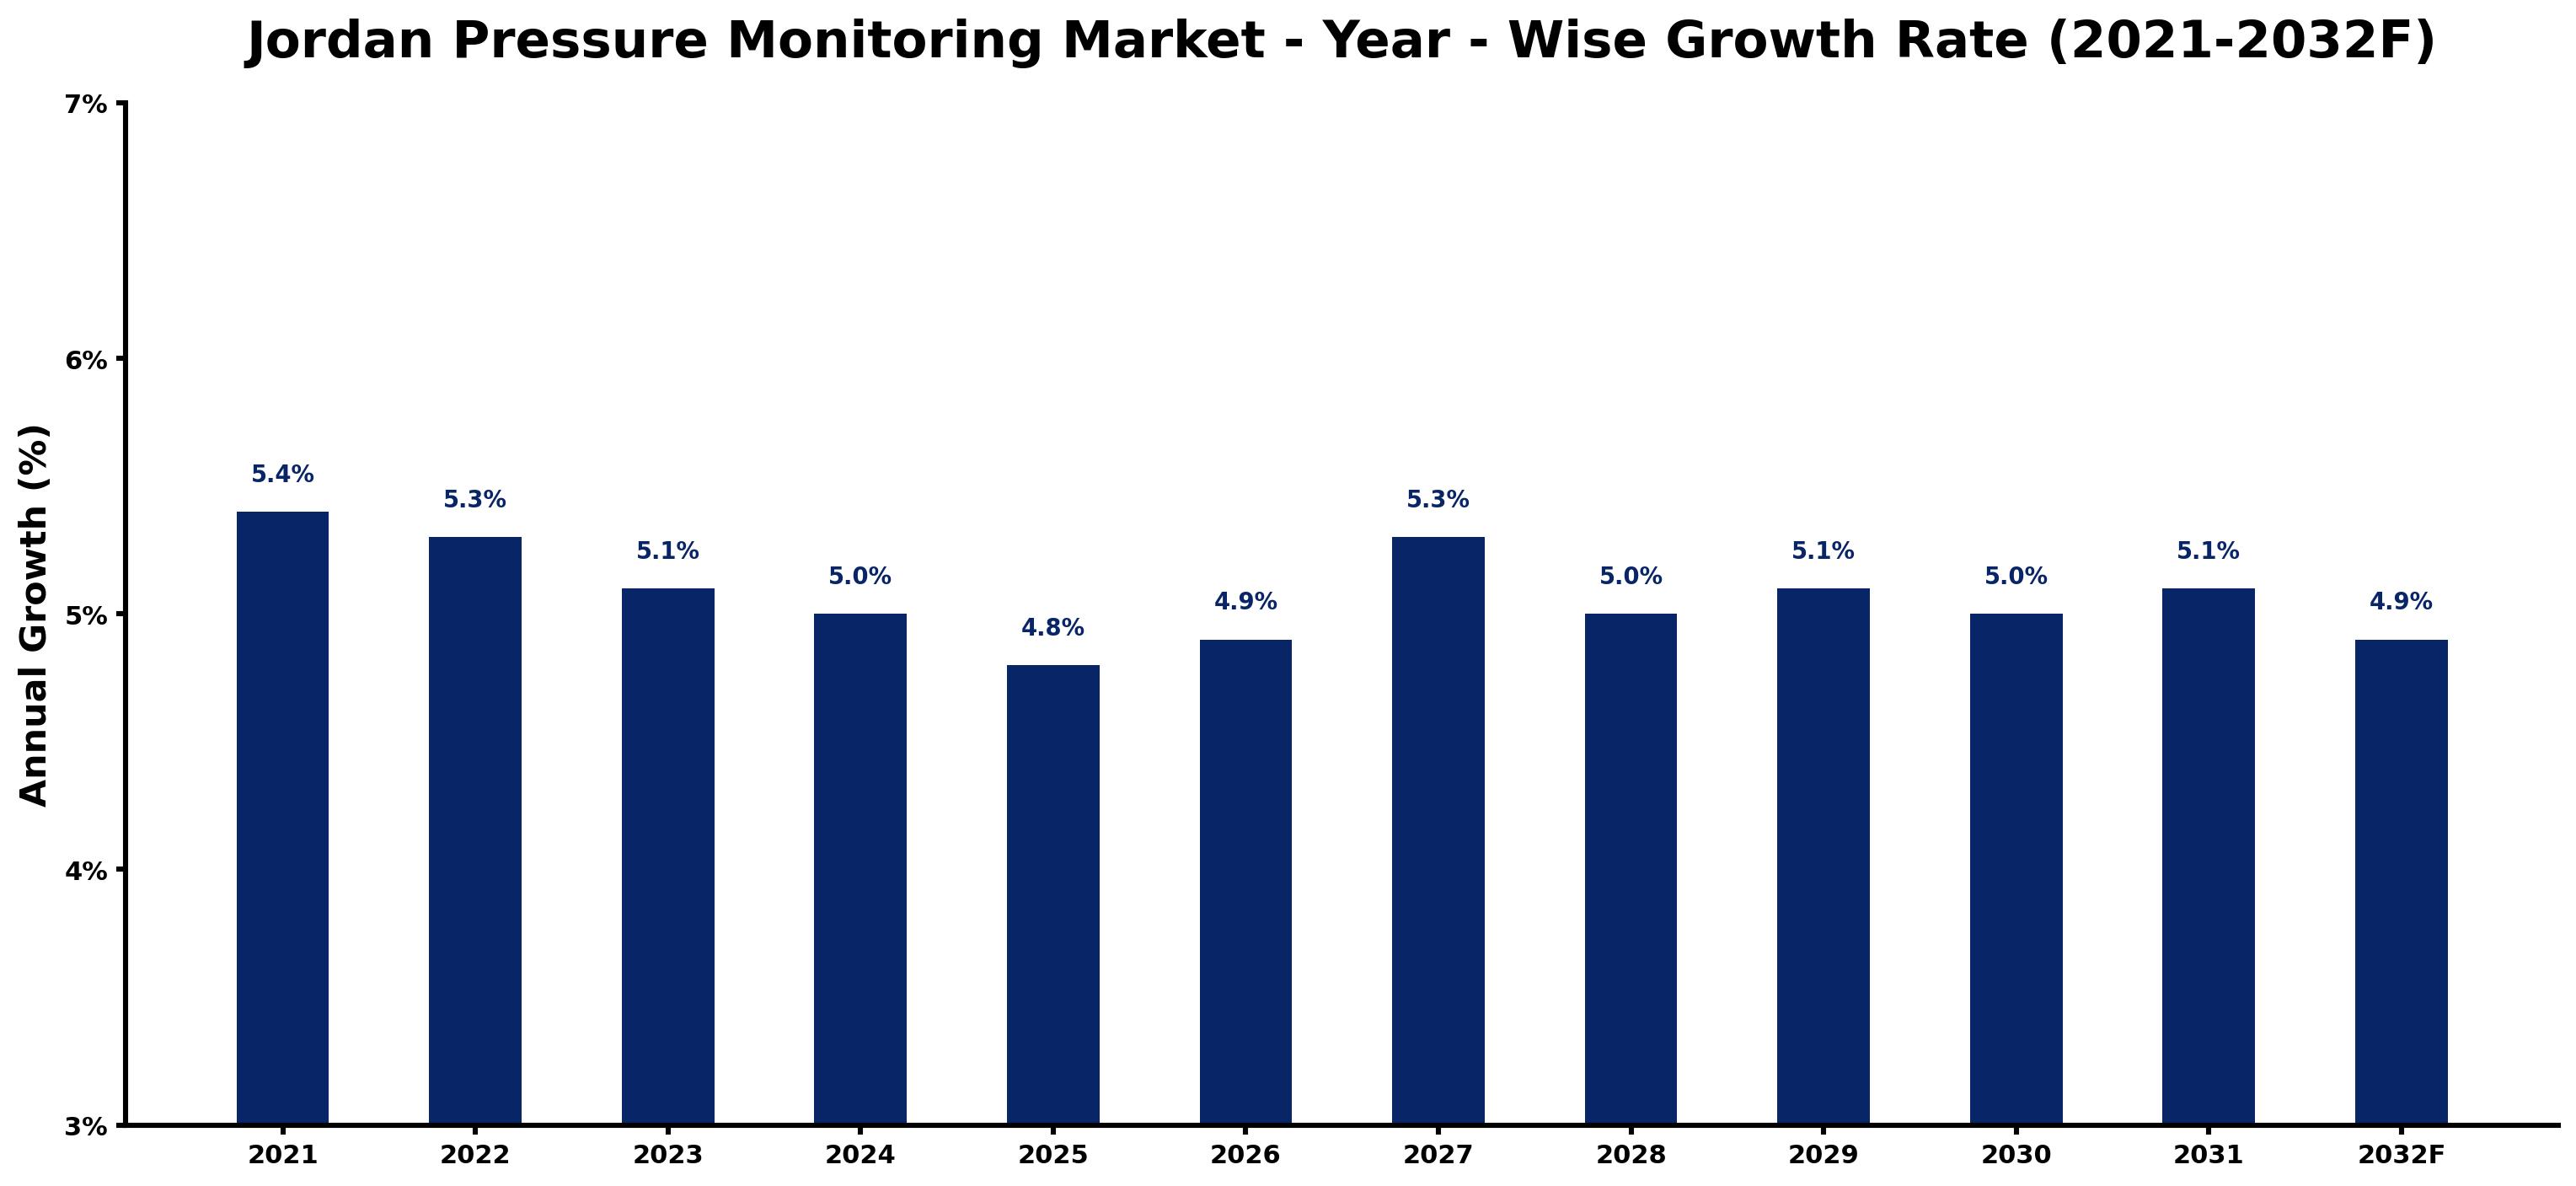
The table below presents the year wise growth rates along with the key drivers influencing the market
| Year | Growth Rate | Major Drivers |
| 2021 | 5.4% | Healthcare investments focus on improving patient outcomes and monitoring technologies. |
| 2022 | 5.3% | Partnerships between local manufacturers enhance the distribution of pressure monitoring devices. |
| 2023 | 5.1% | Public awareness campaigns highlight the importance of early hypertension detection and management. |
| 2024 | 5.0% | Evolving health technologies integrate digital solutions for remote patient monitoring systems. |
| 2025 | 4.8% | Aging population in Jordan increases the prevalence of chronic diseases necessitating monitoring. |
| 2026 | 4.9% | Increased healthcare funding supports advancements in medical device research and development. |
| 2027 | 5.3% | Emerging telehealth services expand access to pressure monitoring for rural populations. |
| 2028 | 5.0% | Local universities collaborate with hospitals to innovate in wearable health technologies. |
| 2029 | 5.1% | Societal shifts towards preventive healthcare stimulate demand for pressure monitoring products. |
| 2030 | 5.0% | Insurance companies recognize benefits of early detection, offering incentives for monitoring. |
| 2031 | 5.1% | Technological innovations streamline data collection, enhancing accuracy in pressure monitoring. |
| 2032 | 4.9% | Integration of artificial intelligence boosts predictive capabilities in health monitoring devices. |
Note - Market size estimations and growth projections presented in this report are based on 6Wresearch's advanced forecasting approach, validated with industry datasets as of June 2026.
Jordan Pressure Monitoring Market Synopsis
The Jordan Pressure Monitoring Market is projected to reach 4.9% and witness significant growth during the forecast period (2026-2032). This growth is driven by the increasing demand for accurate pressure measurement solutions across various sectors, including healthcare, industrial, and environmental applications. The push for real-time monitoring and data collection to enhance operational efficiency further emphasizes the necessity for sophisticated pressure monitoring systems.
Jordan Pressure Monitoring Market Growth Drivers
The dynamics of the Jordan Pressure Monitoring Market are underpinned by several key drivers that are fostering its expansion:
- There is a rising demand for precise measurement systems to improve safety and efficiency in medical applications.
- Increasing industrial activities necessitate robust pressure monitoring solutions to ensure operational integrity and performance.
- The environmental sector demands advanced pressure monitoring technologies to track and manage pressure levels in various applications.
- Technological advancements in sensor technology are leading to improved accuracy, miniaturization, and enhanced connectivity options.
- The trend toward digital transformation across industries emphasizes the need for integrated pressure monitoring systems capable of real-time data analysis.
Jordan Pressure Monitoring Market Challenges and Restraints
Despite the promising growth potential, the Jordan Pressure Monitoring Market confronts several challenges that may hinder its progress:
- A significant reliance on imports due to limited local manufacturing capabilities impedes market growth.
- There exists a notable lack of awareness and technical expertise among end-users, which affects the adoption rate of advanced technologies.
- Regulatory challenges and the need for standardization create operational inefficiencies for companies working in this sector.
- Economic fluctuations can impact investment in pressure monitoring solutions, leading to uncertainties in project implementation.
- Market players often struggle with high competition and pricing pressures, which can limit profitability.
Jordan Pressure Monitoring Market Trends and Opportunities
As the Jordan Pressure Monitoring Market evolves, several trends and opportunities are emerging that may shape its landscape:
- The integration of Internet of Things (IoT) technology is becoming more prevalent, allowing for enhanced monitoring capabilities and data analytics.
- Shifts toward home healthcare and telemedicine are creating new opportunities for portable and user-friendly pressure monitoring solutions.
- Investment in research and development is leading to innovative sensor technologies that improve measurement accuracy and reliability.
- Collaboration between technology providers and healthcare facilities can enhance education and awareness, fostering a more knowledgeable user base.
- Government support for industrial safety and environmental regulations will likely drive further investment in pressure monitoring technologies.
Jordan Pressure Monitoring Market Government Investment and Initiatives
The Jordanian government is actively involved in initiatives aimed at enhancing the pressure monitoring market. These initiatives focus on:
- Promoting investments in advanced pressure monitoring technologies to improve public safety and environmental health.
- Implementing regulatory frameworks that ensure the reliability and accuracy of pressure measurement devices.
- Supporting training programs to develop technical skills in pressure monitoring among professionals to improve adoption rates of innovative solutions.
- Encouraging local manufacturing capabilities to reduce dependency on imports and boost the economy.
- Facilitating public-private partnerships to foster innovation and technology transfer in the pressure monitoring sector.
Jordan Pressure Monitoring Market Latest Developments (May 2025 - June 2026)
Recent developments indicate a robust shift towards enhanced pressure monitoring solutions in Jordan. There has been a growing emphasis on integrating smart technologies into pressure monitoring systems, which allow for real-time data transmission and comprehensive analytics. Furthermore, industry stakeholders are focusing on collaborative efforts to overcome awareness and expertise gaps among end-users. Investments in research and development are anticipated to yield innovations that can address existing challenges and enhance the capabilities of pressure monitoring devices, reflecting the sector's commitment to advancing safety and efficiency in various applications.
Jordan Pressure Monitoring Market - Key Attractiveness of the Report
- 10 Years of Market Numbers
- Historical Data Starting from 2022 to 2025
- Base Year: 2025
- Forecast Data until 2032
- Key Performance Indicators Impacting the Market
- Major Upcoming Developments and Projects
Key Highlights of the Report:
- Jordan Pressure Monitoring Market Outlook
- Market Size of Jordan Pressure Monitoring Market, 2025
- Forecast of Jordan Pressure Monitoring Market, 2032
- Historical Data and Forecast of Jordan Pressure Monitoring Revenues & Volume for the Period 2022-2032F
- Jordan Pressure Monitoring Market Trend Evolution
- Jordan Pressure Monitoring Market Drivers and Challenges
- Jordan Pressure Monitoring Price Trends
- Jordan Pressure Monitoring Porter's Five Forces
- Jordan Pressure Monitoring Industry Life Cycle
- Historical Data and Forecast of Jordan Pressure Monitoring Market Revenues & Volume By Product Type for the Period 2022-2032F
- Historical Data and Forecast of Jordan Pressure Monitoring Market Revenues & Volume By BP Monitors/Cardiac Pressure Monitors for the Period 2022-2032F
- Historical Data and Forecast of Jordan Pressure Monitoring Market Revenues & Volume By Pulmonary Pressure Monitors for the Period 2022-2032F
- Historical Data and Forecast of Jordan Pressure Monitoring Market Revenues & Volume By Intraocular Pressure Monitors for the Period 2022-2032F
- Historical Data and Forecast of Jordan Pressure Monitoring Market Revenues & Volume By Procedure for the Period 2022-2032F
- Historical Data and Forecast of Jordan Pressure Monitoring Market Revenues & Volume By Noninvasive for the Period 2022-2032F
- Historical Data and Forecast of Jordan Pressure Monitoring Market Revenues & Volume By Invasive for the Period 2022-2032F
- Historical Data and Forecast of Jordan Pressure Monitoring Market Revenues & Volume By Application for the Period 2022-2032F
- Historical Data and Forecast of Jordan Pressure Monitoring Market Revenues & Volume By Respiratory Disorders for the Period 2022-2032F
- Historical Data and Forecast of Jordan Pressure Monitoring Market Revenues & Volume By Glaucoma for the Period 2022-2032F
- Historical Data and Forecast of Jordan Pressure Monitoring Market Revenues & Volume By Cardiac Disorders for the Period 2022-2032F
- Historical Data and Forecast of Jordan Pressure Monitoring Market Revenues & Volume By Neurological Disorders for the Period 2022-2032F
- Historical Data and Forecast of Jordan Pressure Monitoring Market Revenues & Volume By Dialysis for the Period 2022-2032F
- Historical Data and Forecast of Jordan Pressure Monitoring Market Revenues & Volume By Others for the Period 2022-2032F
- Historical Data and Forecast of Jordan Pressure Monitoring Market Revenues & Volume By End-Use for the Period 2022-2032F
- Historical Data and Forecast of Jordan Pressure Monitoring Market Revenues & Volume By Hospitals for the Period 2022-2032F
- Historical Data and Forecast of Jordan Pressure Monitoring Market Revenues & Volume By Home Care Settings for the Period 2022-2032F
- Historical Data and Forecast of Jordan Pressure Monitoring Market Revenues & Volume By Ambulatory Surgical Centers and Clinics for the Period 2022-2032F
- Historical Data and Forecast of Jordan Pressure Monitoring Market Revenues & Volume By Diagnostic Laboratories for the Period 2022-2032F
- Historical Data and Forecast of Jordan Pressure Monitoring Market Revenues & Volume By Others for the Period 2022-2032F
- Jordan Pressure Monitoring Import Export Trade Statistics
- Market Opportunity Assessment By Product Type
- Market Opportunity Assessment By Procedure
- Market Opportunity Assessment By Application
- Market Opportunity Assessment By End-Use
- Jordan Pressure Monitoring Top Companies Market Share
- Jordan Pressure Monitoring Competitive Benchmarking By Technical and Operational Parameters
- Jordan Pressure Monitoring Company Profiles
- Jordan Pressure Monitoring Key Strategic Recommendations
Frequently Asked Questions About the Market Study (FAQs):
The market is driven by the increasing demand for accurate pressure measurement solutions across healthcare, industrial, and environmental sectors, as well as technological advancements in sensor technologies.
Challenges include a reliance on imports, lack of technical expertise among end users, regulatory hurdles, and economic fluctuations affecting investment levels.
The government is promoting investments, implementing regulations, supporting training programs, and encouraging local manufacturing to stimulate the market.
Recent developments include a focus on smart technology integration for enhanced monitoring solutions, increased collaboration to address awareness gaps, and ongoing investments in R&D for innovative pressure monitoring devices.
6Wresearch actively monitors the Jordan Pressure Monitoring Market and publishes its comprehensive annual report, highlighting emerging trends, growth drivers, revenue analysis, and forecast outlook. Our insights help businesses to make data-backed strategic decisions with ongoing market dynamics. Our analysts track relevent industries related to the Jordan Pressure Monitoring Market, allowing our clients with actionable intelligence and reliable forecasts tailored to emerging regional needs.
Yes, we provide customisation as per your requirements. To learn more, feel free to contact us on sales@6wresearch.com
1 Executive Summary |
2 Introduction |
2.1 Key Highlights of the Report |
2.2 Report Description |
2.3 Market Scope & Segmentation |
2.4 Research Methodology |
2.5 Assumptions |
3 Jordan Pressure Monitoring Market Overview |
3.1 Jordan Country Macro Economic Indicators |
3.2 Jordan Pressure Monitoring Market Revenues & Volume, 2022 & 2032F |
3.3 Jordan Pressure Monitoring Market - Industry Life Cycle |
3.4 Jordan Pressure Monitoring Market - Porter's Five Forces |
3.5 Jordan Pressure Monitoring Market Revenues & Volume Share, By Product Type, 2022 & 2032F |
3.6 Jordan Pressure Monitoring Market Revenues & Volume Share, By Procedure, 2022 & 2032F |
3.7 Jordan Pressure Monitoring Market Revenues & Volume Share, By Application, 2022 & 2032F |
3.8 Jordan Pressure Monitoring Market Revenues & Volume Share, By End-Use, 2022 & 2032F |
4 Jordan Pressure Monitoring Market Dynamics |
4.1 Impact Analysis |
4.2 Market Drivers |
4.3 Market Restraints |
5 Jordan Pressure Monitoring Market Trends |
6 Jordan Pressure Monitoring Market, By Types |
6.1 Jordan Pressure Monitoring Market, By Product Type |
6.1.1 Overview and Analysis |
6.1.2 Jordan Pressure Monitoring Market Revenues & Volume, By Product Type, 2022-2032F |
6.1.3 Jordan Pressure Monitoring Market Revenues & Volume, By BP Monitors/Cardiac Pressure Monitors, 2022-2032F |
6.1.4 Jordan Pressure Monitoring Market Revenues & Volume, By Pulmonary Pressure Monitors, 2022-2032F |
6.1.5 Jordan Pressure Monitoring Market Revenues & Volume, By Intraocular Pressure Monitors, 2022-2032F |
6.2 Jordan Pressure Monitoring Market, By Procedure |
6.2.1 Overview and Analysis |
6.2.2 Jordan Pressure Monitoring Market Revenues & Volume, By Noninvasive, 2022-2032F |
6.2.3 Jordan Pressure Monitoring Market Revenues & Volume, By Invasive, 2022-2032F |
6.3 Jordan Pressure Monitoring Market, By Application |
6.3.1 Overview and Analysis |
6.3.2 Jordan Pressure Monitoring Market Revenues & Volume, By Respiratory Disorders, 2022-2032F |
6.3.3 Jordan Pressure Monitoring Market Revenues & Volume, By Glaucoma, 2022-2032F |
6.3.4 Jordan Pressure Monitoring Market Revenues & Volume, By Cardiac Disorders, 2022-2032F |
6.3.5 Jordan Pressure Monitoring Market Revenues & Volume, By Neurological Disorders, 2022-2032F |
6.3.6 Jordan Pressure Monitoring Market Revenues & Volume, By Dialysis, 2022-2032F |
6.3.7 Jordan Pressure Monitoring Market Revenues & Volume, By Others, 2022-2032F |
6.4 Jordan Pressure Monitoring Market, By End-Use |
6.4.1 Overview and Analysis |
6.4.2 Jordan Pressure Monitoring Market Revenues & Volume, By Hospitals, 2022-2032F |
6.4.3 Jordan Pressure Monitoring Market Revenues & Volume, By Home Care Settings, 2022-2032F |
6.4.4 Jordan Pressure Monitoring Market Revenues & Volume, By Ambulatory Surgical Centers and Clinics, 2022-2032F |
6.4.5 Jordan Pressure Monitoring Market Revenues & Volume, By Diagnostic Laboratories, 2022-2032F |
6.4.6 Jordan Pressure Monitoring Market Revenues & Volume, By Others, 2022-2032F |
7 Jordan Pressure Monitoring Market Import-Export Trade Statistics |
7.1 Jordan Pressure Monitoring Market Export to Major Countries |
7.2 Jordan Pressure Monitoring Market Imports from Major Countries |
8 Jordan Pressure Monitoring Market Key Performance Indicators |
9 Jordan Pressure Monitoring Market - Opportunity Assessment |
9.1 Jordan Pressure Monitoring Market Opportunity Assessment, By Product Type, 2022 & 2032F |
9.2 Jordan Pressure Monitoring Market Opportunity Assessment, By Procedure, 2022 & 2032F |
9.3 Jordan Pressure Monitoring Market Opportunity Assessment, By Application, 2022 & 2032F |
9.4 Jordan Pressure Monitoring Market Opportunity Assessment, By End-Use, 2022 & 2032F |
10 Jordan Pressure Monitoring Market - Competitive Landscape |
10.1 Jordan Pressure Monitoring Market Revenue Share, By Companies, 2025 |
10.2 Jordan Pressure Monitoring Market Competitive Benchmarking, By Operating and Technical Parameters |
11 Company Profiles |
12 Recommendations |
13 Disclaimer |
Global Go To Market Strategy - 2030
Export potential enables firms to identify high-growth global markets with greater confidence by combining advanced trade intelligence with a structured quantitative methodology. The framework analyzes emerging demand trends and country-level import patterns while integrating macroeconomic and trade datasets such as GDP and population forecasts, bilateral import–export flows, tariff structures, elasticity differentials between developed and developing economies, geographic distance, and import demand projections. Using weighted trade values from 2020–2024 as the base period to project country-to-country export potential for 2030, these inputs are operationalized through calculated drivers such as gravity model parameters, tariff impact factors, and projected GDP per-capita growth. Through an analysis of hidden potentials, demand hotspots, and market conditions that are most favorable to success, this method enables firms to focus on target countries, maximize returns, and global expansion with data, backed by accuracy.
By factoring in the projected importer demand gap that is currently unmet and could be potential opportunity, it identifies the potential for the Exporter (Country) among 190 countries, against the general trade analysis, which identifies the biggest importer or exporter.
To discover high-growth global markets and optimize your business strategy:
Click Here
Pricing
- Single User License$ 1,995
- Department License$ 2,400
- Site License$ 3,120
- Global License$ 3,795

Leadership Perspectives from Industry Events
Search
Thought Leadership and Analyst Meet


Our Clients
6WResearch In News
- India Air Conditioner Market Set for Strong Rebound in 2026 After Weather-Led Correction and GST-Driven Recovery: 6Wresearch
- ADAS in India: How Automatic Emergency Braking, Blind Spot Detection & Driver Monitoring are Transforming Road Safety
- Doha a strategic location for EV manufacturing hub: IPA Qatar
- Demand for luxury TVs surging in the GCC, says Samsung
- Empowering Growth: The Thriving Journey of Bangladesh’s Cable Industry
- Demand for luxury TVs surging in the GCC, says Samsung
Latest Reports
- Nicaragua RPG Gaming Market (2026-2032)
- New Zealand RPG Gaming Market (2026-2032)
- Netherlands RPG Gaming Market (2026-2032)
- Nauru RPG Gaming Market (2026-2032)
- Namibia RPG Gaming Market (2026-2032)
- Mozambique RPG Gaming Market (2026-2032)
- Montenegro RPG Gaming Market (2026-2032)
- Mongolia RPG Gaming Market (2026-2032)
- Monaco RPG Gaming Market (2026-2032)
- Micronesia RPG Gaming Market (2026-2032)
Industry Events and Analyst Meet

EV India Expo 2026

HIMTEX 2026

India Refining Summit 2026

India EV Show 2026

EV tech India Expo 2026
Whitepaper
- Middle East & Africa Commercial Security Market Click here to view more.
- Middle East & Africa Fire Safety Systems & Equipment Market Click here to view more.
- GCC Drone Market Click here to view more.
- Middle East Lighting Fixture Market Click here to view more.
- GCC Physical & Perimeter Security Market Click here to view more.