Jordan Sand & Gravel Market (2026-2032) Outlook | Industry, Size, Value, Revenue, Forecast, Growth, Trends, Companies, Analysis & Share
Market Forecast By Product Type (Coarse Crushed Limestone Gravel, Pit Or Coarse Sand, Crushed Clean Stone, Fine Limestone Gravel, River Sand), By End Users (Glass, Road Construction, Mining, Foundry, Others) And Competitive Landscape
| Product Code: ETC304546 | Publication Date: Aug 2022 | Updated Date: Jul 2026 | Product Type: Market Research Report | |
| Publisher: 6Wresearch | Author: Sachin Kumar Rai | No. of Pages: 75 | No. of Figures: 35 | No. of Tables: 20 |
Jordan Sand & Gravel Market Size, Share & Growth Rate
The Jordan Sand & Gravel Market was estimated at USD 313 Million in 2025 and is projected to reach USD 441 Million by 2032, growing at a CAGR of 5.0% from 2026 to 2032. This impressive trajectory is fueled by continuous investments in infrastructure development, coupled with an urbanization trend that demands increased quantities of quality construction materials. As Jordan's economy stabilizes and grows, so too does the need for essential resources in construction and landscaping, further propelling market momentum.
Jordan Sand & Gravel Market Year-wise Growth Rate and Key Drivers
This graph highlights how the Jordan Sand & Gravel Market has steadily grown over the years, supported by major growth factors.
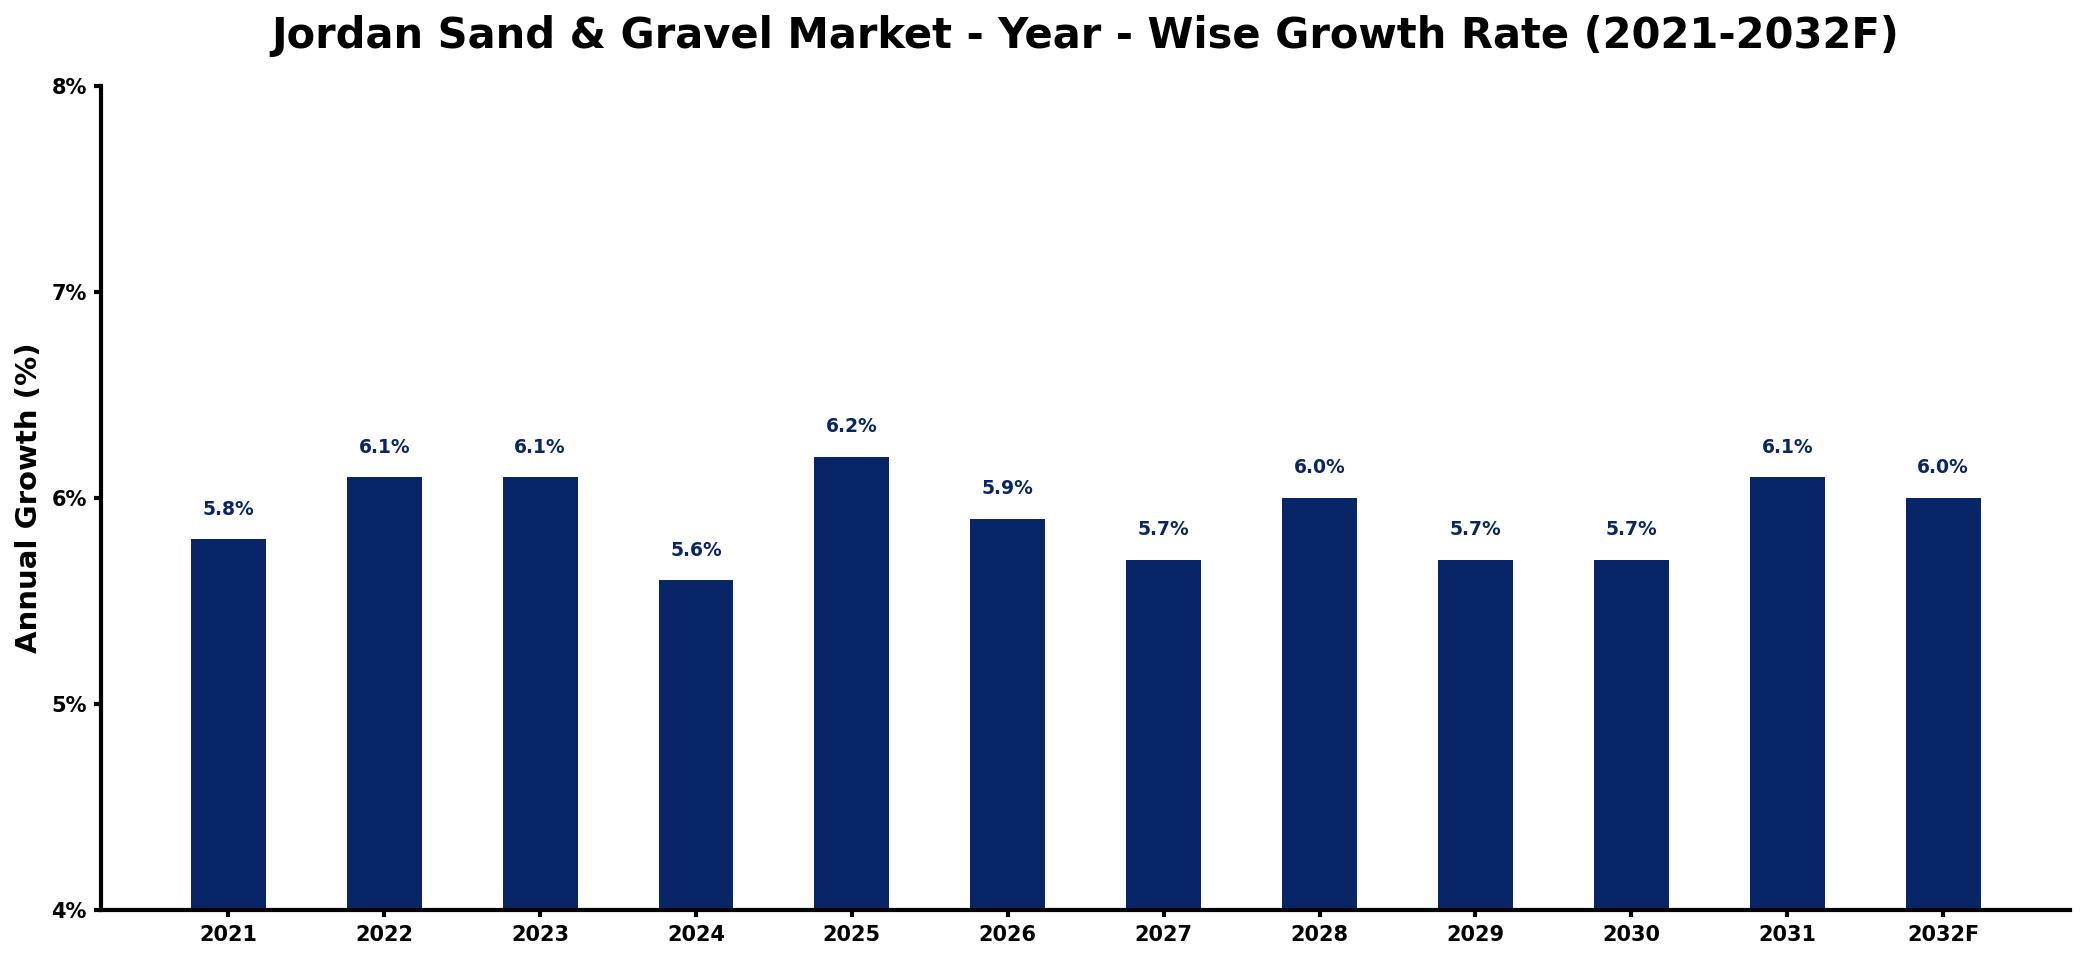
The table below presents the year‑wise growth rates along with the key drivers influencing the market
| Year | Growth Rate | Major Drivers |
| 2021 | 5.8% | Infrastructure projects increase demand |
| 2022 | 6.1% | Residential construction activities rising |
| 2023 | 6.1% | Government investments in construction |
| 2024 | 5.6% | Urban development initiatives underway |
| 2025 | 6.2% | Renewable energy projects expanding rapidly |
| 2026 | 5.9% | Road maintenance programs gaining traction |
| 2027 | 5.7% | Commercial real estate developments growing |
| 2028 | 6.0% | Public works initiatives boosting investment |
| 2029 | 5.7% | Green building practices gaining popularity |
| 2030 | 5.7% | Transportation projects driving demand |
| 2031 | 6.1% | Mining sector investments increasing significantly |
| 2032 | 6.0% | Land reclamation efforts underway nationwide |
Note: Market size estimations and growth projections presented in this report are based on 6Wresearch's proprietary forecasting methodology, utilizing the latest available industry data, government publications, and primary research inputs.
Jordan Sand & Gravel Market Synopsis
The Jordan Sand & Gravel Market has recently experienced robust growth due to heightened construction activity driven by government initiatives and private sector investments. Looking ahead, the market is poised for sustained expansion as urbanization continues, and infrastructure projects evolve to meet the needs of a growing population.
However, the landscape is changing as environmental sustainability becomes a crucial consideration. Companies in the Jordan Sand & Gravel Market are increasingly adopting responsible sourcing and production practices to mitigate their ecological footprint while still meeting the demands of a burgeoning construction sector.
- The market is driven by increased demand for high-quality aggregates in various construction applications.
- Sustainability and environmental regulations are reshaping operational practices in the industry.
- Technological advancements are enhancing the efficiency of sand and gravel production processes.
- Recycled aggregates are gaining traction as an eco-friendly alternative to natural resources.
- Government policies are focused on regulating mining activities and promoting responsible extraction.
Despite its positive outlook, the Jordan Sand & Gravel Market is confronted with challenges that could impede growth. Stringent environmental regulations can lead to increased compliance costs, ultimately affecting profit margins. Moreover, the competitive nature of the market intensifies pressure on pricing structures, forcing companies to innovate while keeping costs in check. Fluctuating demand tied to the economic cycle can also introduce instability, making it essential for industry players to remain agile and responsive to market dynamics.
Currently, the market is witnessing a shift towards the use of high-quality aggregates that meet stringent specifications for infrastructure projects. Sustainable practices, such as eco-friendly extraction techniques and the use of recycled aggregates, are emerging trends that align with global sustainability goals. Technological advancements in production methods, such as enhanced crushing and screening processes, are also driving efficiency and productivity, ensuring that companies can meet growing demands without compromising on quality.
Investors and stakeholders in the Jordan Sand & Gravel Market can explore several promising avenues for growth. Significant opportunities exist in supplying materials for infrastructure projects that are pivotal to the country's economic development. Furthermore, specialized services in extraction, processing, and logistics can cater to the evolving needs of the construction sector. By embracing sustainable practices, companies can position themselves favorably in a market that increasingly values environmental responsibility.
The Jordanian government has put in place a series of policies aimed at regulating mining activities to ensure environmental sustainability. This includes licensing requirements for companies involved in extraction, transportation, and sales of sand and gravel. The government emphasizes compliance with strict extraction quotas to protect natural resources and mandates environmental impact assessments for mining operations, ensuring that companies adhere to guidelines for land reclamation and restoration following extraction.
Looking towards 2026-2032, the Jordan Sand & Gravel Market is anticipated to maintain a robust growth trajectory. Increased construction activities, bolstered by government initiatives focused on infrastructure enhancement and urban expansion, will likely continue to drive demand. The trend towards sustainable construction practices, alongside rising consumer awareness of environmental issues, will create new pathways for innovation, enabling market players to offer products that align with eco-friendly standards and practices.
Recently, the Jordan Sand & Gravel Market has seen a heightened focus on sustainable extraction practices, with more companies investing in eco-friendly technologies. Regulatory bodies have intensified efforts to monitor compliance with environmental standards, ensuring that the market adapts to changing regulations. Additionally, a growing number of industry collaborations are emerging, aimed at sharing best practices and enhancing operational efficiencies in sand and gravel production and logistics.
- 10 Years of Market Numbers
- Historical Data Starting from 2022 to 2025
- Base Year: 2025
- Forecast Data until 2032
- Key Performance Indicators Impacting the Market
- Major Upcoming Developments and Projects
Key Highlights of the Report:
- Jordan Sand & Gravel Market Outlook
- Market Size of Jordan Sand & Gravel Market, 2025
- Forecast of Jordan Sand & Gravel Market, 2032
- Historical Data and Forecast of Jordan Sand & Gravel Revenues & Volume for the Period 2022-2032F
- Jordan Sand & Gravel Market Trend Evolution
- Jordan Sand & Gravel Market Drivers and Challenges
- Jordan Sand & Gravel Price Trends
- Jordan Sand & Gravel Porter's Five Forces
- Jordan Sand & Gravel Industry Life Cycle
- Historical Data and Forecast of Jordan Sand & Gravel Market Revenues & Volume By Product Type for the Period 2022-2032F
- Historical Data and Forecast of Jordan Sand & Gravel Market Revenues & Volume By Coarse Crushed Limestone Gravel for the Period 2022-2032F
- Historical Data and Forecast of Jordan Sand & Gravel Market Revenues & Volume By Pit Or Coarse Sand for the Period 2022-2032F
- Historical Data and Forecast of Jordan Sand & Gravel Market Revenues & Volume By Crushed Clean Stone for the Period 2022-2032F
- Historical Data and Forecast of Jordan Sand & Gravel Market Revenues & Volume By Fine Limestone Gravel for the Period 2022-2032F
- Historical Data and Forecast of Jordan Sand & Gravel Market Revenues & Volume By River Sand for the Period 2022-2032F
- Historical Data and Forecast of Jordan Sand & Gravel Market Revenues & Volume By End Users for the Period 2022-2032F
- Historical Data and Forecast of Jordan Sand & Gravel Market Revenues & Volume By Glass for the Period 2022-2032F
- Historical Data and Forecast of Jordan Sand & Gravel Market Revenues & Volume By Road Construction for the Period 2022-2032F
- Historical Data and Forecast of Jordan Sand & Gravel Market Revenues & Volume By Mining for the Period 2022-2032F
- Historical Data and Forecast of Jordan Sand & Gravel Market Revenues & Volume By Foundry for the Period 2022-2032F
- Historical Data and Forecast of Jordan Sand & Gravel Market Revenues & Volume By Others for the Period 2022-2032F
- Jordan Sand & Gravel Import Export Trade Statistics
- Market Opportunity Assessment By Product Type
- Market Opportunity Assessment By End Users
- Jordan Sand & Gravel Top Companies Market Share
- Jordan Sand & Gravel Competitive Benchmarking By Technical and Operational Parameters
- Jordan Sand & Gravel Company Profiles
- Jordan Sand & Gravel Key Strategic Recommendations
Frequently Asked Questions About the Market Study (FAQs):
The Jordan Sand & Gravel Market is expected to grow at a CAGR of 5.0% from 2026 to 2032, with an estimated value of USD 441 Million by 2032.
Environmental regulations are prompting companies to adopt sustainable practices, which can increase operational costs but ultimately lead to more responsible resource management and improved company reputations.
Trends include a growing preference for high-quality aggregates for infrastructure projects and a shift towards using recycled aggregates, which align with sustainability goals.
The government plays a crucial role by regulating extraction practices, issuing licenses, and promoting sustainable practices through various policies aimed at environmental conservation.
Investment opportunities include supplying materials for major infrastructure projects, specialized extraction and processing services, and the adoption of sustainable technologies.
6Wresearch actively monitors the Jordan Sand & Gravel Market and publishes its comprehensive annual report, highlighting emerging trends, growth drivers, revenue analysis, and forecast outlook. Our insights help businesses to make data-backed strategic decisions with ongoing market dynamics. Our analysts track relevent industries related to the Jordan Sand & Gravel Market, allowing our clients with actionable intelligence and reliable forecasts tailored to emerging regional needs.
Yes, we provide customisation as per your requirements. To learn more, feel free to contact us on sales@6wresearch.com
1 Executive Summary |
2 Introduction |
2.1 Key Highlights of the Report |
2.2 Report Description |
2.3 Market Scope & Segmentation |
2.4 Research Methodology |
2.5 Assumptions |
3 Jordan Sand & Gravel Market Overview |
3.1 Jordan Country Macro Economic Indicators |
3.2 Jordan Sand & Gravel Market Revenues & Volume, 2022 & 2032F |
3.3 Jordan Sand & Gravel Market - Industry Life Cycle |
3.4 Jordan Sand & Gravel Market - Porter's Five Forces |
3.5 Jordan Sand & Gravel Market Revenues & Volume Share, By Product Type, 2022 & 2032F |
3.6 Jordan Sand & Gravel Market Revenues & Volume Share, By End Users, 2022 & 2032F |
4 Jordan Sand & Gravel Market Dynamics |
4.1 Impact Analysis |
4.2 Market Drivers |
4.2.1 Increasing construction activities in Jordan |
4.2.2 Growing infrastructure development projects |
4.2.3 Rise in demand for sand and gravel in the manufacturing industry |
4.3 Market Restraints |
4.3.1 Environmental regulations affecting extraction and production processes |
4.3.2 Fluctuating raw material prices |
4.3.3 Competition from alternative materials like recycled aggregates |
5 Jordan Sand & Gravel Market Trends |
6 Jordan Sand & Gravel Market, By Types |
6.1 Jordan Sand & Gravel Market, By Product Type |
6.1.1 Overview and Analysis |
6.1.2 Jordan Sand & Gravel Market Revenues & Volume, By Product Type, 2022-2032F |
6.1.3 Jordan Sand & Gravel Market Revenues & Volume, By Coarse Crushed Limestone Gravel, 2022-2032F |
6.1.4 Jordan Sand & Gravel Market Revenues & Volume, By Pit Or Coarse Sand, 2022-2032F |
6.1.5 Jordan Sand & Gravel Market Revenues & Volume, By Crushed Clean Stone, 2022-2032F |
6.1.6 Jordan Sand & Gravel Market Revenues & Volume, By Fine Limestone Gravel, 2022-2032F |
6.1.7 Jordan Sand & Gravel Market Revenues & Volume, By River Sand, 2022-2032F |
6.2 Jordan Sand & Gravel Market, By End Users |
6.2.1 Overview and Analysis |
6.2.2 Jordan Sand & Gravel Market Revenues & Volume, By Glass, 2022-2032F |
6.2.3 Jordan Sand & Gravel Market Revenues & Volume, By Road Construction, 2022-2032F |
6.2.4 Jordan Sand & Gravel Market Revenues & Volume, By Mining, 2022-2032F |
6.2.5 Jordan Sand & Gravel Market Revenues & Volume, By Foundry, 2022-2032F |
6.2.6 Jordan Sand & Gravel Market Revenues & Volume, By Others, 2022-2032F |
7 Jordan Sand & Gravel Market Import-Export Trade Statistics |
7.1 Jordan Sand & Gravel Market Export to Major Countries |
7.2 Jordan Sand & Gravel Market Imports from Major Countries |
8 Jordan Sand & Gravel Market Key Performance Indicators |
8.1 Average selling price of sand and gravel |
8.2 Volume of sand and gravel used in construction projects |
8.3 Number of infrastructure projects utilizing sand and gravel |
9 Jordan Sand & Gravel Market - Opportunity Assessment |
9.1 Jordan Sand & Gravel Market Opportunity Assessment, By Product Type, 2022 & 2032F |
9.2 Jordan Sand & Gravel Market Opportunity Assessment, By End Users, 2022 & 2032F |
10 Jordan Sand & Gravel Market - Competitive Landscape |
10.1 Jordan Sand & Gravel Market Revenue Share, By Companies, 2025 |
10.2 Jordan Sand & Gravel Market Competitive Benchmarking, By Operating and Technical Parameters |
11 Company Profiles |
12 Recommendations |
13 Disclaimer |
Global Go To Market Strategy - 2030
Export potential enables firms to identify high-growth global markets with greater confidence by combining advanced trade intelligence with a structured quantitative methodology. The framework analyzes emerging demand trends and country-level import patterns while integrating macroeconomic and trade datasets such as GDP and population forecasts, bilateral import–export flows, tariff structures, elasticity differentials between developed and developing economies, geographic distance, and import demand projections. Using weighted trade values from 2020–2024 as the base period to project country-to-country export potential for 2030, these inputs are operationalized through calculated drivers such as gravity model parameters, tariff impact factors, and projected GDP per-capita growth. Through an analysis of hidden potentials, demand hotspots, and market conditions that are most favorable to success, this method enables firms to focus on target countries, maximize returns, and global expansion with data, backed by accuracy.
By factoring in the projected importer demand gap that is currently unmet and could be potential opportunity, it identifies the potential for the Exporter (Country) among 190 countries, against the general trade analysis, which identifies the biggest importer or exporter.
To discover high-growth global markets and optimize your business strategy:
Click Here
Pricing
- Single User License$ 1,995
- Department License$ 2,400
- Site License$ 3,120
- Global License$ 3,795

Leadership Perspectives from Industry Events
Search
Thought Leadership and Analyst Meet


Our Clients
6WResearch In News
- India Air Conditioner Market Set for Strong Rebound in 2026 After Weather-Led Correction and GST-Driven Recovery: 6Wresearch
- ADAS in India: How Automatic Emergency Braking, Blind Spot Detection & Driver Monitoring are Transforming Road Safety
- Doha a strategic location for EV manufacturing hub: IPA Qatar
- Demand for luxury TVs surging in the GCC, says Samsung
- Empowering Growth: The Thriving Journey of Bangladesh’s Cable Industry
- Demand for luxury TVs surging in the GCC, says Samsung
Latest Reports
- Nicaragua RPG Gaming Market (2026-2032)
- New Zealand RPG Gaming Market (2026-2032)
- Netherlands RPG Gaming Market (2026-2032)
- Nauru RPG Gaming Market (2026-2032)
- Namibia RPG Gaming Market (2026-2032)
- Mozambique RPG Gaming Market (2026-2032)
- Montenegro RPG Gaming Market (2026-2032)
- Mongolia RPG Gaming Market (2026-2032)
- Monaco RPG Gaming Market (2026-2032)
- Micronesia RPG Gaming Market (2026-2032)
Industry Events and Analyst Meet

EV India Expo 2026

HIMTEX 2026

India Refining Summit 2026

India EV Show 2026

EV tech India Expo 2026
Whitepaper
- Middle East & Africa Commercial Security Market Click here to view more.
- Middle East & Africa Fire Safety Systems & Equipment Market Click here to view more.
- GCC Drone Market Click here to view more.
- Middle East Lighting Fixture Market Click here to view more.
- GCC Physical & Perimeter Security Market Click here to view more.