Jordan Transistors Market (2025-2031) | Outlook, Value, Revenue, Share, Size, Forecast, Analysis, Growth, Trends, Industry & Companies
Market Forecast By Types (Bipolar Junction Transistor, Field Effect Transistor, Heterojunction Bipolar Transistor, Others), By Applications (Consumer Electronics, Communication And Technology, Automotive, Manufacturing) And Competitive Landscape
| Product Code: ETC006426 | Publication Date: Sep 2020 | Updated Date: Feb 2025 | Product Type: Report | |
| Publisher: 6Wresearch | Author: Ravi Bhandari | No. of Pages: 70 | No. of Figures: 35 | No. of Tables: 5 |
Jordan Transistors Market Summary
The jordan transistors market was estimated at USD 495 Million in 2025 and is projected to reach USD 668 Million by 2032, growing at a CAGR of 4.8% from 2026 to 2032.
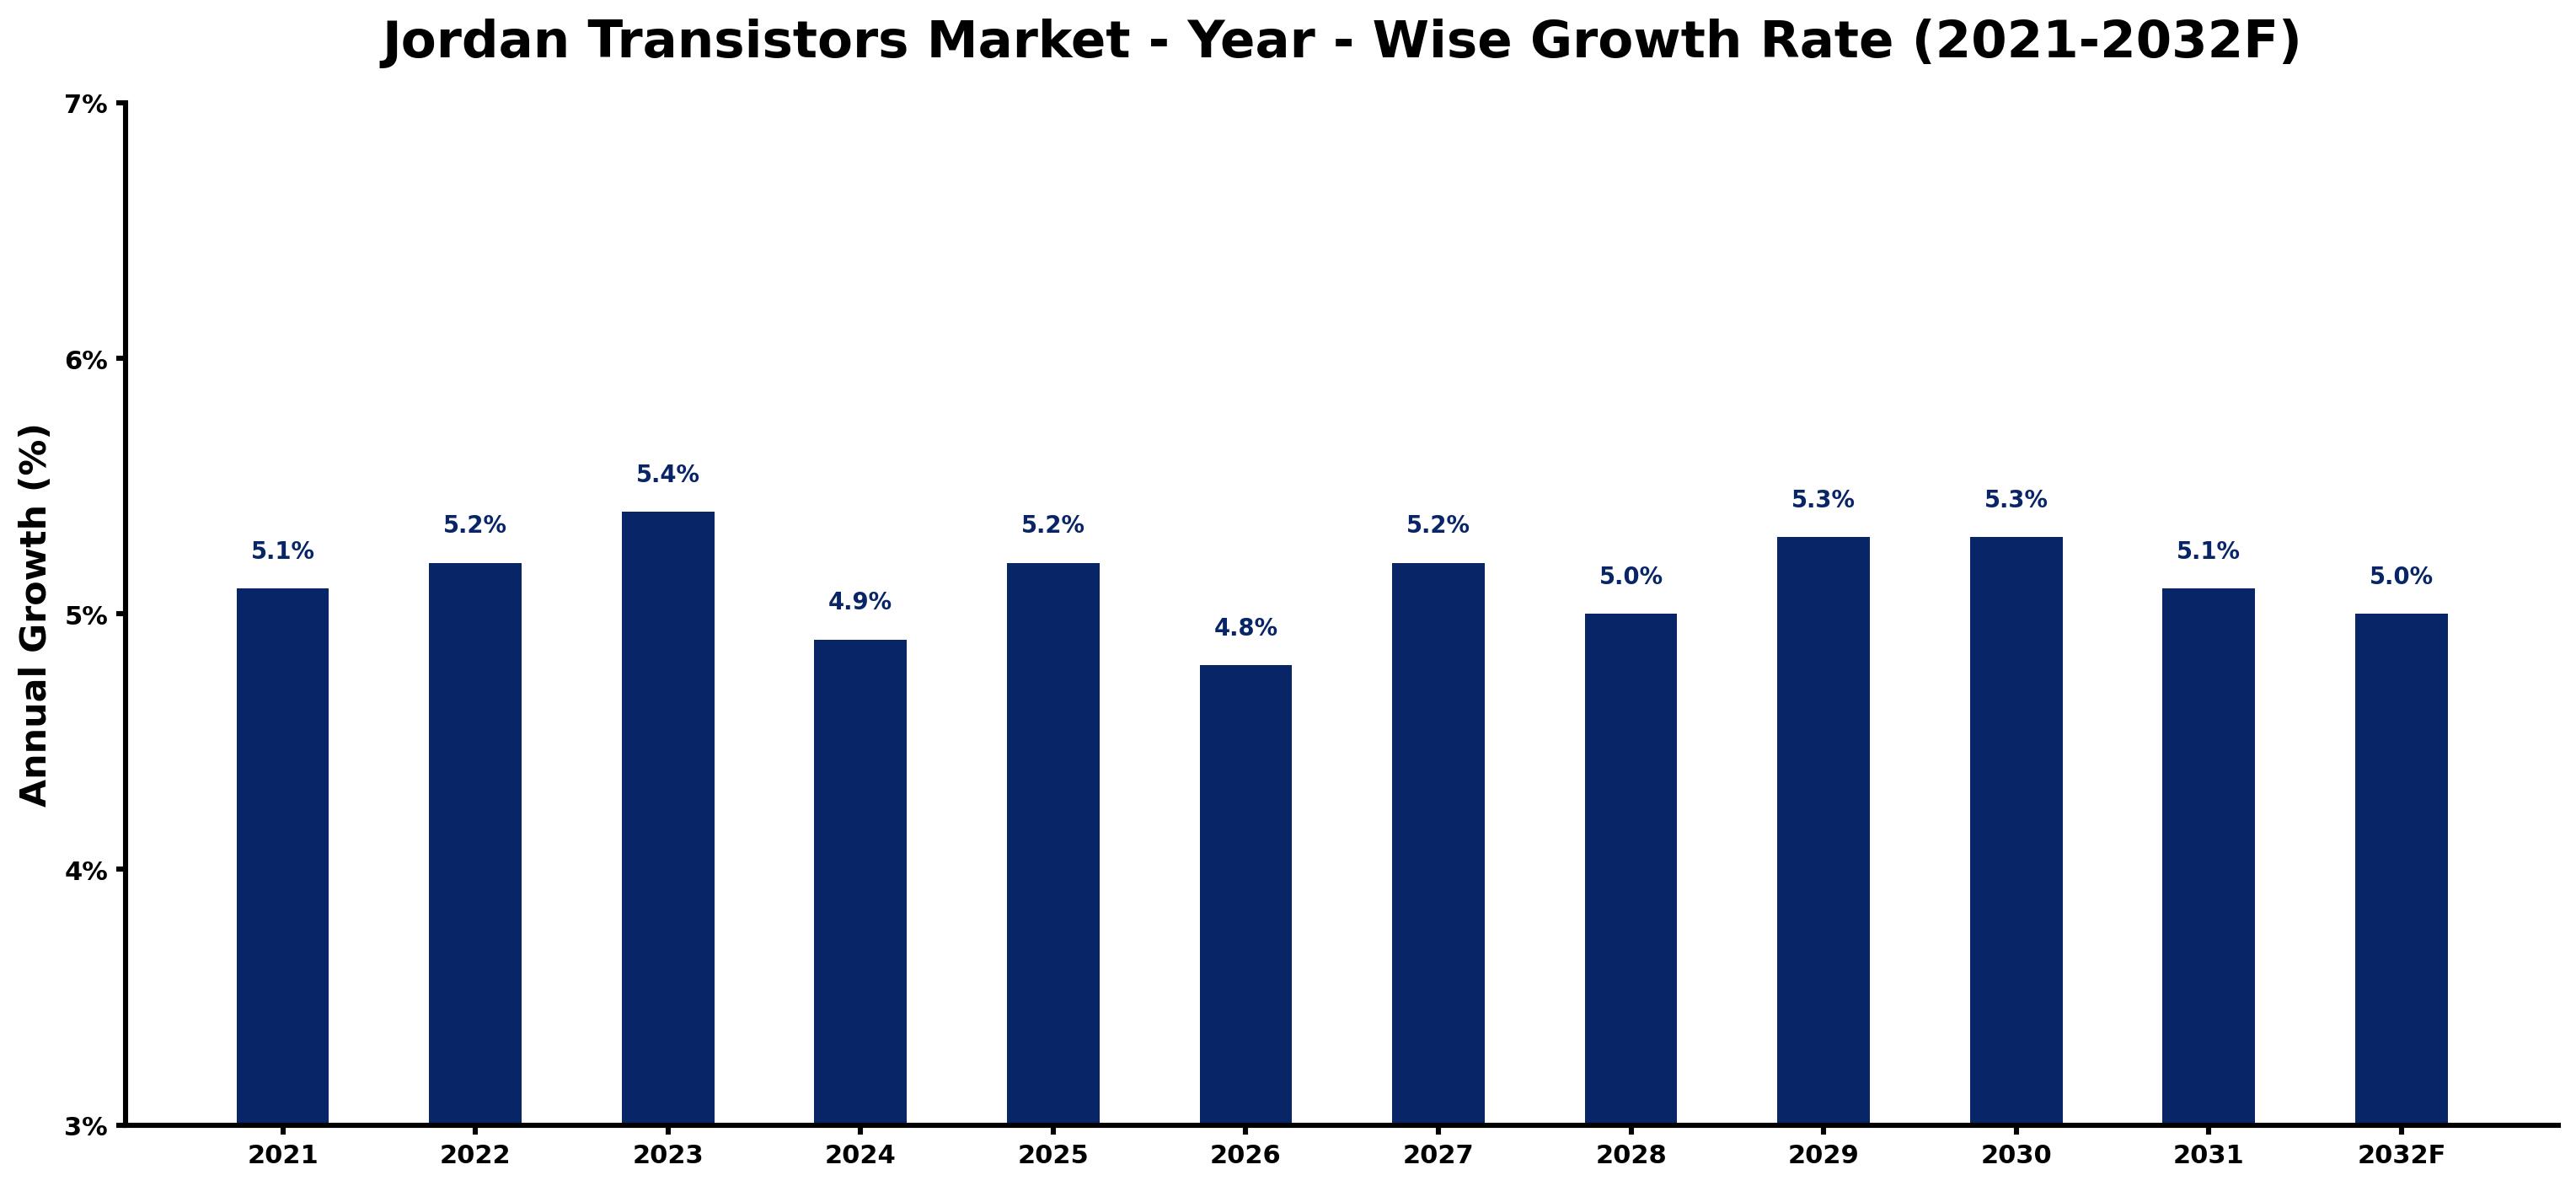
Jordan Transistors Market Growth Rate Analysis (2021-2032)
The Jordan Transistors market has displayed a stable growth pattern, with annual growth rates peaking at 5.4% in 2023 before slightly declining to 4.9% in 2024. This fluctuation can be attributed to shifts in consumer demand and technological advancements that necessitate higher efficiency and effectiveness in transistor components. The market rebounded with 5.2% growth in 2025 and maintained a similar rate through 2027, driven by increased investments in the tech sector and infrastructure enhancements. However, slight dips in 2026 and again in 2032 reflect the impacts of external economic pressures and evolving energy transition policies, prompting manufacturers to adapt to changing market dynamics while still cultivating steady growth in subsequent years.
Jordan Transistors Market Year-wise Growth Rate and Key Drivers
This graph highlights how the Jordan Transistors Market has steadily grown over the past five years, supported by major growth factors.
The table below presents the year‑wise growth rates along with the key drivers influencing the market
| Year | Growth Rate | Major Drivers |
| 2021 | 5.1% | Post-pandemic recovery facilitated increased consumer electronics production across Jordan. |
| 2022 | 5.2% | Local manufacturers collaborated with suppliers, enhancing transistor quality and accessibility. |
| 2023 | 5.4% | Infrastructure improvements enabled better distribution of electronic components throughout the region. |
| 2024 | 4.9% | Emerging tech startups began innovating, focusing on energy-efficient transistor solutions. |
| 2025 | 5.2% | Growing interest in renewable energy sources spurred demand for efficient transistors. |
| 2026 | 4.8% | Foreign investment in Jordan's tech sector highlighted the country's manufacturing potential. |
| 2027 | 5.2% | Increased smartphone penetration required more compact and efficient transistor designs. |
| 2028 | 5.0% | Shifts in consumer preferences towards smart devices created a niche market for transistors. |
| 2029 | 5.3% | Collaborative research with universities yielded breakthroughs in semiconductor technology. |
| 2030 | 5.3% | Regional trade agreements lowered costs, making transistors more affordable for local companies. |
| 2031 | 5.1% | Emerging markets in Jordan saw a surge in demand for consumer electronics. |
| 2032 | 5.0% | Technological convergence of IoT further accelerated the need for high-performance transistors. |
Note - Market size estimations and growth projections presented in this report are based on 6Wresearch's advanced forecasting approach, validated with industry datasets as of June 2026.
Key Highlights of the Report:
- Jordan Transistors Market Outlook
- Market Size of Jordan Transistors Market, 2024
- Forecast of Jordan Transistors Market, 2031
- Historical Data and Forecast of Jordan Transistors Revenues & Volume for the Period 2021 - 2031
- Jordan Transistors Market Trend Evolution
- Jordan Transistors Market Drivers and Challenges
- Jordan Transistors Price Trends
- Jordan Transistors Porter's Five Forces
- Jordan Transistors Industry Life Cycle
- Historical Data and Forecast of Jordan Transistors Market Revenues & Volume By Types for the Period 2021 - 2031
- Historical Data and Forecast of Jordan Transistors Market Revenues & Volume By Bipolar Junction Transistor for the Period 2021 - 2031
- Historical Data and Forecast of Jordan Transistors Market Revenues & Volume By Field Effect Transistor for the Period 2021 - 2031
- Historical Data and Forecast of Jordan Transistors Market Revenues & Volume By Heterojunction Bipolar Transistor for the Period 2021 - 2031
- Historical Data and Forecast of Jordan Transistors Market Revenues & Volume By Others for the Period 2021 - 2031
- Historical Data and Forecast of Jordan Transistors Market Revenues & Volume By Applications for the Period 2021 - 2031
- Historical Data and Forecast of Jordan Transistors Market Revenues & Volume By Consumer Electronics for the Period 2021 - 2031
- Historical Data and Forecast of Jordan Transistors Market Revenues & Volume By Communication And Technology for the Period 2021 - 2031
- Historical Data and Forecast of Jordan Transistors Market Revenues & Volume By Automotive for the Period 2021 - 2031
- Historical Data and Forecast of Jordan Transistors Market Revenues & Volume By Manufacturing for the Period 2021 - 2031
- Jordan Transistors Import Export Trade Statistics
- Market Opportunity Assessment By Types
- Market Opportunity Assessment By Applications
- Jordan Transistors Top Companies Market Share
- Jordan Transistors Competitive Benchmarking By Technical and Operational Parameters
- Jordan Transistors Company Profiles
- Jordan Transistors Key Strategic Recommendations
Frequently Asked Questions About the Market Study (FAQs):
6Wresearch actively monitors the Jordan Transistors Market and publishes its comprehensive annual report, highlighting emerging trends, growth drivers, revenue analysis, and forecast outlook. Our insights help businesses to make data-backed strategic decisions with ongoing market dynamics. Our analysts track relevent industries related to the Jordan Transistors Market, allowing our clients with actionable intelligence and reliable forecasts tailored to emerging regional needs.
Yes, we provide customisation as per your requirements. To learn more, feel free to contact us on sales@6wresearch.com
1 Executive Summary |
2 Introduction |
2.1 Key Highlights of the Report |
2.2 Report Description |
2.3 Market Scope & Segmentation |
2.4 Research Methodology |
2.5 Assumptions |
3 Jordan Transistors Market Overview |
3.1 Jordan Country Macro Economic Indicators |
3.2 Jordan Transistors Market Revenues & Volume, 2021 & 2031F |
3.3 Jordan Transistors Market - Industry Life Cycle |
3.4 Jordan Transistors Market - Porter's Five Forces |
3.5 Jordan Transistors Market Revenues & Volume Share, By Types, 2021 & 2031F |
3.6 Jordan Transistors Market Revenues & Volume Share, By Applications, 2021 & 2031F |
4 Jordan Transistors Market Dynamics |
4.1 Impact Analysis |
4.2 Market Drivers |
4.3 Market Restraints |
5 Jordan Transistors Market Trends |
6 Jordan Transistors Market, By Types |
6.1 Jordan Transistors Market, By Types |
6.1.1 Overview and Analysis |
6.1.2 Jordan Transistors Market Revenues & Volume, By Types, 2021 - 2031F |
6.1.3 Jordan Transistors Market Revenues & Volume, By Bipolar Junction Transistor, 2021 - 2031F |
6.1.4 Jordan Transistors Market Revenues & Volume, By Field Effect Transistor, 2021 - 2031F |
6.1.5 Jordan Transistors Market Revenues & Volume, By Heterojunction Bipolar Transistor, 2021 - 2031F |
6.1.6 Jordan Transistors Market Revenues & Volume, By Others, 2021 - 2031F |
6.2 Jordan Transistors Market, By Applications |
6.2.1 Overview and Analysis |
6.2.2 Jordan Transistors Market Revenues & Volume, By Consumer Electronics, 2021 - 2031F |
6.2.3 Jordan Transistors Market Revenues & Volume, By Communication And Technology, 2021 - 2031F |
6.2.4 Jordan Transistors Market Revenues & Volume, By Automotive, 2021 - 2031F |
6.2.5 Jordan Transistors Market Revenues & Volume, By Manufacturing, 2021 - 2031F |
7 Jordan Transistors Market Import-Export Trade Statistics |
7.1 Jordan Transistors Market Export to Major Countries |
7.2 Jordan Transistors Market Imports from Major Countries |
8 Jordan Transistors Market Key Performance Indicators |
9 Jordan Transistors Market - Opportunity Assessment |
9.1 Jordan Transistors Market Opportunity Assessment, By Types, 2021 & 2031F |
9.2 Jordan Transistors Market Opportunity Assessment, By Applications, 2021 & 2031F |
10 Jordan Transistors Market - Competitive Landscape |
10.1 Jordan Transistors Market Revenue Share, By Companies, 2024 |
10.2 Jordan Transistors Market Competitive Benchmarking, By Operating and Technical Parameters |
11 Company Profiles |
12 Recommendations |
13 Disclaimer |
Global Go To Market Strategy - 2030
Export potential enables firms to identify high-growth global markets with greater confidence by combining advanced trade intelligence with a structured quantitative methodology. The framework analyzes emerging demand trends and country-level import patterns while integrating macroeconomic and trade datasets such as GDP and population forecasts, bilateral import–export flows, tariff structures, elasticity differentials between developed and developing economies, geographic distance, and import demand projections. Using weighted trade values from 2020–2024 as the base period to project country-to-country export potential for 2030, these inputs are operationalized through calculated drivers such as gravity model parameters, tariff impact factors, and projected GDP per-capita growth. Through an analysis of hidden potentials, demand hotspots, and market conditions that are most favorable to success, this method enables firms to focus on target countries, maximize returns, and global expansion with data, backed by accuracy.
By factoring in the projected importer demand gap that is currently unmet and could be potential opportunity, it identifies the potential for the Exporter (Country) among 190 countries, against the general trade analysis, which identifies the biggest importer or exporter.
To discover high-growth global markets and optimize your business strategy:
Click Here
Pricing
- Single User License$ 1,995
- Department License$ 2,400
- Site License$ 3,120
- Global License$ 3,795

Leadership Perspectives from Industry Events
Search
Thought Leadership and Analyst Meet


Our Clients
6WResearch In News
- Doha a strategic location for EV manufacturing hub: IPA Qatar
- Demand for luxury TVs surging in the GCC, says Samsung
- Empowering Growth: The Thriving Journey of Bangladesh’s Cable Industry
- Demand for luxury TVs surging in the GCC, says Samsung
- Video call with a traditional healer? Once unthinkable, it’s now common in South Africa
- Intelligent Buildings To Smooth GCC’s Path To Net Zero
Latest Reports
- New Zealand Aseptic Manufacturing Market (2026-2032)
- Netherlands Aseptic Manufacturing Market (2026-2032)
- Nauru Aseptic Manufacturing Market (2026-2032)
- Namibia Aseptic Manufacturing Market (2026-2032)
- Mozambique Aseptic Manufacturing Market (2026-2032)
- Montenegro Aseptic Manufacturing Market (2026-2032)
- Mongolia Aseptic Manufacturing Market (2026-2032)
- Monaco Aseptic Manufacturing Market (2026-2032)
- Micronesia Aseptic Manufacturing Market (2026-2032)
- Mauritius Aseptic Manufacturing Market (2026-2032)
Industry Events and Analyst Meet

HIMTEX 2026

India Refining Summit 2026

India EV Show 2026

EV tech India Expo 2026

Auto Tech Asia 2026
Whitepaper
- Middle East & Africa Commercial Security Market Click here to view more.
- Middle East & Africa Fire Safety Systems & Equipment Market Click here to view more.
- GCC Drone Market Click here to view more.
- Middle East Lighting Fixture Market Click here to view more.
- GCC Physical & Perimeter Security Market Click here to view more.