Jordan Underground Utility Mapping Market Size & Growth Rate (2026-2032)
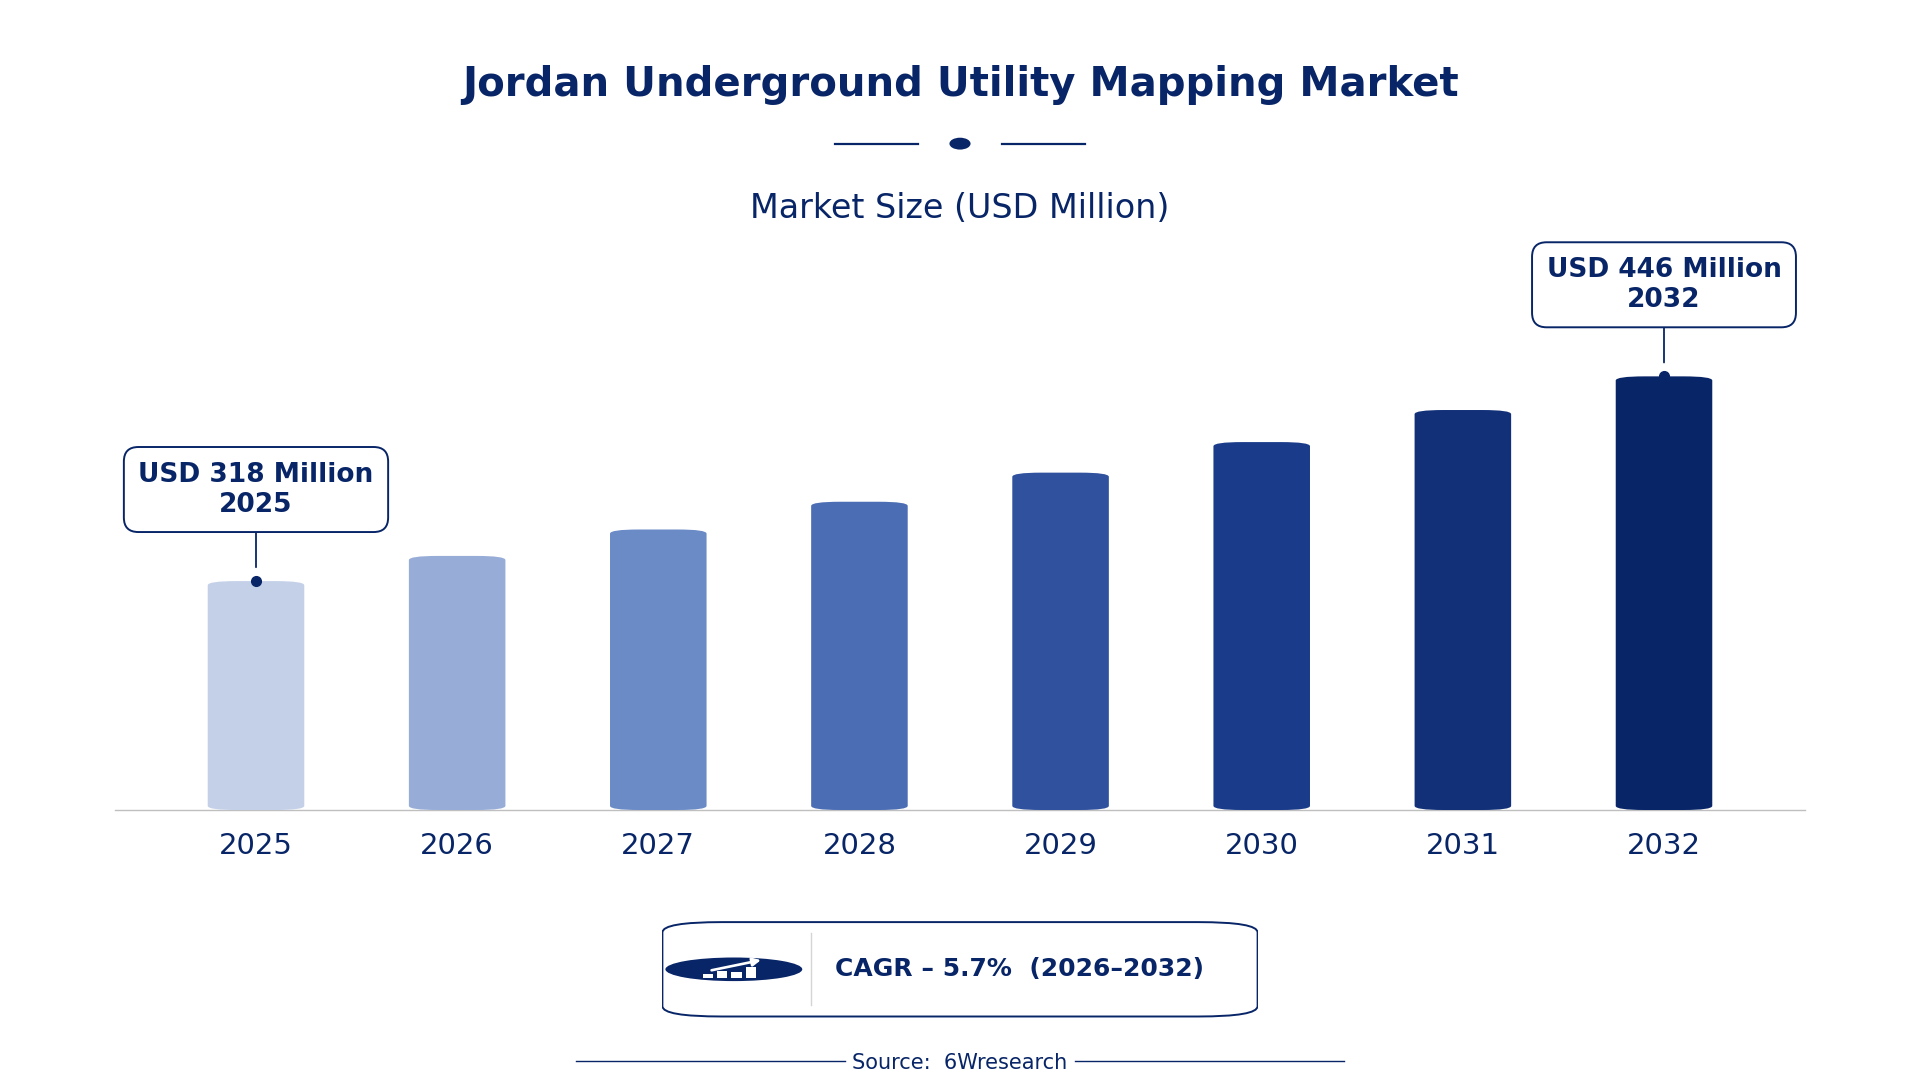
The Jordan Underground Utility Mapping Market was estimated at USD 318 Million in 2025 and is projected to reach USD 446 Million by 2032, growing at a CAGR of 5.7% from 2026 to 2032.
Jordan Underground Utility Mapping Market Synopsis
Jordan’s underground utility mapping market is witnessing robust growth driven by urban expansion and infrastructure development. Accurate mapping solutions are becoming essential to prevent costly damage during construction and maintenance activities. As Jordan continues to invest in its urban infrastructure, the need for reliable utility mapping is more critical than ever.
Advanced geospatial technologies are reshaping how utilities are mapped and managed. With increasing complexities in urban landscapes, the demand for precise and integrated mapping solutions is rising. Stakeholders are recognizing the importance of collaboration and advanced surveying technologies to enhance accuracy and data sharing.
Jordan Underground Utility Mapping Market Year-wise Growth Rate and Key Drivers
This graph illustrates the annual growth rates of the Jordan Underground Utility Mapping Market from 2021 to 2032, highlighting a steady upward trajectory and projected expansion over the forecast period.
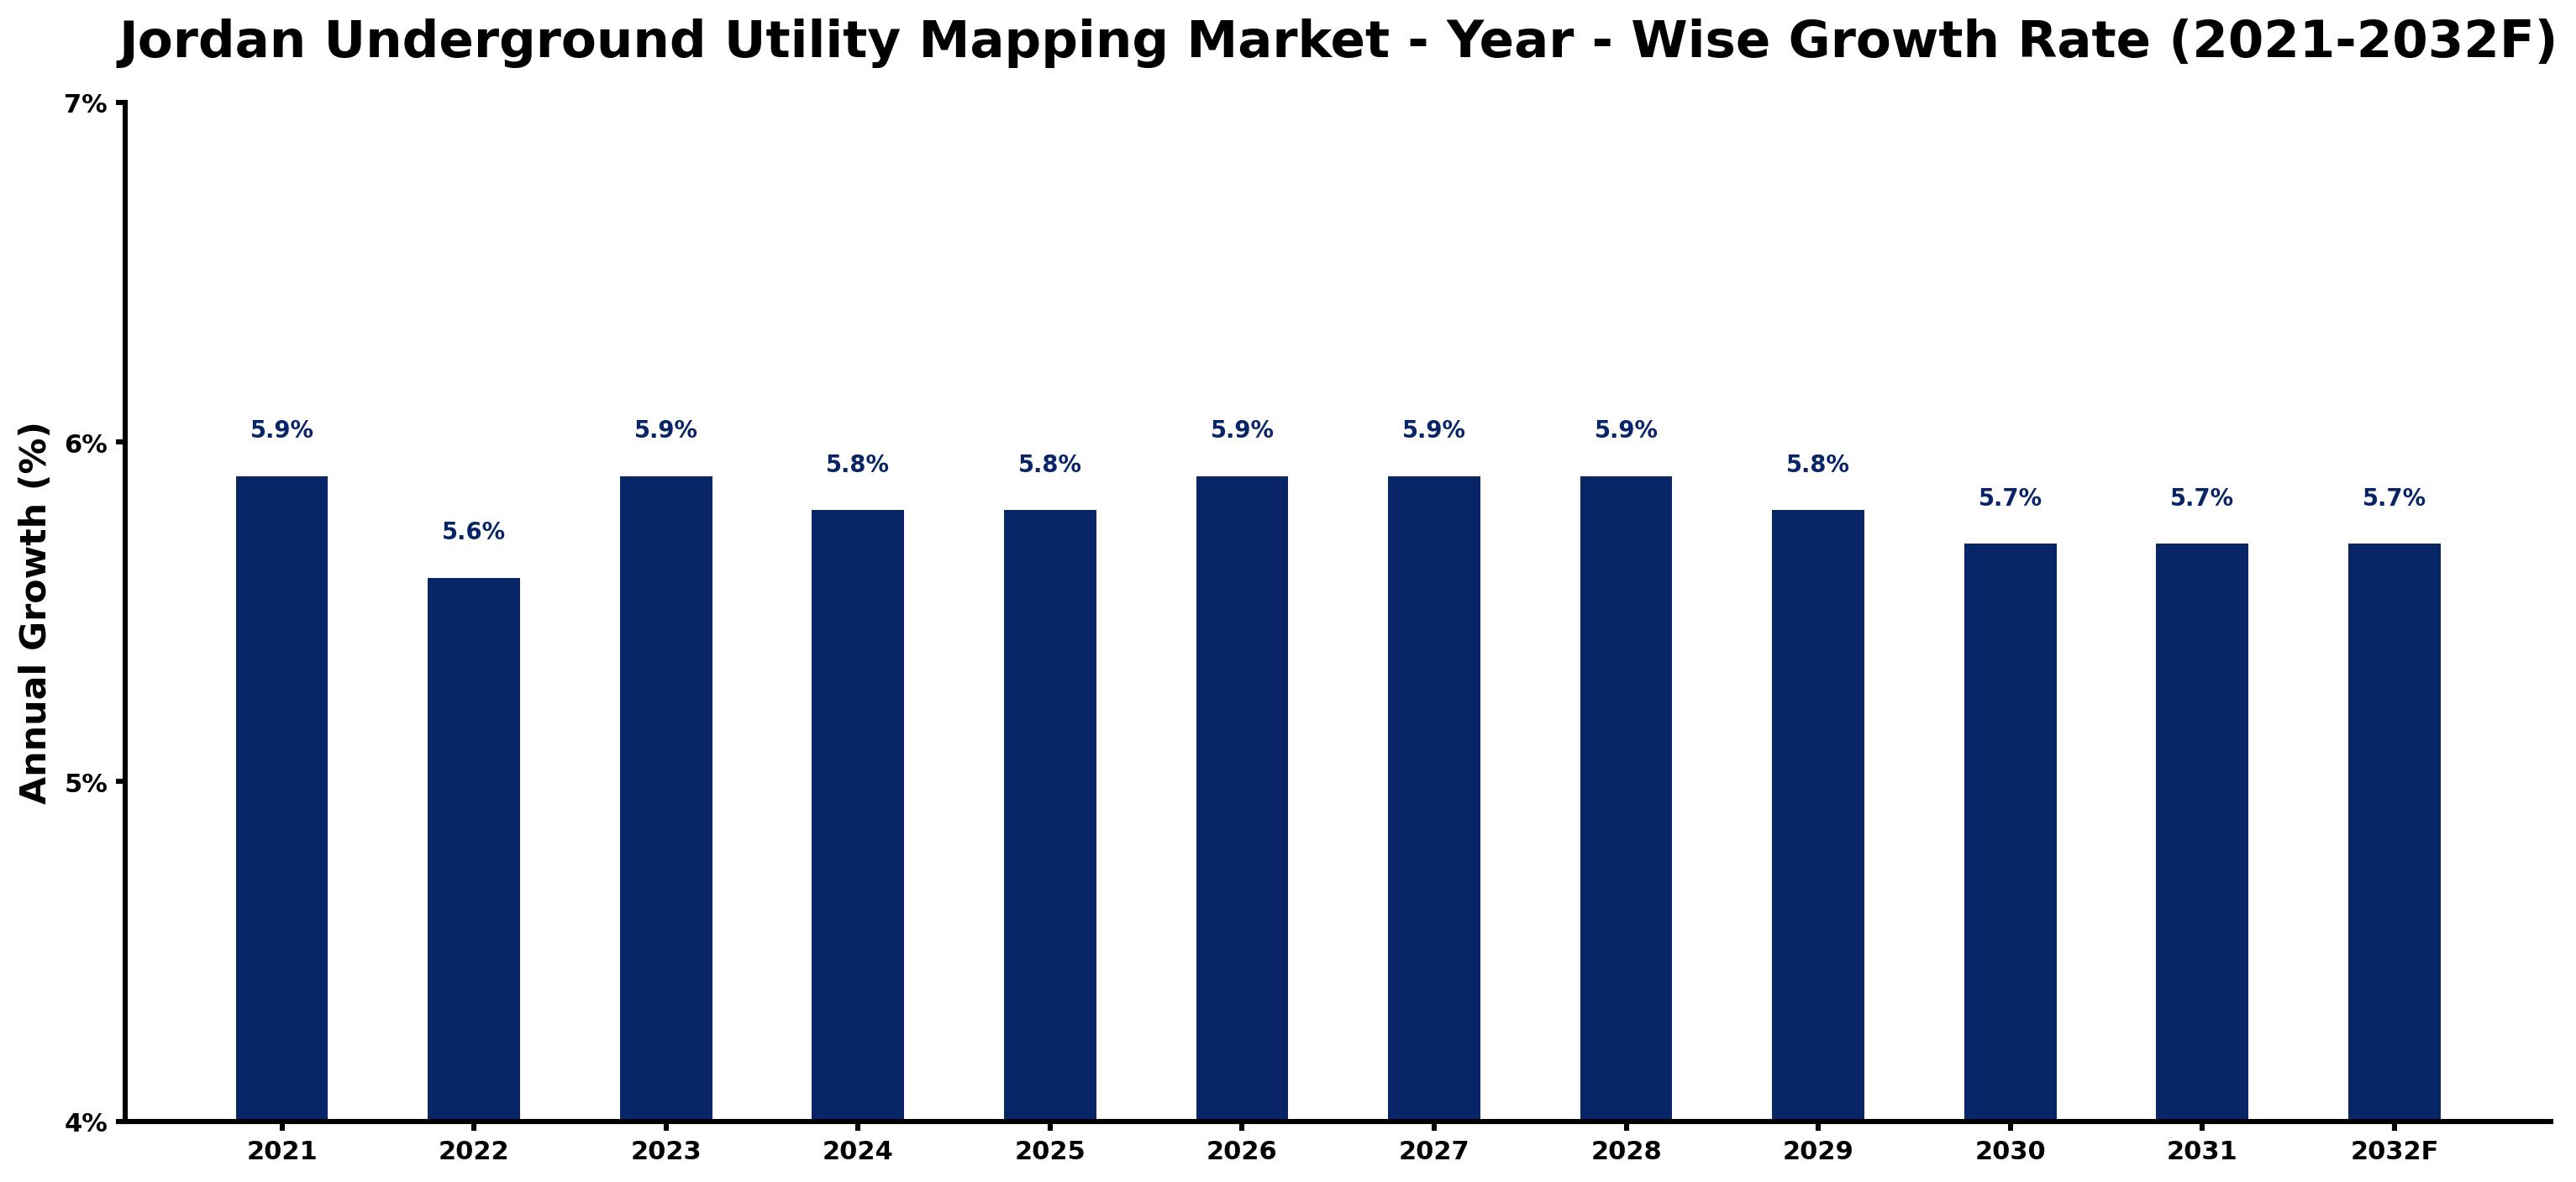
The table below presents the year‑wise growth rates along with the key drivers influencing the market
| Year | Growth Rate | Major Drivers |
| 2021 | 5.9% | Increased infrastructure development by the Jordanian government. |
| 2022 | 5.6% | Implementation of strict utility mapping regulations by MWI. |
| 2023 | 5.9% | Rising urbanization driving demand for accurate utility data. |
| 2024 | 5.8% | Adoption of GIS technology in local municipal planning. |
| 2025 | 5.8% | Enhanced public safety initiatives requiring precise underground mapping. |
| 2026 | 5.9% | Collaboration with international firms improving mapping technologies. |
| 2027 | 5.9% | Growing awareness of utility maintenance among local contractors. |
| 2028 | 5.9% | Investment in sustainable construction practices enhancing necessity. |
| 2029 | 5.8% | Your country's contribution to regional infrastructure projects increasing. |
| 2030 | 5.7% | Proliferation of smart city initiatives in urban areas. |
| 2031 | 5.7% | Local universities promoting underground mapping studies and practices. |
| 2032 | 5.7% | Government incentives for digitizing infrastructure mapping processes. |
Note: Market size estimations and growth projections presented in this report are based on 6Wresearch's proprietary forecasting methodology, utilizing the latest available industry data, government publications, and primary research inputs.
Jordan Underground Utility Mapping Market Key Takeaways
Below are some of the specific key takeaways from the market, including:
- The market is primarily driven by urban development and the necessity for accurate utility mapping.
- Technological advancements are significantly influencing mapping techniques and stakeholder collaboration.
- Government policies are actively shaping the regulatory framework for utility mapping initiatives.
- Challenges in data integration and accuracy remain critical issues affecting market adoption.
- Investment opportunities lie in emerging technologies and strategic partnerships for utility mapping solutions.
Evaluation of Restraints in Jordan Underground Utility Mapping Market
The Jordan underground utility mapping market faces notable restraints that hinder its growth potential. One major challenge is the accuracy of mapping, which is crucial for preventing accidents during construction. Many existing technologies struggle to deliver the necessary precision, leading to potential disruptions. Additionally, the lack of standardized data sharing protocols among stakeholders complicates the integration of information, making it difficult for companies to adopt comprehensive mapping solutions. This fragmentation can deter investments and slow the pace of technological advancement.
Jordan Underground Utility Mapping Market Trends
Current trends highlight an increasing reliance on advanced geospatial technologies, such as 3D mapping and GIS solutions. These tools are enhancing the accuracy of underground utility mapping, enabling better planning and execution of infrastructure projects. There is also a growing emphasis on collaboration among government agencies, utility providers, and construction firms, aiming for improved data sharing and project efficiency. on top of that, the integration of AI and machine learning into mapping solutions is beginning to reshape the methodologies used, making them more efficient and effective.
Jordan Underground Utility Mapping Market Opportunities
Significant growth opportunities exist in the Jordan underground utility mapping market as the demand for accurate and reliable mapping solutions increases. The government’s focus on infrastructure projects, combined with urbanization trends, presents a fertile ground for investment. Companies can capitalize on the demand for advanced technologies, such as AI-driven analytics, which can enhance mapping accuracy and efficiency. Additionally, forming strategic partnerships with governmental and private sectors can unlock new avenues for market penetration and expansion.
Government Initiatives in the Jordan Underground Utility Mapping Market
Government policies are playing a crucial role in shaping the Jordan underground utility mapping market. Authorities are increasingly mandating utility mapping surveys for new construction projects to safeguard existing infrastructure. This regulatory push is not only essential for public safety but also enhances the effectiveness of urban planning efforts. As the government prioritizes collaboration between stakeholders, these policies are set to improve the overall accuracy and reliability of utility mapping in Jordan.
- A recent initiative requiring utility companies to conduct comprehensive mapping surveys for all new construction projects was launched in early 2025.
- Currently, a public-private partnership is underway, focused on developing advanced mapping technologies to improve accuracy and data integration.
- A planned regulatory framework expected to be introduced in 2026 will establish data standards for utility mapping.
- Efforts are ongoing to promote collaboration between government agencies and utility providers to enhance mapping processes.
- A national digital infrastructure upgrade programme is expected to be rolled out in 2027, which will include initiatives for improved underground utility mapping.
Future Insights of the Jordan Underground Utility Mapping Market
Looking ahead to 2026-2032, the Jordan underground utility mapping market is anticipated to continue its upward trajectory. As urban areas expand and infrastructure projects increase, the demand for precise mapping solutions will intensify. Adoption of cutting-edge technologies will likely become more prevalent, addressing current accuracy and integration challenges. Stakeholders who embrace collaboration and invest in innovative solutions will position themselves for success in a rapidly evolving market.
Jordan Underground Utility Mapping Market Latest Developments
In the past year, the Jordan underground utility mapping market has seen significant developments that reflect its growth and technological advancement. Stakeholders are increasingly focused on enhancing mapping accuracy and efficiency through new technologies and collaborations. The regulatory environment is also evolving, promoting a more structured approach to underground utility management.
- A leading technology vendor began a pilot project in late 2023 to implement AI-enhanced mapping tools across several urban development sites.
- In Q1 2024, a major utility provider launched an initiative aimed at integrating real-time data sharing with construction firms to streamline project execution.
- By mid-2024, a public-private partnership is expected to kick off, focusing on developing a unified data standard for underground utilities.
- An ongoing project started in early 2024 aims to upgrade existing mapping technologies for better accuracy and integration.
- A rollout of a new national mapping initiative is planned for late 2024, aimed at improving public safety and urban planning.
Jordan Underground Utility Mapping Market - Key Attractiveness of the Report
- 10 Years of Market Numbers
- Historical Data Starting from 2022 to 2025
- Base Year: 2025
- Forecast Data until 2032
- Key Performance Indicators Impacting the Market
- Major Upcoming Developments and Projects
Key Highlights of the Report:
- Jordan Underground Utility Mapping Market Outlook
- Market Size of Jordan Underground Utility Mapping Market, 2025
- Forecast of Jordan Underground Utility Mapping Market, 2032
- Historical Data and Forecast of Jordan Underground Utility Mapping Revenues & Volume for the Period 2022-2032F
- Jordan Underground Utility Mapping Market Trend Evolution
- Jordan Underground Utility Mapping Market Drivers and Challenges
- Jordan Underground Utility Mapping Price Trends
- Jordan Underground Utility Mapping Porter's Five Forces
- Jordan Underground Utility Mapping Industry Life Cycle
- Historical Data and Forecast of Jordan Underground Utility Mapping Market Revenues & Volume By Component for the Period 2022-2032F
- Historical Data and Forecast of Jordan Underground Utility Mapping Market Revenues & Volume By Technological Solutions for the Period 2022-2032F
- Historical Data and Forecast of Jordan Underground Utility Mapping Market Revenues & Volume By Services for the Period 2022-2032F
- Historical Data and Forecast of Jordan Underground Utility Mapping Market Revenues & Volume By Vertical for the Period 2022-2032F
- Historical Data and Forecast of Jordan Underground Utility Mapping Market Revenues & Volume By Oil & Gas for the Period 2022-2032F
- Historical Data and Forecast of Jordan Underground Utility Mapping Market Revenues & Volume By Electricity for the Period 2022-2032F
- Historical Data and Forecast of Jordan Underground Utility Mapping Market Revenues & Volume By Government & Public Safety for the Period 2022-2032F
- Historical Data and Forecast of Jordan Underground Utility Mapping Market Revenues & Volume By Construction for the Period 2022-2032F
- Historical Data and Forecast of Jordan Underground Utility Mapping Market Revenues & Volume By Telecommunication for the Period 2022-2032F
- Historical Data and Forecast of Jordan Underground Utility Mapping Market Revenues & Volume By Others for the Period 2022-2032F
- Jordan Underground Utility Mapping Import Export Trade Statistics
- Market Opportunity Assessment By Component
- Market Opportunity Assessment By Vertical
- Jordan Underground Utility Mapping Top Companies Market Share
- Jordan Underground Utility Mapping Competitive Benchmarking By Technical and Operational Parameters
- Jordan Underground Utility Mapping Company Profiles
- Jordan Underground Utility Mapping Key Strategic Recommendations