Kenya Activated Carbon Market Outlook | Size, Analysis, Forecast, Industry, Share, Trends, Revenue, Value, COVID-19 IMPACT, Companies & Growth
Market Forecast By Product (Powdered, Granular, Others), By Application (Liquid Phase, Gas Phase), By End-use (Water Treatment, Food & Beverage Processing, Pharmaceutical & Medical, Automotive, Air Purification, Others) And Competitive Landscape
| Product Code: ETC082629 | Publication Date: Jun 2021 | Updated Date: Jun 2025 | Product Type: Report | |
| Publisher: 6Wresearch | Author: Bhawna Singh | No. of Pages: 70 | No. of Figures: 35 | No. of Tables: 5 |
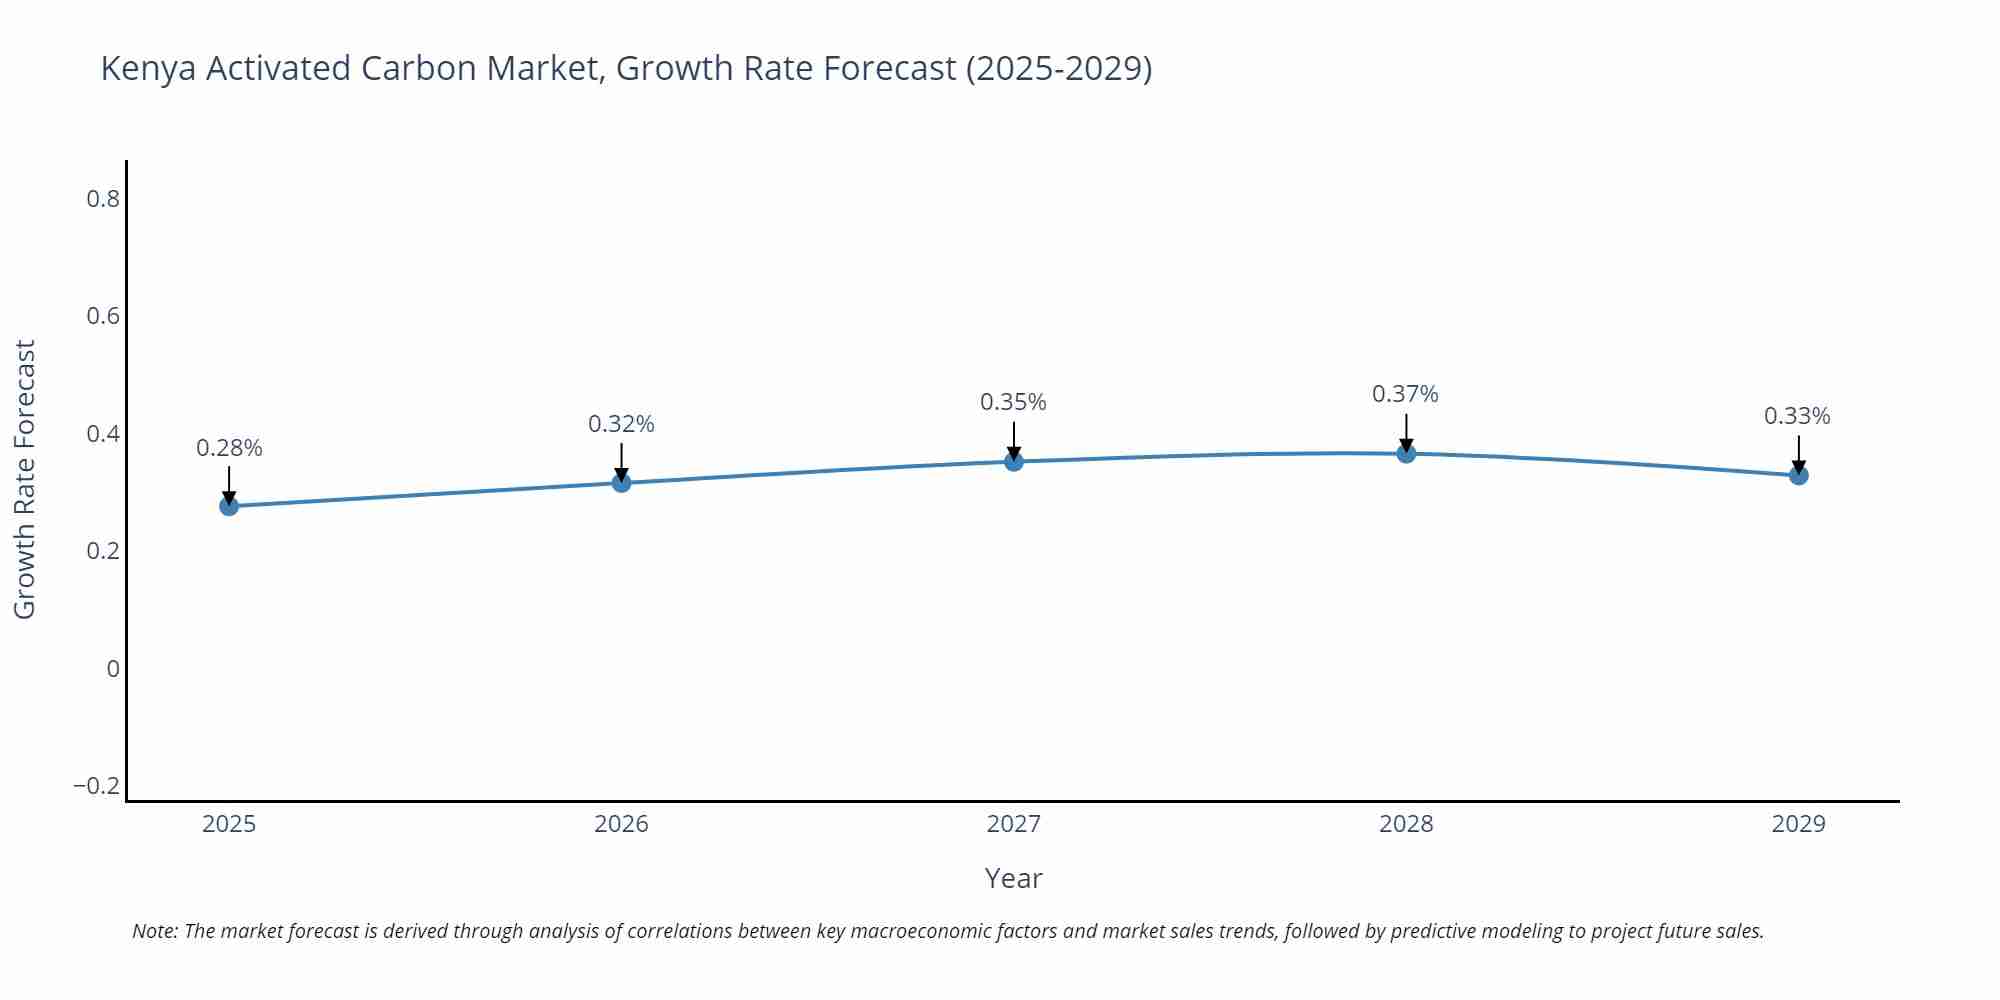
Kenya Activated Carbon Market Size Growth Rate
The Kenya Activated Carbon Market is projected to witness mixed growth rate patterns during 2025 to 2029. Starting at 0.28% in 2025, the market peaks at 0.37% in 2028, and settles at 0.33% by 2029.
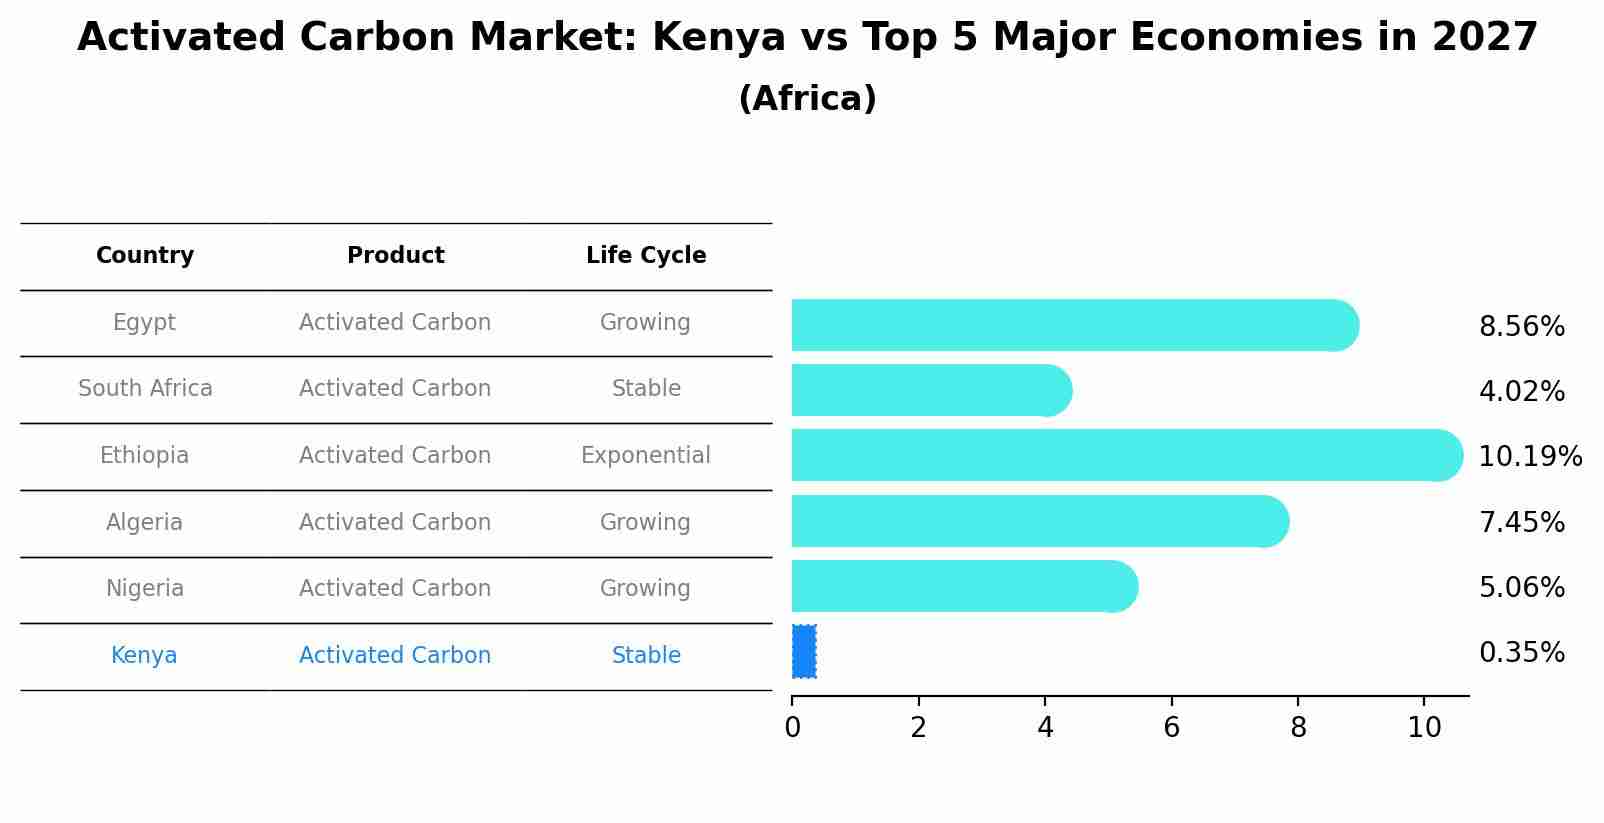
Activated Carbon Market: Kenya vs Top 5 Major Economies in 2027 (Africa)
By 2027, the Activated Carbon market in Kenya is anticipated to reach a growth rate of 0.35%, as part of an increasingly competitive Africa region, where Egypt remains at the forefront, supported by South Africa, Ethiopia, Algeria and Nigeria, driving innovations and market adoption across sectors.
Kenya Activated Carbon Market Overview
The Kenya activated carbon market is experiencing steady growth driven by increasing industrial applications such as water purification, air filtration, and food and beverage processing. The demand is also bolstered by the country`s efforts to address environmental challenges like water contamination and air pollution. Key players in the market are focusing on developing sustainable and high-quality activated carbon products to meet the stringent regulations and standards set by the government and international bodies. The market is characterized by both domestic producers and international suppliers catering to diverse industries. As Kenya continues to prioritize environmental conservation and sustainability, the activated carbon market is expected to expand further, with a growing emphasis on innovative solutions and technological advancements to meet the evolving needs of the market.
Kenya Activated Carbon Market Trends
The Kenya activated carbon market is experiencing growth driven by increasing awareness of environmental pollution and the need for water and air purification solutions. The demand for activated carbon is rising in industries such as water treatment, food and beverage, pharmaceuticals, and automotive due to its excellent adsorption properties. The market is also witnessing a shift towards sustainable and renewable sources of activated carbon, with an emphasis on eco-friendly manufacturing processes. Key trends include the adoption of coconut shell-based activated carbon, the increasing use of activated carbon in gas phase applications, and the emergence of innovative technologies for enhancing the performance of activated carbon products. Overall, the Kenya activated carbon market is poised for continued expansion as industries prioritize environmental sustainability and regulatory compliance.
Kenya Activated Carbon Market Challenges
In the Kenya Activated Carbon Market, some of the key challenges include limited awareness and understanding of the benefits of activated carbon among potential end-users, which hinders market growth. Additionally, there is a lack of standardized quality control measures and testing facilities, leading to concerns about the consistency and reliability of activated carbon products available in the market. Furthermore, competition from cheaper alternatives and imported products poses a threat to local activated carbon manufacturers. Finally, inadequate infrastructure and logistical challenges in terms of transportation and storage also impact the efficiency of the supply chain in the activated carbon market in Kenya. Addressing these challenges will be crucial for the sustainable growth and development of the activated carbon market in the country.
Kenya Activated Carbon Market Investment Opportunities
The Kenya Activated Carbon Market presents promising investment opportunities due to the growing demand for activated carbon across various industries such as water treatment, air purification, and food and beverage processing. The increasing awareness of environmental pollution and the need for clean water and air have driven the demand for activated carbon in Kenya. Investing in companies that manufacture or distribute activated carbon products, as well as those involved in the development of innovative carbon activation technologies, could yield significant returns. Additionally, with the government`s focus on environmental regulations and sustainability, there is a favorable regulatory environment supporting the growth of the activated carbon market in Kenya, making it an attractive investment prospect for savvy investors looking to capitalize on the country`s evolving industrial landscape.
Kenya Activated Carbon Market Government Policy
The Kenyan government has implemented various policies to regulate the activated carbon market in the country. These policies include the Environmental Management and Coordination Act, which aims to ensure sustainable environmental management practices among businesses involved in activated carbon production. Additionally, the government has established the Kenya Industrial Research and Development Institute (KIRDI) to provide support and guidance to the activated carbon industry in terms of research, development, and technology transfer. Furthermore, the government has put in place measures to promote local production and value addition in the activated carbon sector to boost economic growth and create employment opportunities. Overall, these policies are geared towards enhancing environmental sustainability, promoting innovation, and driving economic development in the Kenya activated carbon market.
Kenya Activated Carbon Market Future Outlook
The future outlook for the Kenya Activated Carbon Market looks promising with steady growth projected in the coming years. The increasing awareness about environmental pollution and the need for clean water and air is expected to drive the demand for activated carbon in various industries such as water treatment, food and beverage, pharmaceuticals, and automotive. Additionally, the government`s initiatives to promote sustainable development and stringent regulations on emissions and water quality are likely to further boost the market. The growing industrialization and urbanization in Kenya are also anticipated to contribute to the market expansion. Overall, the Kenya Activated Carbon Market is poised for growth opportunities fueled by increasing environmental concerns and regulatory compliance requirements.
Key Highlights of the Report:
- Kenya Activated Carbon Market Outlook
- Market Size of Kenya Activated Carbon Market, 2021
- Forecast of Kenya Activated Carbon Market, 2027
- Historical Data and Forecast of Kenya Activated Carbon Revenues & Volume for the Period 2018 - 2027
- Kenya Activated Carbon Market Trend Evolution
- Kenya Activated Carbon Market Drivers and Challenges
- Kenya Activated Carbon Price Trends
- Kenya Activated Carbon Porter's Five Forces
- Kenya Activated Carbon Industry Life Cycle
- Historical Data and Forecast of Kenya Activated Carbon Market Revenues & Volume By Product for the Period 2018 - 2027
- Historical Data and Forecast of Kenya Activated Carbon Market Revenues & Volume By Powdered for the Period 2018 - 2027
- Historical Data and Forecast of Kenya Activated Carbon Market Revenues & Volume By Granular for the Period 2018 - 2027
- Historical Data and Forecast of Kenya Activated Carbon Market Revenues & Volume By Others for the Period 2018 - 2027
- Historical Data and Forecast of Kenya Activated Carbon Market Revenues & Volume By Application for the Period 2018 - 2027
- Historical Data and Forecast of Kenya Activated Carbon Market Revenues & Volume By Liquid Phase for the Period 2018 - 2027
- Historical Data and Forecast of Kenya Activated Carbon Market Revenues & Volume By Gas Phase for the Period 2018 - 2027
- Historical Data and Forecast of Kenya Activated Carbon Market Revenues & Volume By End-use for the Period 2018 - 2027
- Historical Data and Forecast of Kenya Activated Carbon Market Revenues & Volume By Water Treatment for the Period 2018 - 2027
- Historical Data and Forecast of Kenya Activated Carbon Market Revenues & Volume By Food & Beverage Processing for the Period 2018 - 2027
- Historical Data and Forecast of Kenya Activated Carbon Market Revenues & Volume By Pharmaceutical & Medical for the Period 2018 - 2027
- Historical Data and Forecast of Kenya Activated Carbon Market Revenues & Volume By Automotive for the Period 2018 - 2027
- Historical Data and Forecast of Kenya Activated Carbon Market Revenues & Volume By Air Purification for the Period 2018 - 2027
- Historical Data and Forecast of Kenya Activated Carbon Market Revenues & Volume By Others for the Period 2018 - 2027
- Kenya Activated Carbon Import Export Trade Statistics
- Market Opportunity Assessment By Product
- Market Opportunity Assessment By Application
- Market Opportunity Assessment By End-use
- Kenya Activated Carbon Top Companies Market Share
- Kenya Activated Carbon Competitive Benchmarking By Technical and Operational Parameters
- Kenya Activated Carbon Company Profiles
- Kenya Activated Carbon Key Strategic Recommendations
Frequently Asked Questions About the Market Study (FAQs):
6Wresearch actively monitors the Kenya Activated Carbon Market and publishes its comprehensive annual report, highlighting emerging trends, growth drivers, revenue analysis, and forecast outlook. Our insights help businesses to make data-backed strategic decisions with ongoing market dynamics. Our analysts track relevent industries related to the Kenya Activated Carbon Market, allowing our clients with actionable intelligence and reliable forecasts tailored to emerging regional needs.
Yes, we provide customisation as per your requirements. To learn more, feel free to contact us on sales@6wresearch.com
1 Executive Summary |
2 Introduction |
2.1 Key Highlights of the Report |
2.2 Report Description |
2.3 Market Scope & Segmentation |
2.4 Research Methodology |
2.5 Assumptions |
3 Kenya Activated Carbon Market Overview |
3.1 Kenya Country Macro Economic Indicators |
3.2 Kenya Activated Carbon Market Revenues & Volume, 2021 & 2027F |
3.3 Kenya Activated Carbon Market - Industry Life Cycle |
3.4 Kenya Activated Carbon Market - Porter's Five Forces |
3.5 Kenya Activated Carbon Market Revenues & Volume Share, By Product, 2021 & 2027F |
3.6 Kenya Activated Carbon Market Revenues & Volume Share, By Application, 2021 & 2027F |
3.7 Kenya Activated Carbon Market Revenues & Volume Share, By End-use, 2021 & 2027F |
4 Kenya Activated Carbon Market Dynamics |
4.1 Impact Analysis |
4.2 Market Drivers |
4.3 Market Restraints |
5 Kenya Activated Carbon Market Trends |
6 Kenya Activated Carbon Market, By Types |
6.1 Kenya Activated Carbon Market, By Product |
6.1.1 Overview and Analysis |
6.1.2 Kenya Activated Carbon Market Revenues & Volume, By Product, 2018 - 2027F |
6.1.3 Kenya Activated Carbon Market Revenues & Volume, By Powdered, 2018 - 2027F |
6.1.4 Kenya Activated Carbon Market Revenues & Volume, By Granular, 2018 - 2027F |
6.1.5 Kenya Activated Carbon Market Revenues & Volume, By Others, 2018 - 2027F |
6.2 Kenya Activated Carbon Market, By Application |
6.2.1 Overview and Analysis |
6.2.2 Kenya Activated Carbon Market Revenues & Volume, By Liquid Phase, 2018 - 2027F |
6.2.3 Kenya Activated Carbon Market Revenues & Volume, By Gas Phase, 2018 - 2027F |
6.3 Kenya Activated Carbon Market, By End-use |
6.3.1 Overview and Analysis |
6.3.2 Kenya Activated Carbon Market Revenues & Volume, By Water Treatment, 2018 - 2027F |
6.3.3 Kenya Activated Carbon Market Revenues & Volume, By Food & Beverage Processing, 2018 - 2027F |
6.3.4 Kenya Activated Carbon Market Revenues & Volume, By Pharmaceutical & Medical, 2018 - 2027F |
6.3.5 Kenya Activated Carbon Market Revenues & Volume, By Automotive, 2018 - 2027F |
6.3.6 Kenya Activated Carbon Market Revenues & Volume, By Air Purification, 2018 - 2027F |
6.3.7 Kenya Activated Carbon Market Revenues & Volume, By Others, 2018 - 2027F |
7 Kenya Activated Carbon Market Import-Export Trade Statistics |
7.1 Kenya Activated Carbon Market Export to Major Countries |
7.2 Kenya Activated Carbon Market Imports from Major Countries |
8 Kenya Activated Carbon Market Key Performance Indicators |
9 Kenya Activated Carbon Market - Opportunity Assessment |
9.1 Kenya Activated Carbon Market Opportunity Assessment, By Product, 2021 & 2027F |
9.2 Kenya Activated Carbon Market Opportunity Assessment, By Application, 2021 & 2027F |
9.3 Kenya Activated Carbon Market Opportunity Assessment, By End-use, 2021 & 2027F |
10 Kenya Activated Carbon Market - Competitive Landscape |
10.1 Kenya Activated Carbon Market Revenue Share, By Companies, 2021 |
10.2 Kenya Activated Carbon Market Competitive Benchmarking, By Operating and Technical Parameters |
11 Company Profiles |
12 Recommendations |
13 Disclaimer |
Export potential assessment - trade Analytics for 2030
Export potential enables firms to identify high-growth global markets with greater confidence by combining advanced trade intelligence with a structured quantitative methodology. The framework analyzes emerging demand trends and country-level import patterns while integrating macroeconomic and trade datasets such as GDP and population forecasts, bilateral import–export flows, tariff structures, elasticity differentials between developed and developing economies, geographic distance, and import demand projections. Using weighted trade values from 2020–2024 as the base period to project country-to-country export potential for 2030, these inputs are operationalized through calculated drivers such as gravity model parameters, tariff impact factors, and projected GDP per-capita growth. Through an analysis of hidden potentials, demand hotspots, and market conditions that are most favorable to success, this method enables firms to focus on target countries, maximize returns, and global expansion with data, backed by accuracy.
By factoring in the projected importer demand gap that is currently unmet and could be potential opportunity, it identifies the potential for the Exporter (Country) among 190 countries, against the general trade analysis, which identifies the biggest importer or exporter.
To discover high-growth global markets and optimize your business strategy:
Click Here
Pricing
- Single User License$ 1,995
- Department License$ 2,400
- Site License$ 3,120
- Global License$ 3,795

Search
Thought Leadership and Analyst Meet


Our Clients
Latest Reports
- Taiwan Food Delivery Platform Market (2026-2032) | Companies, Outlook, Analysis, Trends, Value, Revenue, Segmentation, Share, Forecast, Competitive Landscape, Growth, Size & Forecast
- United Kingdom (UK) Long-term Care Insurance Market (2026-2032) | Growth, Share, Consumer Insights, Drivers, Opportunities, Competition, Pricing Analysis, Segments, Restraints, Companies, Competitive, Value, Outlook, Size, Demand, Analysis, Challenges, Strategic Insights, Investment Trends, Revenue, Trends, Supply, Forecast
- United Kingdom (UK) Long Term Care Market (2026-2032) | Companies, Outlook, Analysis, Trends, Value, Revenue, Segmentation, Share, Forecast, Competitive Landscape, Growth, Size & Forecast
- Iraq Insulation and Waterproofing Market (2026-2032) | Outlook, Drivers, Growth, Size, Share, Industry, Revenue, Trends, Demand, Competitive, Strategic Insights, Opportunities, Segments, Companies, Challenges, Strategy, Consumer Insights, Analysis, Investment Trends, Value, Segmentation, Forecast, Restraints
- India Switchgear Market Outlook (2026-2032) | Size, Share, Trends, Growth, Revenue, Forecast, Analysis, Value, Outlook
- Pakistan Contraceptive Implants Market (2025-2031) | Demand, Growth, Size, Share, Industry, Pricing Analysis, Competitive, Strategic Insights, Strategy, Consumer Insights, Analysis, Investment Trends, Opportunities, Revenue, Segments, Value, Segmentation, Supply, Forecast, Restraints, Outlook, Competition, Drivers, Trends, Companies, Challenges
- Sri Lanka Packaging Market (2026-2032) | Outlook, Competition, Drivers, Trends, Demand, Pricing Analysis, Competitive, Strategic Insights, Companies, Challenges, Strategy, Consumer Insights, Analysis, Investment Trends, Opportunities, Growth, Size, Share, Industry, Revenue, Segments, Value, Segmentation, Supply, Forecast, Restraints
- India Kids Watches Market (2026-2032) | Strategy, Consumer Insights, Analysis, Investment Trends, Opportunities, Growth, Size, Share, Industry, Revenue, Segments, Value, Segmentation, Supply, Forecast, Restraints, Outlook, Competition, Drivers, Trends, Demand, Pricing Analysis, Competitive, Strategic Insights, Companies, Challenges
- Saudi Arabia Core Assurance Service Market (2025-2031) | Strategy, Consumer Insights, Analysis, Investment Trends, Opportunities, Growth, Size, Share, Industry, Revenue, Segments, Value, Segmentation, Supply, Forecast, Restraints, Outlook, Competition, Drivers, Trends, Demand, Pricing Analysis, Competitive, Strategic Insights, Companies, Challenges
- Romania Uninterruptible Power Supply (UPS) Market (2026-2032) | Industry, Analysis, Revenue, Size, Forecast, Outlook, Value, Trends, Share, Growth & Companies
Industry Events and Analyst Meet

India EV Show 2026

EV tech India Expo 2026

Auto Tech Asia 2026

Battery Tech India 2026

Smart Production Solutions Guangzhou 2026
Whitepaper
- Middle East & Africa Commercial Security Market Click here to view more.
- Middle East & Africa Fire Safety Systems & Equipment Market Click here to view more.
- GCC Drone Market Click here to view more.
- Middle East Lighting Fixture Market Click here to view more.
- GCC Physical & Perimeter Security Market Click here to view more.
6WResearch In News
- Doha a strategic location for EV manufacturing hub: IPA Qatar
- Demand for luxury TVs surging in the GCC, says Samsung
- Empowering Growth: The Thriving Journey of Bangladesh’s Cable Industry
- Demand for luxury TVs surging in the GCC, says Samsung
- Video call with a traditional healer? Once unthinkable, it’s now common in South Africa
- Intelligent Buildings To Smooth GCC’s Path To Net Zero