Kenya Antimony Market (2026-2032) Outlook | Forecast, Value, Analysis, Growth, Companies, Revenue, Industry, Share, Trends & Size
Market Forecast By Type (Metal Ingot, Antimony Trioxide, Antimony Pentoxide, Alloys, Other), By Application (Flame Retardant, Lead Acid Batteries, Alloy Strengthening Agent, Fiberglass Composites, Catalyst, Other) And Competitive Landscape
| Product Code: ETC087069 | Publication Date: Jun 2021 | Updated Date: Jun 2026 | Product Type: Report | |
| Publisher: 6Wresearch | Author: Shubham Padhi | No. of Pages: 70 | No. of Figures: 35 | No. of Tables: 5 |
Kenya Antimony Market Size, Share & Growth Rate
The Kenya Antimony Market was estimated at USD 1497 Million in 2025 and is projected to reach USD 2164 Million by 2032, growing at a CAGR of 5.4% from 2026 to 2032. This upward trajectory is largely driven by increasing demand from sectors like electronics, automotive, and construction, where antimony's role as a vital flame retardant is becoming increasingly crucial. As domestic production capabilities expand and the interest in sustainable mining practices grows, this market is poised for notable development.
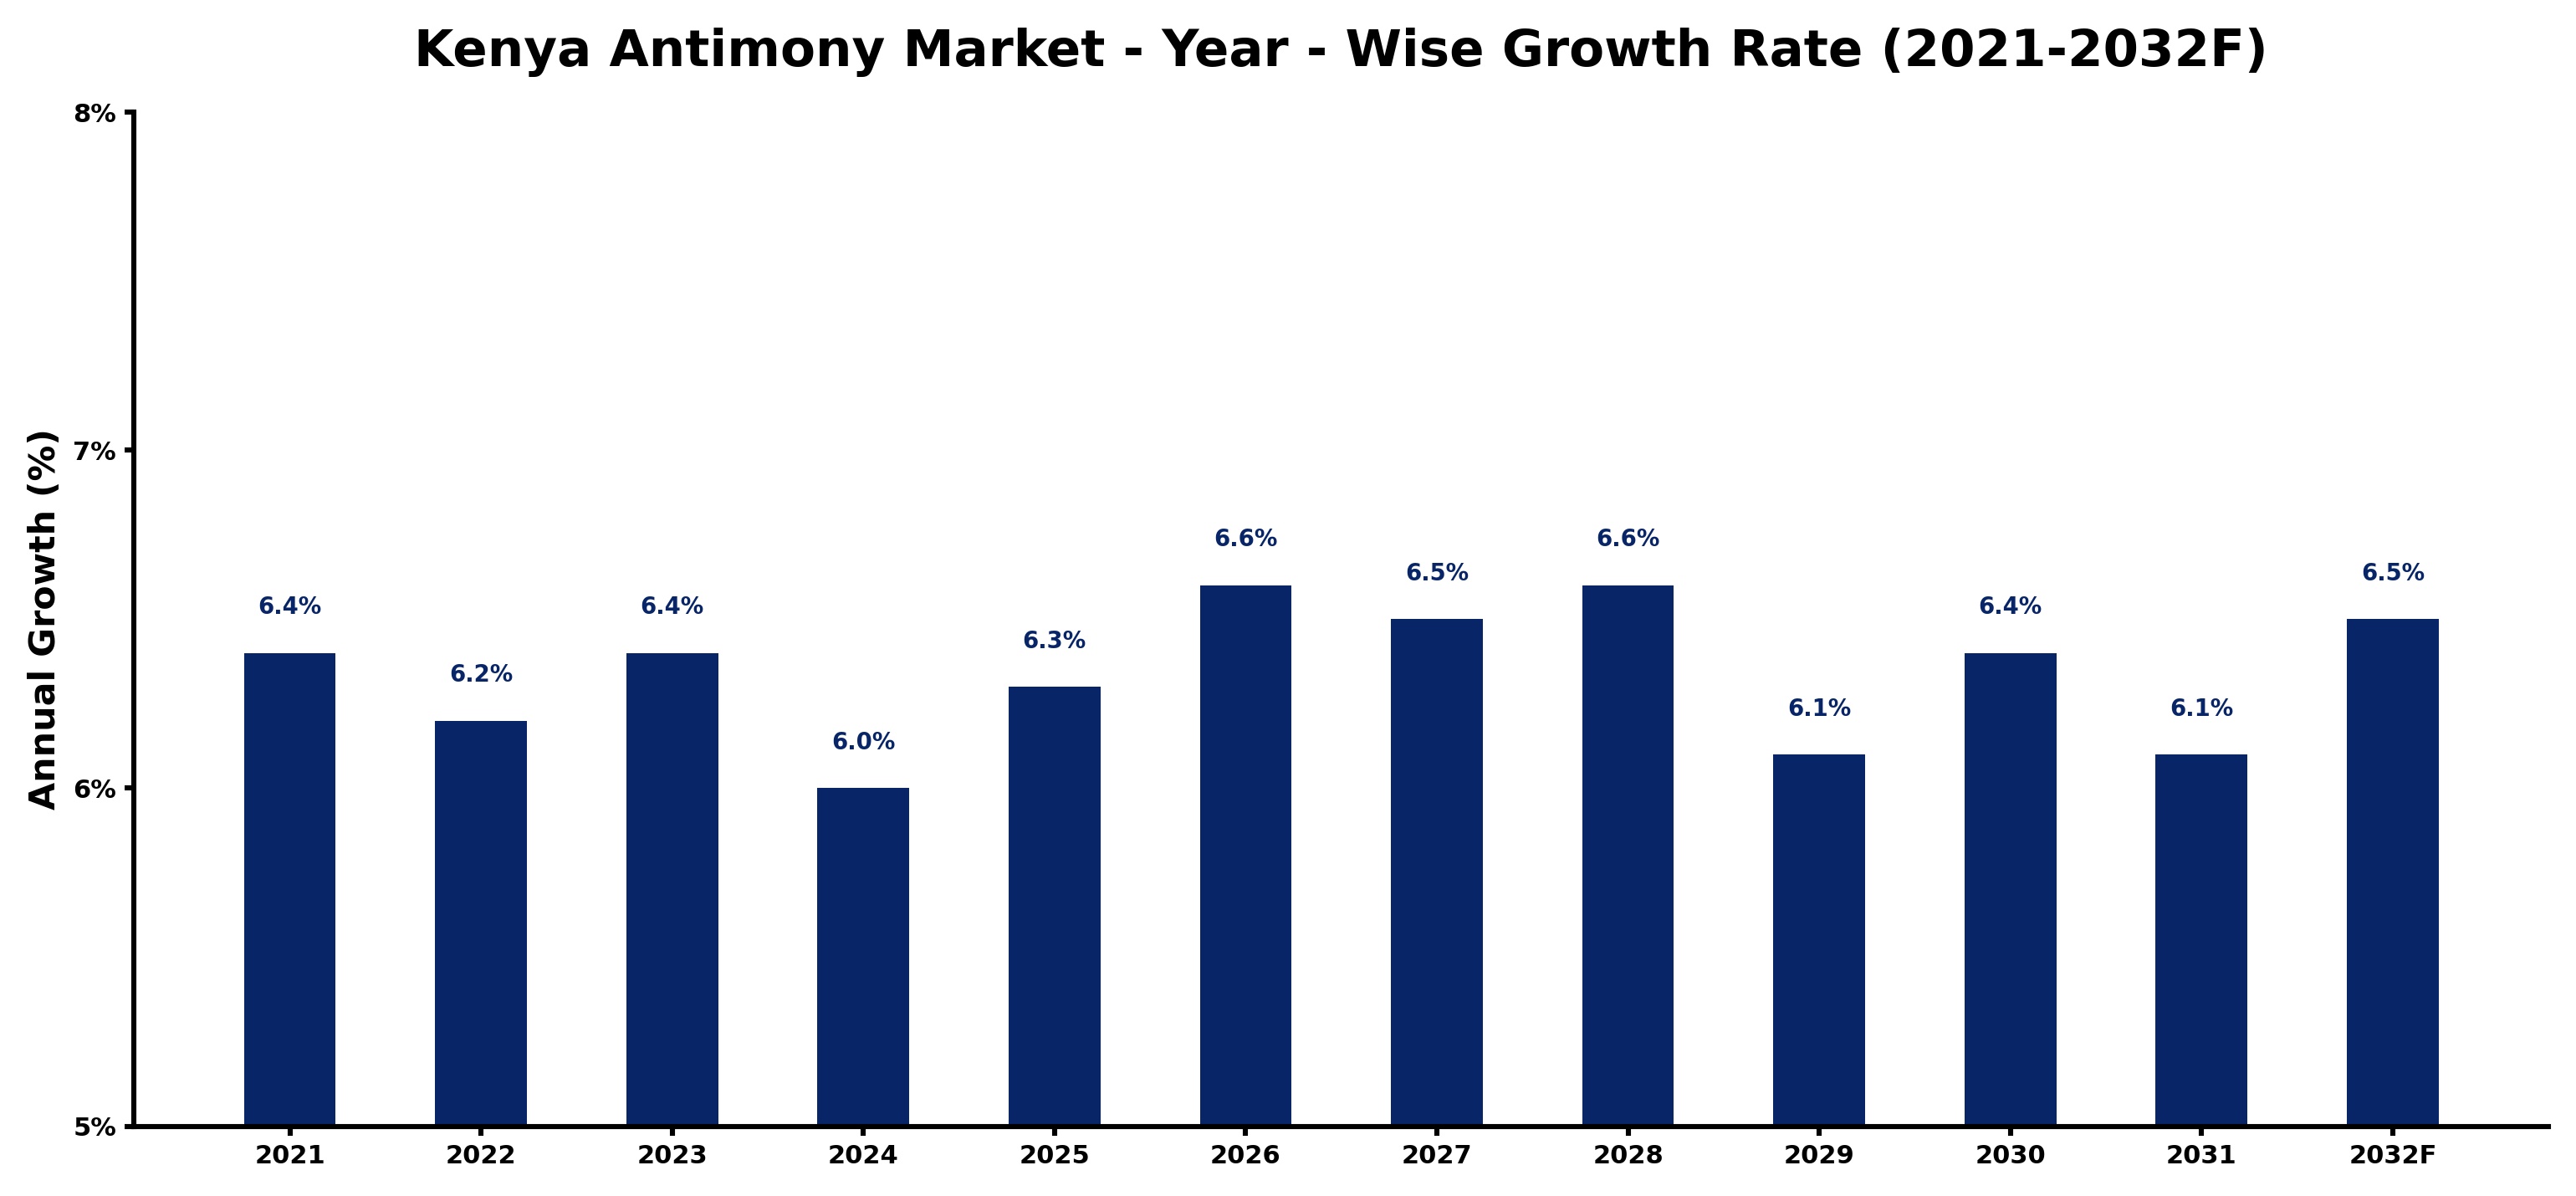
Kenya Antimony Market Growth Rate Analysis (2021-2032)
The Kenya antimony market has exhibited stable growth, recording a 6.4% increase in 2021, followed by slight fluctuations with growth rates of 6.2% in 2022 and 6.4% in 2023. This growth is primarily driven by rising demands in the electronics and automotive sectors, as manufacturers increasingly rely on antimony as a flame retardant. However, a small dip to 6.0% is anticipated in 2024, likely due to temporary market adjustments and global supply chain challenges. As we look toward 2025 and beyond, growth is projected to rebound, with rates climbing to 6.6% by 2026, reflecting increased investments in sustainable mining practices and advancements in processing technologies, coupled with a strengthening focus on energy transition initiatives across the region.
Kenya Antimony Market Year-wise Growth Rate and Key Drivers
This graph highlights how the Kenya Antimony Market has steadily grown over the past five years, supported by major growth factors.
The table below presents the year‑wise growth rates along with the key drivers influencing the market
| Year | Growth Rate | Major Drivers |
| 2021 | 6.4% | Government infrastructure modernization initiatives |
| 2022 | 6.2% | Increasing smart city development projects |
| 2023 | 6.4% | Expansion of commercial construction activities |
| 2024 | 6.0% | Expansion of commercial construction activities |
| 2025 | 6.3% | Government infrastructure modernization initiatives |
| 2026 | 6.6% | Expansion of manufacturing activities |
| 2027 | 6.5% | Rapid growth in telecom and data center sectors |
| 2028 | 6.6% | Increasing smart city development projects |
| 2029 | 6.1% | Increasing industrial automation investments |
| 2030 | 6.4% | Increasing smart city development projects |
| 2031 | 6.1% | Increasing adoption of advanced technologies |
| 2032 | 6.5% | Expansion of transportation and logistics networks |
Note - Market size estimations and growth projections presented in this report are based on 6Wresearch’s advanced forecasting approach, validated with industry datasets as of June 2026.
Kenya Antimony Market Synopsis
The Kenya Antimony Market is currently evolving, reflecting a blend of challenges and opportunities. With a reliance on imports to meet demand, the market is witnessing a notable push for local exploration and extraction efforts, aimed at reducing dependency on foreign suppliers.
Local mining initiatives are gaining momentum, underscoring a desire for self-sufficiency in antimony production. This evolution aligns with global trends favoring sustainable practices, which further enhances the market's appeal and growth potential.
Kenya Antimony Market Key Takeaways
- The market is expected to grow significantly due to rising demand for antimony in flame retardants and electronics.
- Domestic production is increasing, reflecting efforts to decrease import dependency.
- Regulatory frameworks are encouraging sustainable practices in mining operations.
- Investment opportunities exist in both mining and processing operations for antimony.
- Environmental considerations are influencing market dynamics and sourcing practices.
Evaluation of Restraints in Kenya Antimony Market
Despite its growth potential, the Kenya Antimony Market grapples with several restraints. The heavy reliance on imports creates vulnerabilities in the supply chain, leaving the country exposed to global fluctuations in antimony pricing and availability. Additionally, the lack of established local processing facilities limits domestic production capacity, which hinders the development of a self-sustaining industry. Regulatory challenges, including stringent environmental regulations and licensing processes, also pose significant barriers that can restrict market growth and innovation.
Kenya Antimony Market Trends
The ongoing evolution of the Kenya Antimony Market is underscored by several key trends. An increasing demand for antimony from diverse sectors such as electronics and automotive is evident, with its crucial role in flame retardants driving growth. Additionally, a shift toward sustainable mining practices is emerging as a response to environmental concerns, prompting industry players to innovate. Technological advancements in mining and processing methods are also becoming more prominent, facilitating improved efficiency and reduced environmental impact.
Kenya Antimony Market Opportunities
Investment opportunities abound within the Kenya Antimony Market, particularly as demand surges in various industrial applications. The exploration and development of local antimony deposits present a significant chance for investors looking to tap into the country's natural resources. Furthermore, as antimony gains recognition as a critical mineral globally, strategic investments in this market could yield substantial returns, especially as local production capabilities strengthen and domestic processing facilities emerge.
Government Initiatives in the Kenya Antimony Market
While there are no specific policies directed exclusively at the antimony market, the Kenyan government's overarching focus on sustainable mining practices significantly affects the industry. The Mining Act of 2016 governs the mining sector, establishing a framework for licensing and exploration that indirectly supports antimony mining activities. Furthermore, the government's commitment to environmental protection and transparency in the extractive sector aligns with international standards, promoting responsible practices across the board.
Future Insights of the Kenya Antimony Market
Looking ahead to 2026-2032, the Kenya Antimony Market is set to witness transformative changes. With strong demand projected across key industries, particularly those relying on flame retardants and battery production, the market's growth prospects remain bright. The push for sustainable practices will likely enhance antimony's appeal, positioning it as an environmentally responsible choice in manufacturing. Continuous investments in mining infrastructure and processing technology will be pivotal in shaping the industry's landscape.
Kenya Antimony Market Latest Developments (May 2025 - June 2026)
Recent developments in the Kenya Antimony Market suggest a heightened interest in local mining initiatives and sustainable sourcing practices. Companies are increasingly looking to capitalize on domestic antimony deposits, with ongoing explorations and feasibility studies indicating a commitment to enhancing local production capabilities. Additionally, there is a noticeable trend towards forming partnerships focused on technological innovation, aimed at improving processing efficiency and minimizing environmental impact.
Kenya Antimony Market - Key Attractiveness of the Report
- 10 Years of Market Numbers
- Historical Data Starting from 2022 to 2025
- Base Year: 2025
- Forecast Data until 2032
- Key Performance Indicators Impacting the Market
- Major Upcoming Developments and Projects
Key Highlights of the Report:
- Kenya Antimony Market Outlook
- Market Size of Kenya Antimony Market, 2025
- Forecast of Kenya Antimony Market, 2032
- Historical Data and Forecast of Kenya Antimony Revenues & Volume for the Period 2022-2032F
- Kenya Antimony Market Trend Evolution
- Kenya Antimony Market Drivers and Challenges
- Kenya Antimony Price Trends
- Kenya Antimony Porter's Five Forces
- Kenya Antimony Industry Life Cycle
- Historical Data and Forecast of Kenya Antimony Market Revenues & Volume By Type for the Period 2022-2032F
- Historical Data and Forecast of Kenya Antimony Market Revenues & Volume By Metal Ingot for the Period 2022-2032F
- Historical Data and Forecast of Kenya Antimony Market Revenues & Volume By Antimony Trioxide for the Period 2022-2032F
- Historical Data and Forecast of Kenya Antimony Market Revenues & Volume By Antimony Pentoxide for the Period 2022-2032F
- Historical Data and Forecast of Kenya Antimony Market Revenues & Volume By Alloys for the Period 2022-2032F
- Historical Data and Forecast of Kenya Antimony Market Revenues & Volume By Other for the Period 2022-2032F
- Historical Data and Forecast of Kenya Antimony Market Revenues & Volume By Application for the Period 2022-2032F
- Historical Data and Forecast of Kenya Antimony Market Revenues & Volume By Flame Retardant for the Period 2022-2032F
- Historical Data and Forecast of Kenya Antimony Market Revenues & Volume By Lead Acid Batteries for the Period 2022-2032F
- Historical Data and Forecast of Kenya Antimony Market Revenues & Volume By Alloy Strengthening Agent for the Period 2022-2032F
- Historical Data and Forecast of Kenya Antimony Market Revenues & Volume By Fiberglass Composites for the Period 2022-2032F
- Historical Data and Forecast of Kenya Antimony Market Revenues & Volume By Catalyst for the Period 2022-2032F
- Historical Data and Forecast of Kenya Antimony Market Revenues & Volume By Other for the Period 2022-2032F
- Kenya Antimony Import Export Trade Statistics
- Market Opportunity Assessment By Type
- Market Opportunity Assessment By Application
- Kenya Antimony Top Companies Market Share
- Kenya Antimony Competitive Benchmarking By Technical and Operational Parameters
- Kenya Antimony Company Profiles
- Kenya Antimony Key Strategic Recommendations
Kenya Antimony Market - Frequently Asked Questions
The Kenya Antimony Market is expected to grow at a CAGR of 5.4% from 2026 to 2032, with an estimated value reaching USD 2164 Million by 2032.
This dependency creates vulnerabilities in the supply chain, exposing the market to fluctuations in international prices and availability, which can hinder local industry stability.
Key applications include flame retardants in plastics and textiles, battery production, and various electronic components, making antimony critical for multiple industries.
While no specific policies target antimony, the government promotes sustainable mining through the Mining Act and aligns with international transparency standards to enhance industry practices.
Investors can capitalize on the rising demand for antimony and potential local mining operations, tapping into a growing market with strategic importance globally.
6Wresearch actively monitors the Kenya Antimony Market and publishes its comprehensive annual report, highlighting emerging trends, growth drivers, revenue analysis, and forecast outlook. Our insights help businesses to make data-backed strategic decisions with ongoing market dynamics. Our analysts track relevent industries related to the Kenya Antimony Market, allowing our clients with actionable intelligence and reliable forecasts tailored to emerging regional needs.
Yes, we provide customisation as per your requirements. To learn more, feel free to contact us on sales@6wresearch.com
1 Executive Summary |
2 Introduction |
2.1 Key Highlights of the Report |
2.2 Report Description |
2.3 Market Scope & Segmentation |
2.4 Research Methodology |
2.5 Assumptions |
3 Kenya Antimony Market Overview |
3.1 Kenya Country Macro Economic Indicators |
3.2 Kenya Antimony Market Revenues & Volume, 2022 & 2032F |
3.3 Kenya Antimony Market - Industry Life Cycle |
3.4 Kenya Antimony Market - Porter's Five Forces |
3.5 Kenya Antimony Market Revenues & Volume Share, By Type, 2022 & 2032F |
3.6 Kenya Antimony Market Revenues & Volume Share, By Form, 2022 & 2032F |
4 Kenya Antimony Market Dynamics |
4.1 Impact Analysis |
4.2 Market Drivers |
4.3 Market Restraints |
5 Kenya Antimony Market Trends |
6 Kenya Antimony Market, By Types |
6.1 Kenya Antimony Market, By Type |
6.1.1 Overview and Analysis |
6.1.2 Kenya Antimony Market Revenues & Volume, By Type, 2022-2032F |
6.1.3 Kenya Antimony Market Revenues & Volume, By Metal Ingot, 2022-2032F |
6.1.4 Kenya Antimony Market Revenues & Volume, By Antimony Trioxide, 2022-2032F |
6.1.5 Kenya Antimony Market Revenues & Volume, By Antimony Pentoxide, 2022-2032F |
6.1.6 Kenya Antimony Market Revenues & Volume, By Alloys, 2022-2032F |
6.1.7 Kenya Antimony Market Revenues & Volume, By Other, 2022-2032F |
6.2 Kenya Antimony Market, By Application |
6.2.1 Overview and Analysis |
6.2.2 Kenya Antimony Market Revenues & Volume, By Flame Retardant, 2022-2032F |
6.2.3 Kenya Antimony Market Revenues & Volume, By Lead Acid Batteries, 2022-2032F |
6.2.4 Kenya Antimony Market Revenues & Volume, By Alloy Strengthening Agent, 2022-2032F |
6.2.5 Kenya Antimony Market Revenues & Volume, By Fiberglass Composites, 2022-2032F |
6.2.6 Kenya Antimony Market Revenues & Volume, By Catalyst, 2022-2032F |
6.2.7 Kenya Antimony Market Revenues & Volume, By Other, 2022-2032F |
7 Kenya Antimony Market Import-Export Trade Statistics |
7.1 Kenya Antimony Market Export to Major Countries |
7.2 Kenya Antimony Market Imports from Major Countries |
8 Kenya Antimony Market Key Performance Indicators |
9 Kenya Antimony Market - Opportunity Assessment |
9.1 Kenya Antimony Market Opportunity Assessment, By Type, 2022 & 2032F |
9.2 Kenya Antimony Market Opportunity Assessment, By Application, 2022 & 2032F |
10 Kenya Antimony Market - Competitive Landscape |
10.1 Kenya Antimony Market Revenue Share, By Companies, 2025 |
10.2 Kenya Antimony Market Competitive Benchmarking, By Operating and Technical Parameters |
11 Company Profiles |
12 Recommendations |
13 Disclaimer |
Global Go To Market Strategy - 2030
Export potential enables firms to identify high-growth global markets with greater confidence by combining advanced trade intelligence with a structured quantitative methodology. The framework analyzes emerging demand trends and country-level import patterns while integrating macroeconomic and trade datasets such as GDP and population forecasts, bilateral import–export flows, tariff structures, elasticity differentials between developed and developing economies, geographic distance, and import demand projections. Using weighted trade values from 2020–2024 as the base period to project country-to-country export potential for 2030, these inputs are operationalized through calculated drivers such as gravity model parameters, tariff impact factors, and projected GDP per-capita growth. Through an analysis of hidden potentials, demand hotspots, and market conditions that are most favorable to success, this method enables firms to focus on target countries, maximize returns, and global expansion with data, backed by accuracy.
By factoring in the projected importer demand gap that is currently unmet and could be potential opportunity, it identifies the potential for the Exporter (Country) among 190 countries, against the general trade analysis, which identifies the biggest importer or exporter.
To discover high-growth global markets and optimize your business strategy:
Click Here
Pricing
- Single User License$ 1,995
- Department License$ 2,400
- Site License$ 3,120
- Global License$ 3,795

Leadership Perspectives from Industry Events
Search
Thought Leadership and Analyst Meet


Our Clients
6WResearch In News
- India Air Conditioner Market Set for Strong Rebound in 2026 After Weather-Led Correction and GST-Driven Recovery: 6Wresearch
- ADAS in India: How Automatic Emergency Braking, Blind Spot Detection & Driver Monitoring are Transforming Road Safety
- Doha a strategic location for EV manufacturing hub: IPA Qatar
- Demand for luxury TVs surging in the GCC, says Samsung
- Empowering Growth: The Thriving Journey of Bangladesh’s Cable Industry
- Demand for luxury TVs surging in the GCC, says Samsung
Latest Reports
- Poland Fire Protection Systems Market (2026-2032)
- Cape Verde Portable Hand-Thrown Extinguisher Market (2026-2032)
- Canada Portable Hand-Thrown Extinguisher Market (2026-2032)
- Cameroon Portable Hand-Thrown Extinguisher Market (2026-2032)
- Burundi Portable Hand-Thrown Extinguisher Market (2026-2032)
- Burkina Faso Portable Hand-Thrown Extinguisher Market (2026-2032)
- Bulgaria Portable Hand-Thrown Extinguisher Market (2026-2032)
- Brunei Portable Hand-Thrown Extinguisher Market (2026-2032)
- Botswana Portable Hand-Thrown Extinguisher Market (2026-2032)
- Bosnia and Herzegovina Portable Hand-Thrown Extinguisher Market (2026-2032)
Industry Events and Analyst Meet

HIMTEX 2026

India Refining Summit 2026

India EV Show 2026

EV tech India Expo 2026

Auto Tech Asia 2026
Whitepaper
- Middle East & Africa Commercial Security Market Click here to view more.
- Middle East & Africa Fire Safety Systems & Equipment Market Click here to view more.
- GCC Drone Market Click here to view more.
- Middle East Lighting Fixture Market Click here to view more.
- GCC Physical & Perimeter Security Market Click here to view more.