Kenya Automotive Stamping Market (2026-2032) Outlook | Trends, Analysis, Value, Industry, Forecast, Share, Growth, Size, Companies & Revenue
Market Forecast By Vehicle (Two-Wheeler, Three-Wheeler, Passenger Car, Commercial Vehicle), By Material (Steel, Aluminium, Others), By Process (Progressive Die Stamping, Tandem Stamping, Transfer Stamping), By Product (Body Stamping, BIW Parts, Chassis, Non-Body Stamping, Engine Parts, Transmission and Steering Parts, Braking and Suspension Parts, Electrical Parts) And Competitive Landscape
| Product Code: ETC431686 | Publication Date: Oct 2022 | Updated Date: Jul 2026 | Product Type: Market Research Report | |
| Publisher: 6Wresearch | Author: Dhaval Chaurasia | No. of Pages: 75 | No. of Figures: 35 | No. of Tables: 20 |
Kenya Automotive Stamping Market Size, Share & Growth Rate
The Kenya Automotive Stamping Market was estimated at USD 391 Million in 2025 and is projected to reach USD 527 Million by 2032, growing at a CAGR of 4.4% from 2026 to 2032. This growth trajectory is underpinned by an expanding automotive industry fueled by rising disposable incomes and urbanization. Furthermore, ongoing investments in advanced manufacturing technologies and local partnerships are enhancing the production capabilities for stamped components.
Kenya Automotive Stamping Market Year-wise Growth Rate and Key Drivers
This graph highlights how the Kenya Automotive Stamping Market has steadily grown over the years, supported by major growth factors.
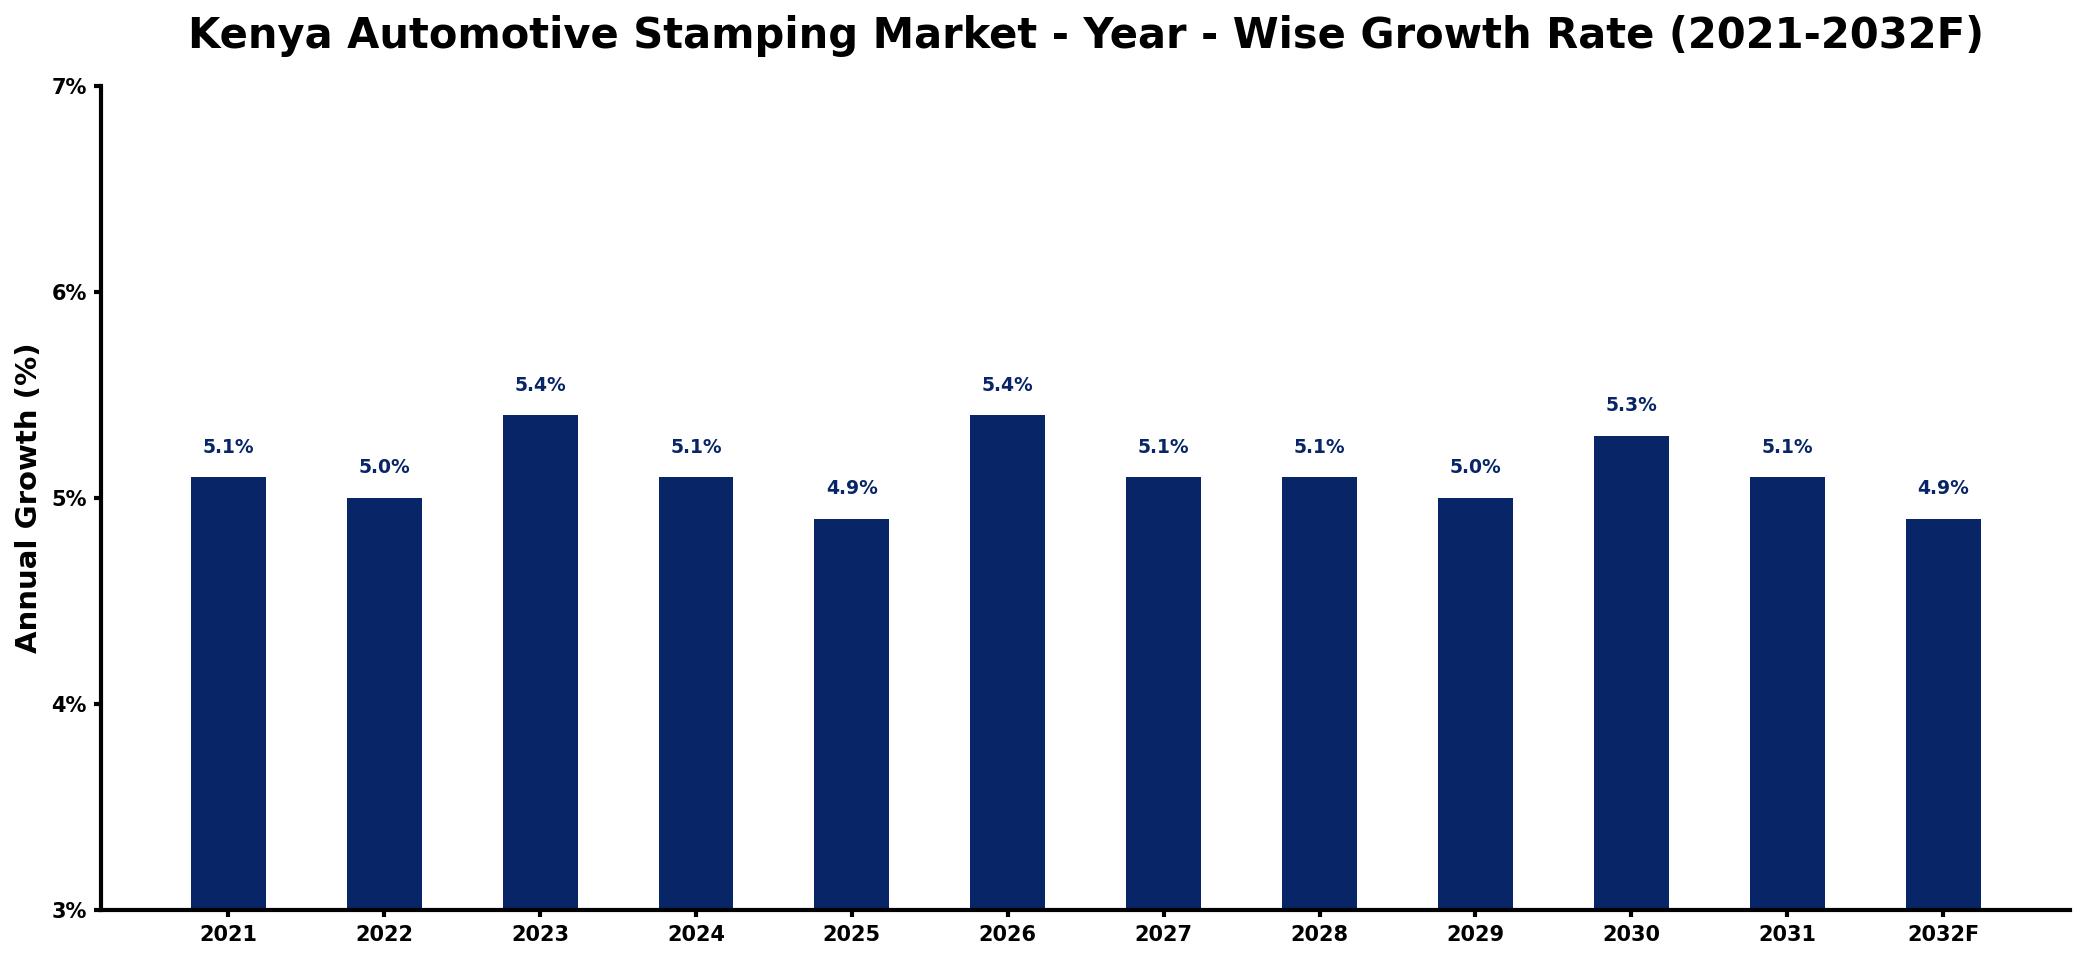
The table below presents the year‑wise growth rates along with the key drivers influencing the market
| Year | Growth Rate | Major Drivers |
| 2021 | 5.1% | Rising consumer vehicle demand |
| 2022 | 5.0% | Increased investment in infrastructure |
| 2023 | 5.4% | Growing electric vehicle adoption |
| 2024 | 5.1% | Expansion of local manufacturing capacity |
| 2025 | 4.9% | Technological advancements in production |
| 2026 | 5.4% | Strengthened trade agreements benefits |
| 2027 | 5.1% | Surge in export opportunities |
| 2028 | 5.1% | Growing urbanization and mobility needs |
| 2029 | 5.0% | Innovative design trends emerging |
| 2030 | 5.3% | Enhanced supply chain efficiencies |
| 2031 | 5.1% | Robust regulatory support initiatives |
| 2032 | 4.9% | Sustained focus on sustainability practices |
Note: Market size estimations and growth projections presented in this report are based on 6Wresearch's proprietary forecasting methodology, utilizing the latest available industry data, government publications, and primary research inputs.
Kenya Automotive Stamping Market Synopsis
The Kenya Automotive Stamping Market is witnessing significant growth, driven by an escalating demand for vehicle manufacturing within the region. Automotive stamping, essential for producing critical vehicle components like body panels and chassis parts, plays a pivotal role in meeting this growing need.
As urbanization continues and infrastructure develops, the local automotive sector is poised for advancement. Collaborations between domestic manufacturers and international stamping specialists are becoming common, indicating a collective effort to boost production efficiency and innovation in the market.
Kenya Automotive Stamping Market Key Takeaways
- The market is supported by rising disposable incomes and increased vehicle sales.
- Investment in advanced stamping technologies is enhancing production efficiency.
- There is a growing demand for lightweight materials to improve fuel efficiency.
- Collaboration between local and global manufacturers is on the rise.
- Government initiatives are designed to boost local manufacturing capabilities.
Evaluation of Restraints in Kenya Automotive Stamping Market
Despite the optimistic growth outlook, the Kenya Automotive Stamping Market faces notable constraints. Limited local manufacturing capabilities and infrastructure create a heavy dependency on imported stamped components, which can inflate costs and reduce competitiveness. Currency exchange rate fluctuations further complicate the financial landscape, while regulatory hurdles and a scarcity of skilled labor hinder operational efficiency. Addressing these challenges is vital for strengthening the local automotive stamping industry.
Kenya Automotive Stamping Market Trends
Several key trends are shaping the Kenya Automotive Stamping Market. Firstly, the shift toward lightweight materials, such as advanced high-strength steels and aluminum alloys, is prevalent as manufacturers aim to enhance fuel efficiency and decrease emissions. Additionally, there's a noticeable movement towards automation and digitalization, which boosts precision and operational efficiency in stamping operations. Sustainability is also gaining traction, with manufacturers focusing on eco-friendly materials and processes.
Kenya Automotive Stamping Market Opportunities
The Kenya Automotive Stamping Market presents a range of investment opportunities. With the local automotive sector expanding, there is an increasing demand for high-quality stamped components. Investing in cutting-edge stamping technology can position companies favorably to serve both domestic manufacturers and international firms entering the market. Moreover, a focus on sustainable practices can attract a customer base that values environmental responsibility, aligning with global automotive trends towards greener solutions.
Government Initiatives in the Kenya Automotive Stamping Market
The Kenyan government has introduced various initiatives aimed at bolstering the automotive stamping sector. Notably, the Automotive Industry Policy encourages local production of vehicles and components. Incentives such as tax breaks and reductions in import duties for manufacturers in special economic zones aim to attract investments. Additionally, the Automotive Industry Development Policy is designed to foster innovation and enhance employment opportunities within the sector, further solidifying the government's commitment to developing a competitive automotive stamping industry.
Future Insights of the Kenya Automotive Stamping Market
Looking ahead to 2026-2032, the Kenya Automotive Stamping Market is set for dynamic growth. The continuous expansion of the automotive sector will be a catalyst for increased demand for stamped components. Additionally, as the trend of electric vehicles rises, the need for lightweight components is expected to open new avenues for innovation. Collaborations with international entities for technology transfer and workforce development will further enhance local capabilities, propelling market growth.
Kenya Automotive Stamping Market Latest Developments (2025 - 2026)
Recent developments in the Kenya Automotive Stamping Market indicate a strong focus on enhancing local manufacturing capabilities. Efforts to modernize stamping facilities with advanced technology have been ramped up, enabling better production quality and efficiency. Furthermore, collaborations between local and global firms are increasingly aimed at developing specialized stamping solutions tailored to the unique demands of the region's automotive market.
Kenya Automotive Stamping Market - Key Attractiveness of the Report
- 10 Years of Market Numbers
- Historical Data Starting from 2022 to 2025
- Base Year: 2025
- Forecast Data until 2032
- Key Performance Indicators Impacting the Market
- Major Upcoming Developments and Projects
Key Highlights of the Report:
- Kenya Automotive Stamping Market Outlook
- Market Size of Kenya Automotive Stamping Market, 2025
- Forecast of Kenya Automotive Stamping Market, 2032
- Historical Data and Forecast of Kenya Automotive Stamping Revenues & Volume for the Period 2022-2032F
- Kenya Automotive Stamping Market Trend Evolution
- Kenya Automotive Stamping Market Drivers and Challenges
- Kenya Automotive Stamping Price Trends
- Kenya Automotive Stamping Porter's Five Forces
- Kenya Automotive Stamping Industry Life Cycle
- Historical Data and Forecast of Kenya Automotive Stamping Market Revenues & Volume By Vehicle for the Period 2022-2032F
- Historical Data and Forecast of Kenya Automotive Stamping Market Revenues & Volume By Two-Wheeler for the Period 2022-2032F
- Historical Data and Forecast of Kenya Automotive Stamping Market Revenues & Volume By Three-Wheeler for the Period 2022-2032F
- Historical Data and Forecast of Kenya Automotive Stamping Market Revenues & Volume By Passenger Car for the Period 2022-2032F
- Historical Data and Forecast of Kenya Automotive Stamping Market Revenues & Volume By Commercial Vehicle for the Period 2022-2032F
- Historical Data and Forecast of Kenya Automotive Stamping Market Revenues & Volume By Material for the Period 2022-2032F
- Historical Data and Forecast of Kenya Automotive Stamping Market Revenues & Volume By Steel for the Period 2022-2032F
- Historical Data and Forecast of Kenya Automotive Stamping Market Revenues & Volume By Aluminium for the Period 2022-2032F
- Historical Data and Forecast of Kenya Automotive Stamping Market Revenues & Volume By Others for the Period 2022-2032F
- Historical Data and Forecast of Kenya Automotive Stamping Market Revenues & Volume By Process for the Period 2022-2032F
- Historical Data and Forecast of Kenya Automotive Stamping Market Revenues & Volume By Progressive Die Stamping for the Period 2022-2032F
- Historical Data and Forecast of Kenya Automotive Stamping Market Revenues & Volume By Tandem Stamping for the Period 2022-2032F
- Historical Data and Forecast of Kenya Automotive Stamping Market Revenues & Volume By Transfer Stamping for the Period 2022-2032F
- Historical Data and Forecast of Kenya Automotive Stamping Market Revenues & Volume By Product for the Period 2022-2032F
- Historical Data and Forecast of Kenya Automotive Stamping Market Revenues & Volume By Body Stamping for the Period 2022-2032F
- Historical Data and Forecast of Kenya Automotive Stamping Market Revenues & Volume By BIW Parts for the Period 2022-2032F
- Historical Data and Forecast of Kenya Automotive Stamping Market Revenues & Volume By Chassis for the Period 2022-2032F
- Historical Data and Forecast of Kenya Automotive Stamping Market Revenues & Volume By Non-Body Stamping for the Period 2022-2032F
- Historical Data and Forecast of Kenya Automotive Stamping Market Revenues & Volume By Engine Parts for the Period 2022-2032F
- Historical Data and Forecast of Kenya Automotive Stamping Market Revenues & Volume By Transmission and Steering Parts for the Period 2022-2032F
- Historical Data and Forecast of Kenya Automotive Stamping Market Revenues & Volume By Braking and Suspension Parts for the Period 2022-2032F
- Historical Data and Forecast of Kenya Automotive Stamping Market Revenues & Volume By Electrical Parts for the Period 2022-2032F
- Kenya Automotive Stamping Import Export Trade Statistics
- Market Opportunity Assessment By Vehicle
- Market Opportunity Assessment By Material
- Market Opportunity Assessment By Process
- Market Opportunity Assessment By Product
- Kenya Automotive Stamping Top Companies Market Share
- Kenya Automotive Stamping Competitive Benchmarking By Technical and Operational Parameters
- Kenya Automotive Stamping Company Profiles
- Kenya Automotive Stamping Key Strategic Recommendations
Frequently Asked Questions About the Market Study (FAQs):
The primary drivers include increasing vehicle demand, urbanization, rising disposable incomes, and government incentives aimed at promoting local manufacturing capabilities.
The Kenya Automotive Stamping Market was estimated at USD 391 Million in 2025 and is projected to reach USD 527 Million by 2032, growing at a CAGR of 4.4% from 2026 to 2032.
Local manufacturers often grapple with limited infrastructure, reliance on imports, currency fluctuations, and a lack of skilled labor, impacting their competitiveness.
Innovations such as automation, digitalization, and the use of lightweight materials are at the forefront of transforming production processes in the automotive stamping sector.
Global partnerships are facilitating technology transfer, skills development, and innovation, thereby enhancing the capabilities of local manufacturers to meet rising demand.
Sustainability is becoming increasingly important, with a growing emphasis on using recyclable materials and eco-friendly processes in automotive stamping, aligning with global environmental trends.
6Wresearch actively monitors the Kenya Automotive Stamping Market and publishes its comprehensive annual report, highlighting emerging trends, growth drivers, revenue analysis, and forecast outlook. Our insights help businesses to make data-backed strategic decisions with ongoing market dynamics. Our analysts track relevent industries related to the Kenya Automotive Stamping Market, allowing our clients with actionable intelligence and reliable forecasts tailored to emerging regional needs.
Yes, we provide customisation as per your requirements. To learn more, feel free to contact us on sales@6wresearch.com
1 Executive Summary |
2 Introduction |
2.1 Key Highlights of the Report |
2.2 Report Description |
2.3 Market Scope & Segmentation |
2.4 Research Methodology |
2.5 Assumptions |
3 Kenya Automotive Stamping Market Overview |
3.1 Kenya Country Macro Economic Indicators |
3.2 Kenya Automotive Stamping Market Revenues & Volume, 2022 & 2032F |
3.3 Kenya Automotive Stamping Market - Industry Life Cycle |
3.4 Kenya Automotive Stamping Market - Porter's Five Forces |
3.5 Kenya Automotive Stamping Market Revenues & Volume Share, By Vehicle, 2022 & 2032F |
3.6 Kenya Automotive Stamping Market Revenues & Volume Share, By Material, 2022 & 2032F |
3.7 Kenya Automotive Stamping Market Revenues & Volume Share, By Process, 2022 & 2032F |
3.8 Kenya Automotive Stamping Market Revenues & Volume Share, By Product, 2022 & 2032F |
4 Kenya Automotive Stamping Market Dynamics |
4.1 Impact Analysis |
4.2 Market Drivers |
4.2.1 Growing demand for lightweight vehicles leading to increased usage of stamped components |
4.2.2 Expansion of the automotive industry in Kenya and the East African region |
4.2.3 Government initiatives promoting local manufacturing and assembly of vehicles |
4.3 Market Restraints |
4.3.1 Dependence on imported raw materials for stamping processes |
4.3.2 Fluctuating raw material prices impacting manufacturing costs |
4.3.3 Lack of advanced technology and skilled labor in the stamping industry in Kenya |
5 Kenya Automotive Stamping Market Trends |
6 Kenya Automotive Stamping Market, By Types |
6.1 Kenya Automotive Stamping Market, By Vehicle |
6.1.1 Overview and Analysis |
6.1.2 Kenya Automotive Stamping Market Revenues & Volume, By Vehicle, 2022-2032F |
6.1.3 Kenya Automotive Stamping Market Revenues & Volume, By Two-Wheeler, 2022-2032F |
6.1.4 Kenya Automotive Stamping Market Revenues & Volume, By Three-Wheeler, 2022-2032F |
6.1.5 Kenya Automotive Stamping Market Revenues & Volume, By Passenger Car, 2022-2032F |
6.1.6 Kenya Automotive Stamping Market Revenues & Volume, By Commercial Vehicle, 2022-2032F |
6.2 Kenya Automotive Stamping Market, By Material |
6.2.1 Overview and Analysis |
6.2.2 Kenya Automotive Stamping Market Revenues & Volume, By Steel, 2022-2032F |
6.2.3 Kenya Automotive Stamping Market Revenues & Volume, By Aluminium, 2022-2032F |
6.2.4 Kenya Automotive Stamping Market Revenues & Volume, By Others, 2022-2032F |
6.3 Kenya Automotive Stamping Market, By Process |
6.3.1 Overview and Analysis |
6.3.2 Kenya Automotive Stamping Market Revenues & Volume, By Progressive Die Stamping, 2022-2032F |
6.3.3 Kenya Automotive Stamping Market Revenues & Volume, By Tandem Stamping, 2022-2032F |
6.3.4 Kenya Automotive Stamping Market Revenues & Volume, By Transfer Stamping, 2022-2032F |
6.4 Kenya Automotive Stamping Market, By Product |
6.4.1 Overview and Analysis |
6.4.2 Kenya Automotive Stamping Market Revenues & Volume, By Body Stamping, 2022-2032F |
6.4.3 Kenya Automotive Stamping Market Revenues & Volume, By BIW Parts, 2022-2032F |
6.4.4 Kenya Automotive Stamping Market Revenues & Volume, By Chassis, 2022-2032F |
6.4.5 Kenya Automotive Stamping Market Revenues & Volume, By Non-Body Stamping, 2022-2032F |
6.4.6 Kenya Automotive Stamping Market Revenues & Volume, By Engine Parts, 2022-2032F |
6.4.7 Kenya Automotive Stamping Market Revenues & Volume, By Transmission and Steering Parts, 2022-2032F |
6.4.8 Kenya Automotive Stamping Market Revenues & Volume, By Electrical Parts, 2022-2032F |
6.4.9 Kenya Automotive Stamping Market Revenues & Volume, By Electrical Parts, 2022-2032F |
7 Kenya Automotive Stamping Market Import-Export Trade Statistics |
7.1 Kenya Automotive Stamping Market Export to Major Countries |
7.2 Kenya Automotive Stamping Market Imports from Major Countries |
8 Kenya Automotive Stamping Market Key Performance Indicators |
8.1 Percentage of local raw materials used in stamping processes |
8.2 Investment in research and development for innovative stamping techniques |
8.3 Number of partnerships or collaborations with international stamping technology providers |
8.4 Percentage of skilled labor trained in advanced stamping techniques |
8.5 Adoption rate of sustainable and cost-effective stamping practices |
9 Kenya Automotive Stamping Market - Opportunity Assessment |
9.1 Kenya Automotive Stamping Market Opportunity Assessment, By Vehicle, 2022 & 2032F |
9.2 Kenya Automotive Stamping Market Opportunity Assessment, By Material, 2022 & 2032F |
9.3 Kenya Automotive Stamping Market Opportunity Assessment, By Process, 2022 & 2032F |
9.4 Kenya Automotive Stamping Market Opportunity Assessment, By Product, 2022 & 2032F |
10 Kenya Automotive Stamping Market - Competitive Landscape |
10.1 Kenya Automotive Stamping Market Revenue Share, By Companies, 2025 |
10.2 Kenya Automotive Stamping Market Competitive Benchmarking, By Operating and Technical Parameters |
11 Company Profiles |
12 Recommendations |
13 Disclaimer |
Global Go To Market Strategy - 2030
Export potential enables firms to identify high-growth global markets with greater confidence by combining advanced trade intelligence with a structured quantitative methodology. The framework analyzes emerging demand trends and country-level import patterns while integrating macroeconomic and trade datasets such as GDP and population forecasts, bilateral import–export flows, tariff structures, elasticity differentials between developed and developing economies, geographic distance, and import demand projections. Using weighted trade values from 2020–2024 as the base period to project country-to-country export potential for 2030, these inputs are operationalized through calculated drivers such as gravity model parameters, tariff impact factors, and projected GDP per-capita growth. Through an analysis of hidden potentials, demand hotspots, and market conditions that are most favorable to success, this method enables firms to focus on target countries, maximize returns, and global expansion with data, backed by accuracy.
By factoring in the projected importer demand gap that is currently unmet and could be potential opportunity, it identifies the potential for the Exporter (Country) among 190 countries, against the general trade analysis, which identifies the biggest importer or exporter.
To discover high-growth global markets and optimize your business strategy:
Click Here
Pricing
- Single User License$ 1,995
- Department License$ 2,400
- Site License$ 3,120
- Global License$ 3,795

Leadership Perspectives from Industry Events
Search
Thought Leadership and Analyst Meet


Our Clients
6WResearch In News
- India Air Conditioner Market Set for Strong Rebound in 2026 After Weather-Led Correction and GST-Driven Recovery: 6Wresearch
- ADAS in India: How Automatic Emergency Braking, Blind Spot Detection & Driver Monitoring are Transforming Road Safety
- Doha a strategic location for EV manufacturing hub: IPA Qatar
- Demand for luxury TVs surging in the GCC, says Samsung
- Empowering Growth: The Thriving Journey of Bangladesh’s Cable Industry
- Demand for luxury TVs surging in the GCC, says Samsung
Latest Reports
- Nicaragua RPG Gaming Market (2026-2032)
- New Zealand RPG Gaming Market (2026-2032)
- Netherlands RPG Gaming Market (2026-2032)
- Nauru RPG Gaming Market (2026-2032)
- Namibia RPG Gaming Market (2026-2032)
- Mozambique RPG Gaming Market (2026-2032)
- Montenegro RPG Gaming Market (2026-2032)
- Mongolia RPG Gaming Market (2026-2032)
- Monaco RPG Gaming Market (2026-2032)
- Micronesia RPG Gaming Market (2026-2032)
Industry Events and Analyst Meet

EV India Expo 2026

HIMTEX 2026

India Refining Summit 2026

India EV Show 2026

EV tech India Expo 2026
Whitepaper
- Middle East & Africa Commercial Security Market Click here to view more.
- Middle East & Africa Fire Safety Systems & Equipment Market Click here to view more.
- GCC Drone Market Click here to view more.
- Middle East Lighting Fixture Market Click here to view more.
- GCC Physical & Perimeter Security Market Click here to view more.