Kenya Cable Cars & Ropeways Market (2026-2032) Outlook | Value, Revenue, Industry, Forecast, Companies, Size, Analysis, Share, Trends & Growth
Market Forecast By Type (Tourism, Material handling, Public transportation, Mining industries), By Sales Channel (OEM (Original Equipment Manufacturer), Aftermarket) And Competitive Landscape
| Product Code: ETC285410 | Publication Date: Aug 2022 | Updated Date: Jul 2026 | Product Type: Market Research Report | |
| Publisher: 6Wresearch | Author: Summon Dutta | No. of Pages: 75 | No. of Figures: 35 | No. of Tables: 20 |
Kenya Cable Cars & Ropeways Market Size, Share & Growth Rate
The Kenya Cable Cars & Ropeways Market was estimated at USD 150 Million in 2025 and is projected to reach USD 201 Million by 2032, growing at a CAGR of 4.3% from 2026 to 2032. This growth trajectory is primarily driven by the escalating investments in tourism and infrastructure development, particularly in scenic and urban areas. The introduction of cable cars and ropeways serves not only to enhance the tourist experience but also addresses the pressing need for sustainable urban transport solutions.
Kenya Cable Cars & Ropeways Market Year-wise Growth Rate and Key Drivers
This graph highlights how the Kenya Cable Cars & Ropeways Market has steadily grown over the years, supported by major growth factors.
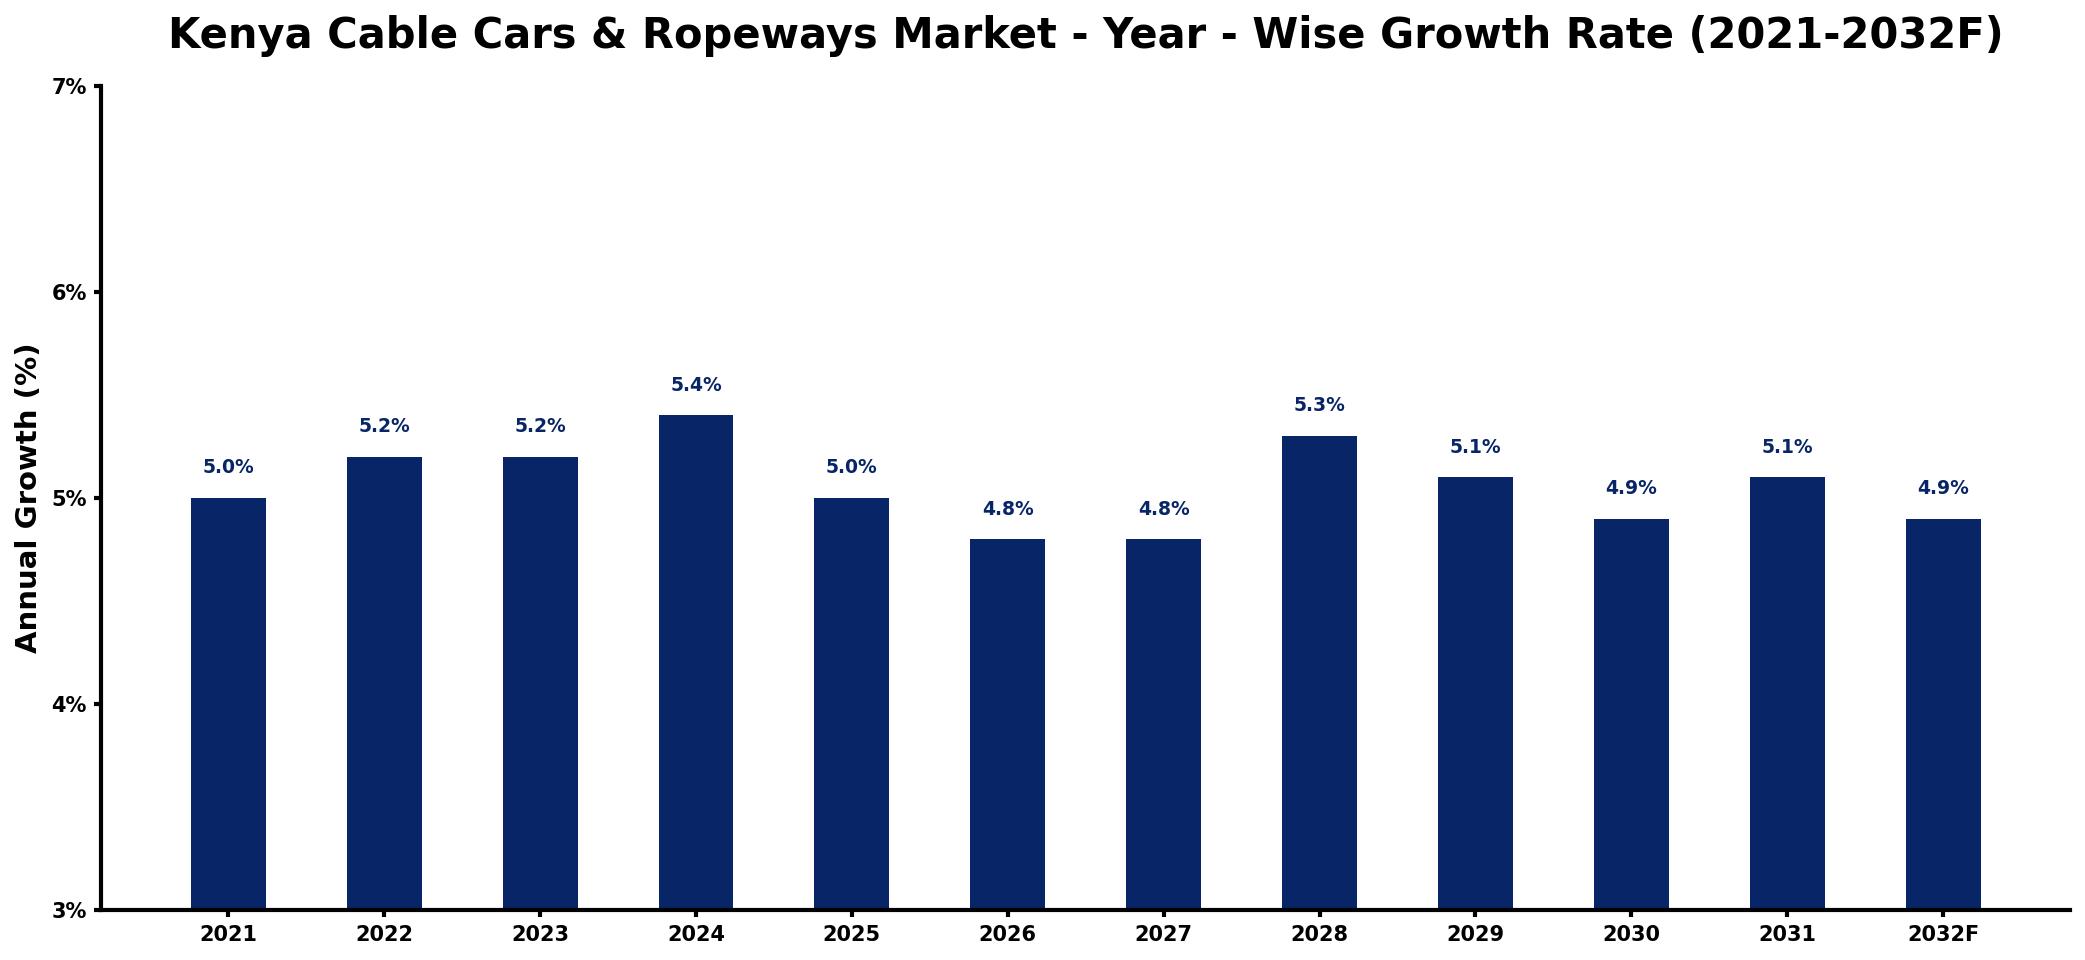
The table below presents the year‑wise growth rates along with the key drivers influencing the market
| Year | Growth Rate | Major Drivers |
| 2021 | 5.0% | Rising tourism in urban areas |
| 2022 | 5.2% | Increased investment in infrastructure |
| 2023 | 5.2% | Growing demand for scenic transport |
| 2024 | 5.4% | Expansion of adventure tourism offerings |
| 2025 | 5.0% | Enhanced urban mobility solutions |
| 2026 | 4.8% | Development of eco-friendly transport |
| 2027 | 4.8% | Support from local government initiatives |
| 2028 | 5.3% | Rising interest in sustainable tourism |
| 2029 | 5.1% | Emergence of new tourist attractions |
| 2030 | 4.9% | Growth in leisure travel activities |
| 2031 | 5.1% | growing commercial sector adoption |
| 2032 | 4.9% | increased overall sector activity |
Note: Market size estimations and growth projections presented in this report are based on 6Wresearch's proprietary forecasting methodology, utilizing the latest available industry data, government publications, and primary research inputs.
Kenya Cable Cars & Ropeways Market Synopsis
In recent years, the Kenya Cable Cars & Ropeways Market has gained significant momentum, fueled by the country's rich tourist attractions and the government's commitment to improving transportation networks. Looking ahead, this market is poised for robust expansion, particularly as urban congestion becomes an increasingly critical issue that necessitates innovative transport solutions.
As cable car systems are recognized for their ability to alleviate traffic problems while providing a unique mode of sightseeing, interest from investors and local authorities is expected to rise. This trend toward developing efficient aerial transport options aligns with the global push for greener, more sustainable travel methods, further enhancing the market's appeal.
- The market is fueled by rising tourist numbers and infrastructure investment.
- Cable cars offer eco-friendly transport solutions in urban centers and tourist hotspots.
- Government initiatives are designed to promote safety and enhance investment attractiveness.
- Operational challenges are present due to varied terrain and weather conditions.
- Innovations are focused on improving safety and reducing environmental impacts.
While the Kenya Cable Cars & Ropeways Market presents an exciting landscape for growth, several constraints could impact its progress. Regulatory hurdles and lengthy permitting processes often delay project initiation, creating uncertainty for investors. Additionally, the high initial investment costs can deter potential stakeholders from entering the market. There is also a need for enhanced local technical expertise and infrastructure to ensure effective maintenance and operation of cable systems. Addressing these restraints will require collaborative efforts between public authorities and private investors to create a favorable environment for project development.
The market is currently witnessing a surge in interest towards sustainable transport solutions, with cable cars and ropeways emerging as attractive options for urban transit. This trend is particularly pronounced in cities with challenging topographies, where traditional transport systems struggle to cope with congestion. Furthermore, the tourism sector is increasingly recognizing the value of scenic cable car rides as an enhancement to the visitor experience, driving demand for new installations in breathtaking landscapes such as the Maasai Mara and Mount Kenya.
Investment opportunities in the Kenya Cable Cars & Ropeways Market are plentiful, particularly as the government prioritizes tourism development. Projects that integrate cable systems into existing transport networks are likely to be particularly appealing. Additionally, partnerships with local tourism boards and private sector developers present avenues for innovative solutions that cater to both tourists and local commuters, maximizing the utility of these aerial transport systems.
The Kenyan government has adopted a series of initiatives aimed at fostering the growth of the cable cars and ropeways sector. Regulatory frameworks are being established to ensure the safety and sustainability of operations, while financial incentives such as tax breaks and subsidies are offered to encourage private sector investments. Through targeted public spending on infrastructure improvements, the government is laying the groundwork for the successful implementation of cable car projects that enhance connectivity in key tourist and urban areas.
Looking towards 2026-2032, the Kenya Cable Cars & Ropeways Market is expected to benefit from a blend of technological advancements and increased public awareness regarding the advantages of aerial transport solutions. The dual focus on urban transport challenges and tourism enhancement will likely drive expansion, leading to more projects that capitalize on the scenic beauty of the landscape. The integration of sustainable technologies will further solidify the appeal of cable systems, making them a staple in Kenya's transport and tourism infrastructure.
In the period between & and June 2026, the industry has seen an uptick in discussions around potential cable car projects across various regions in Kenya. Stakeholder meetings have highlighted the importance of collaboration between local governments and private investors to tackle regulatory challenges. Additionally, several initiatives aimed at showcasing the benefits of cable systems in easing urban congestion have been launched, underlining the market's readiness for a transformative phase.
- 10 Years of Market Numbers
- Historical Data Starting from 2022 to 2025
- Base Year: 2025
- Forecast Data until 2032
- Key Performance Indicators Impacting the Market
- Major Upcoming Developments and Projects
Key Highlights of the Report:
- Kenya Cable Cars & Ropeways Market Outlook
- Market Size of Kenya Cable Cars & Ropeways Market, 2025
- Forecast of Kenya Cable Cars & Ropeways Market, 2032
- Historical Data and Forecast of Kenya Cable Cars & Ropeways Revenues & Volume for the Period 2022-2032F
- Kenya Cable Cars & Ropeways Market Trend Evolution
- Kenya Cable Cars & Ropeways Market Drivers and Challenges
- Kenya Cable Cars & Ropeways Price Trends
- Kenya Cable Cars & Ropeways Porter's Five Forces
- Kenya Cable Cars & Ropeways Industry Life Cycle
- Historical Data and Forecast of Kenya Cable Cars & Ropeways Market Revenues & Volume By Type for the Period 2022-2032F
- Historical Data and Forecast of Kenya Cable Cars & Ropeways Market Revenues & Volume By Tourism for the Period 2022-2032F
- Historical Data and Forecast of Kenya Cable Cars & Ropeways Market Revenues & Volume By Material handling for the Period 2022-2032F
- Historical Data and Forecast of Kenya Cable Cars & Ropeways Market Revenues & Volume By Public transportation for the Period 2022-2032F
- Historical Data and Forecast of Kenya Cable Cars & Ropeways Market Revenues & Volume By Mining industries for the Period 2022-2032F
- Historical Data and Forecast of Kenya Cable Cars & Ropeways Market Revenues & Volume By Sales Channel for the Period 2022-2032F
- Historical Data and Forecast of Kenya Cable Cars & Ropeways Market Revenues & Volume By OEM (Original Equipment Manufacturer) for the Period 2022-2032F
- Historical Data and Forecast of Kenya Cable Cars & Ropeways Market Revenues & Volume By Aftermarket for the Period 2022-2032F
- Kenya Cable Cars & Ropeways Import Export Trade Statistics
- Market Opportunity Assessment By Type
- Market Opportunity Assessment By Sales Channel
- Kenya Cable Cars & Ropeways Top Companies Market Share
- Kenya Cable Cars & Ropeways Competitive Benchmarking By Technical and Operational Parameters
- Kenya Cable Cars & Ropeways Company Profiles
- Kenya Cable Cars & Ropeways Key Strategic Recommendations
Frequently Asked Questions About the Market Study (FAQs):
The Kenya Cable Cars & Ropeways Market is estimated to be USD 150 Million in 2025, reaching USD 201 Million by 2032, with a CAGR of 4.3% from 2026 to 2032.
Cable cars offer a unique way for tourists to experience Kenya's stunning landscapes, providing access to remote areas and enhancing overall travel experiences in popular destinations.
Challenges such as regulatory delays, high initial costs, and the need for local technical expertise may impact the timely development of cable car systems in Kenya.
The Kenyan government promotes the cable cars and ropeways market by establishing safety regulations, offering incentives for investors, and investing in related infrastructure development.
By providing a reliable and eco-friendly transport option, cable cars can reduce traffic congestion, especially in hilly or densely populated areas, improving overall urban mobility.
6Wresearch actively monitors the Kenya Cable Cars & Ropeways Market and publishes its comprehensive annual report, highlighting emerging trends, growth drivers, revenue analysis, and forecast outlook. Our insights help businesses to make data-backed strategic decisions with ongoing market dynamics. Our analysts track relevent industries related to the Kenya Cable Cars & Ropeways Market, allowing our clients with actionable intelligence and reliable forecasts tailored to emerging regional needs.
Yes, we provide customisation as per your requirements. To learn more, feel free to contact us on sales@6wresearch.com
1 Executive Summary |
2 Introduction |
2.1 Key Highlights of the Report |
2.2 Report Description |
2.3 Market Scope & Segmentation |
2.4 Research Methodology |
2.5 Assumptions |
3 Kenya Cable Cars & Ropeways Market Overview |
3.1 Kenya Country Macro Economic Indicators |
3.2 Kenya Cable Cars & Ropeways Market Revenues & Volume, 2022 & 2032F |
3.3 Kenya Cable Cars & Ropeways Market - Industry Life Cycle |
3.4 Kenya Cable Cars & Ropeways Market - Porter's Five Forces |
3.5 Kenya Cable Cars & Ropeways Market Revenues & Volume Share, By Type, 2022 & 2032F |
3.6 Kenya Cable Cars & Ropeways Market Revenues & Volume Share, By Sales Channel, 2022 & 2032F |
4 Kenya Cable Cars & Ropeways Market Dynamics |
4.1 Impact Analysis |
4.2 Market Drivers |
4.2.1 Increasing tourism in Kenya leading to higher demand for cable cars and ropeways as tourist attractions. |
4.2.2 Government investments in infrastructure development, including cable car projects, to boost transportation and connectivity. |
4.2.3 Rising urbanization and population growth driving the need for efficient and sustainable transportation solutions. |
4.3 Market Restraints |
4.3.1 High initial investment costs associated with the installation and maintenance of cable car systems. |
4.3.2 Environmental concerns and regulations related to the impact on local ecosystems and wildlife habitats. |
4.3.3 Limited awareness and acceptance of cable cars and ropeways as viable transportation options among the population. |
5 Kenya Cable Cars & Ropeways Market Trends |
6 Kenya Cable Cars & Ropeways Market, By Types |
6.1 Kenya Cable Cars & Ropeways Market, By Type |
6.1.1 Overview and Analysis |
6.1.2 Kenya Cable Cars & Ropeways Market Revenues & Volume, By Type, 2022-2032F |
6.1.3 Kenya Cable Cars & Ropeways Market Revenues & Volume, By Tourism, 2022-2032F |
6.1.4 Kenya Cable Cars & Ropeways Market Revenues & Volume, By Material handling, 2022-2032F |
6.1.5 Kenya Cable Cars & Ropeways Market Revenues & Volume, By Public transportation, 2022-2032F |
6.1.6 Kenya Cable Cars & Ropeways Market Revenues & Volume, By Mining industries, 2022-2032F |
6.2 Kenya Cable Cars & Ropeways Market, By Sales Channel |
6.2.1 Overview and Analysis |
6.2.2 Kenya Cable Cars & Ropeways Market Revenues & Volume, By OEM (Original Equipment Manufacturer), 2022-2032F |
6.2.3 Kenya Cable Cars & Ropeways Market Revenues & Volume, By Aftermarket, 2022-2032F |
7 Kenya Cable Cars & Ropeways Market Import-Export Trade Statistics |
7.1 Kenya Cable Cars & Ropeways Market Export to Major Countries |
7.2 Kenya Cable Cars & Ropeways Market Imports from Major Countries |
8 Kenya Cable Cars & Ropeways Market Key Performance Indicators |
8.1 Average daily ridership on cable cars and ropeways. |
8.2 Percentage of revenue generated from tourism-related activities. |
8.3 Number of new cable car projects initiated or completed in a year. |
9 Kenya Cable Cars & Ropeways Market - Opportunity Assessment |
9.1 Kenya Cable Cars & Ropeways Market Opportunity Assessment, By Type, 2022 & 2032F |
9.2 Kenya Cable Cars & Ropeways Market Opportunity Assessment, By Sales Channel, 2022 & 2032F |
10 Kenya Cable Cars & Ropeways Market - Competitive Landscape |
10.1 Kenya Cable Cars & Ropeways Market Revenue Share, By Companies, 2025 |
10.2 Kenya Cable Cars & Ropeways Market Competitive Benchmarking, By Operating and Technical Parameters |
11 Company Profiles |
12 Recommendations |
13 Disclaimer |
Global Go To Market Strategy - 2030
Export potential enables firms to identify high-growth global markets with greater confidence by combining advanced trade intelligence with a structured quantitative methodology. The framework analyzes emerging demand trends and country-level import patterns while integrating macroeconomic and trade datasets such as GDP and population forecasts, bilateral import–export flows, tariff structures, elasticity differentials between developed and developing economies, geographic distance, and import demand projections. Using weighted trade values from 2020–2024 as the base period to project country-to-country export potential for 2030, these inputs are operationalized through calculated drivers such as gravity model parameters, tariff impact factors, and projected GDP per-capita growth. Through an analysis of hidden potentials, demand hotspots, and market conditions that are most favorable to success, this method enables firms to focus on target countries, maximize returns, and global expansion with data, backed by accuracy.
By factoring in the projected importer demand gap that is currently unmet and could be potential opportunity, it identifies the potential for the Exporter (Country) among 190 countries, against the general trade analysis, which identifies the biggest importer or exporter.
To discover high-growth global markets and optimize your business strategy:
Click Here
Pricing
- Single User License$ 1,995
- Department License$ 2,400
- Site License$ 3,120
- Global License$ 3,795

Leadership Perspectives from Industry Events
Search
Thought Leadership and Analyst Meet


Our Clients
6WResearch In News
- India Air Conditioner Market Set for Strong Rebound in 2026 After Weather-Led Correction and GST-Driven Recovery: 6Wresearch
- ADAS in India: How Automatic Emergency Braking, Blind Spot Detection & Driver Monitoring are Transforming Road Safety
- Doha a strategic location for EV manufacturing hub: IPA Qatar
- Demand for luxury TVs surging in the GCC, says Samsung
- Empowering Growth: The Thriving Journey of Bangladesh’s Cable Industry
- Demand for luxury TVs surging in the GCC, says Samsung
Latest Reports
- Nicaragua RPG Gaming Market (2026-2032)
- New Zealand RPG Gaming Market (2026-2032)
- Netherlands RPG Gaming Market (2026-2032)
- Nauru RPG Gaming Market (2026-2032)
- Namibia RPG Gaming Market (2026-2032)
- Mozambique RPG Gaming Market (2026-2032)
- Montenegro RPG Gaming Market (2026-2032)
- Mongolia RPG Gaming Market (2026-2032)
- Monaco RPG Gaming Market (2026-2032)
- Micronesia RPG Gaming Market (2026-2032)
Industry Events and Analyst Meet

EV India Expo 2026

HIMTEX 2026

India Refining Summit 2026

India EV Show 2026

EV tech India Expo 2026
Whitepaper
- Middle East & Africa Commercial Security Market Click here to view more.
- Middle East & Africa Fire Safety Systems & Equipment Market Click here to view more.
- GCC Drone Market Click here to view more.
- Middle East Lighting Fixture Market Click here to view more.
- GCC Physical & Perimeter Security Market Click here to view more.