Jordan Cable Cars & Ropeways Market (2026-2032) Outlook | Forecast, Revenue, Trends, Share, Growth, Companies, Analysis, Industry, Value, Size
Market Forecast By Type (Tourism, Material handling, Public transportation, Mining industries), By Sales Channel (OEM (Original Equipment Manufacturer), Aftermarket) And Competitive Landscape
| Product Code: ETC285406 | Publication Date: Aug 2022 | Updated Date: Jul 2026 | Product Type: Market Research Report | |
| Publisher: 6Wresearch | Author: Sachin Kumar Rai | No. of Pages: 75 | No. of Figures: 35 | No. of Tables: 20 |
Jordan Cable Cars & Ropeways Market Size, Share & Growth Rate
The Jordan Cable Cars & Ropeways Market was estimated at USD 222 Million in 2025 and is projected to reach USD 310 Million by 2032, growing at a CAGR of 4.9% from 2026 to 2032. This growth trajectory is primarily fueled by increasing tourism and the demand for innovative transportation solutions in Jordan's rugged terrains. As more tourists flock to historical and natural attractions, cable cars and ropeways are becoming essential for enhancing connectivity and delivering memorable experiences.
Jordan Cable Cars & Ropeways Market Year-wise Growth Rate and Key Drivers
This graph highlights how the Jordan Cable Cars & Ropeways Market has steadily grown over the years, supported by major growth factors.
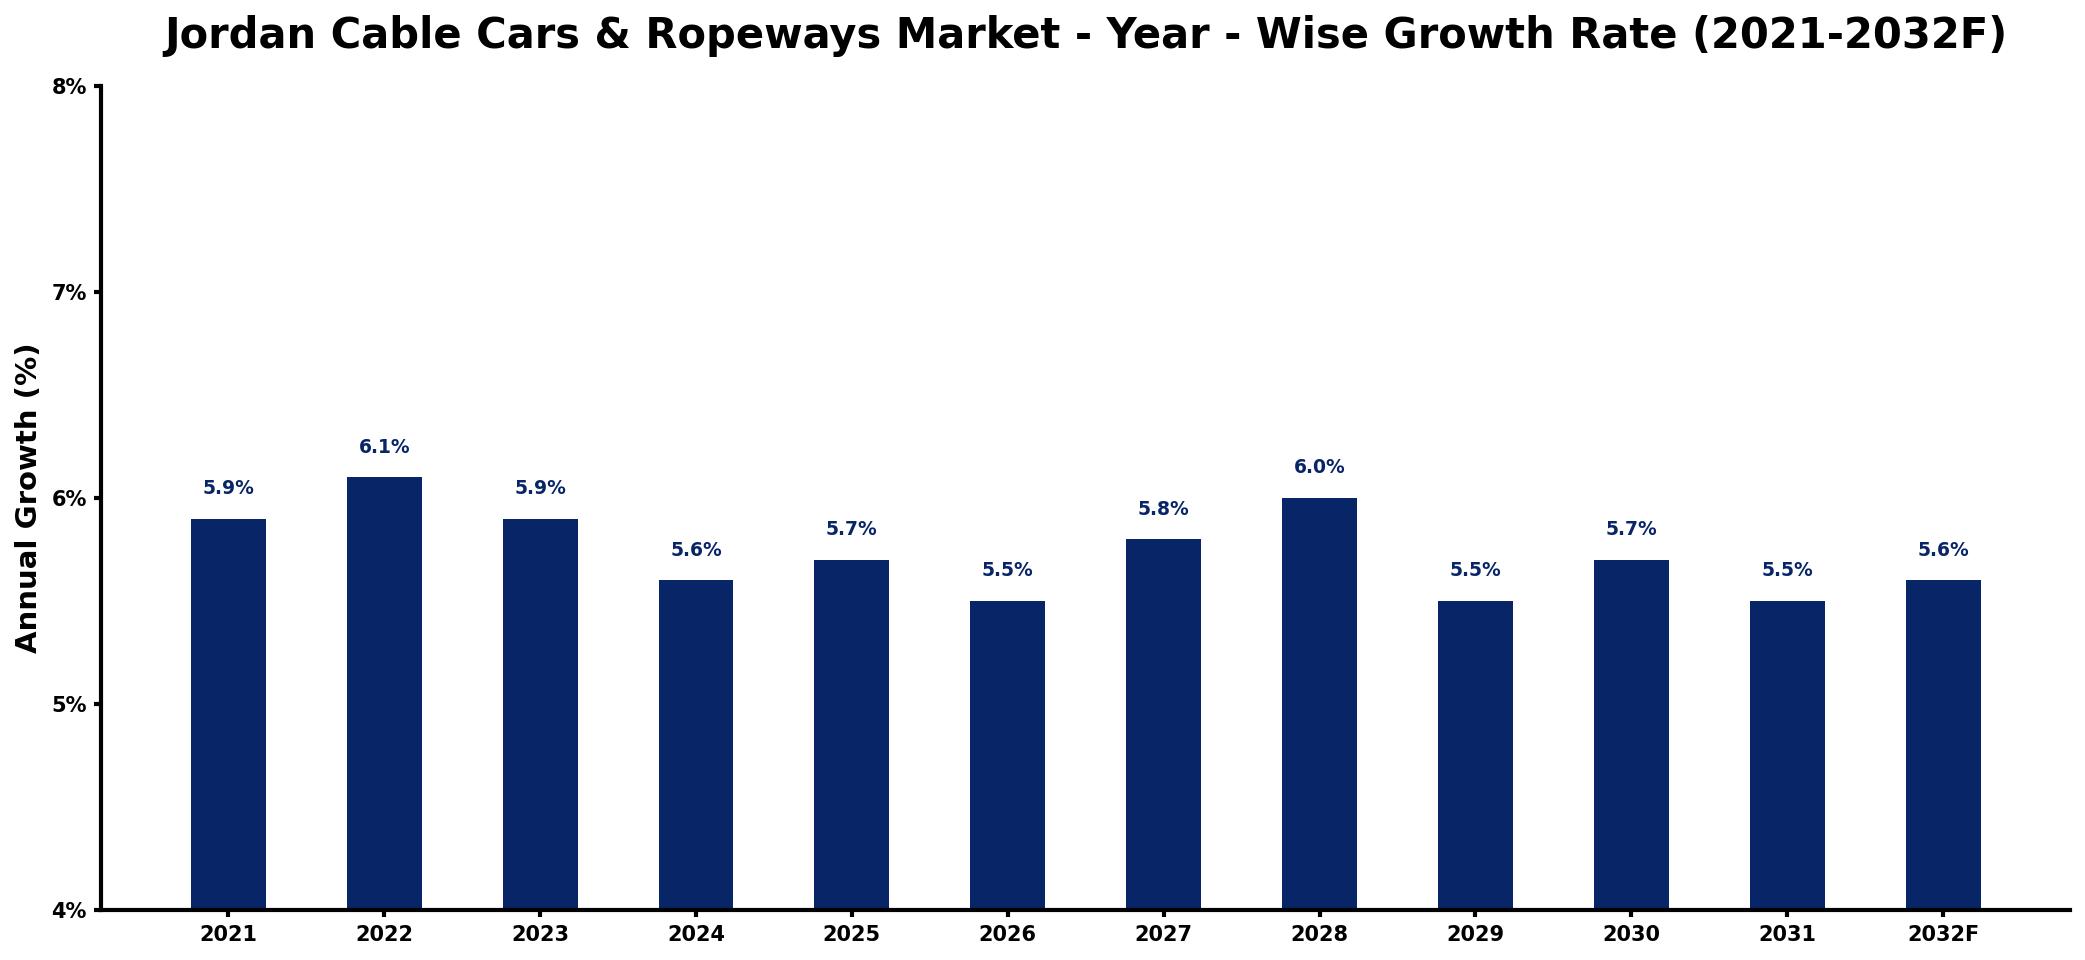
The table below presents the year‑wise growth rates along with the key drivers influencing the market
| Year | Growth Rate | Major Drivers |
| 2021 | 5.9% | Increased tourism in local areas |
| 2022 | 6.1% | Investments in infrastructure development |
| 2023 | 5.9% | Growing demand for eco-friendly transport |
| 2024 | 5.6% | Expansion of adventure tourism activities |
| 2025 | 5.7% | Rising popularity of scenic experiences |
| 2026 | 5.5% | Government initiatives for tourism growth |
| 2027 | 5.8% | Collaborations with travel agencies |
| 2028 | 6.0% | Emergence of new tourist destinations |
| 2029 | 5.5% | Development of urban transport networks |
| 2030 | 5.7% | Enhanced accessibility for remote locations |
| 2031 | 5.5% | Focus on sustainable travel options |
| 2032 | 5.6% | Integration with public transport systems |
Note: Market size estimations and growth projections presented in this report are based on 6Wresearch's proprietary forecasting methodology, utilizing the latest available industry data, government publications, and primary research inputs.
Jordan Cable Cars & Ropeways Market Synopsis
The Jordan Cable Cars & Ropeways market has gained significant momentum due to heightened tourism activities and increased investments in infrastructure. Looking ahead, the demand for these transportation solutions is anticipated to expand, especially as new projects are initiated and existing facilities are upgraded to improve safety and efficiency.
As Jordan continues to capitalize on its stunning landscapes and historical sites, the cable car and ropeway segment is well-positioned for growth. The convergence of government support, technological advancements, and an eco-friendly focus underscores a promising future for this market, making it an attractive avenue for investment.
- Steady growth projected due to increased tourism and infrastructure development.
- Investment in cable cars enhances access to popular sites like Petra and Wadi Rum.
- Technological advancements are improving safety, capacity, and efficiency.
- Government initiatives are facilitating project approvals and funding support.
- Environmental sustainability is becoming a crucial factor in new designs and projects.
Despite the favorable outlook, the Jordan Cable Cars & Ropeways Market faces several restraints that could impede its growth. Regulatory hurdles can complicate project initiation, as companies must navigate a complex landscape of safety standards and environmental guidelines. Additionally, financial constraints can limit investments in new cable car systems, especially in regions lacking robust infrastructure. Lastly, the competition from traditional modes of transport may dilute demand for these innovative solutions unless effectively addressed through targeted marketing and customer engagement.
Several key trends are shaping the Jordan Cable Cars & Ropeways Market. Firstly, the adoption of eco-friendly designs is becoming increasingly important as environmental concerns grow. Innovations in technology are enhancing the efficiency and safety of cable car systems, making them more appealing to both investors and users. Furthermore, collaborations between public and private sectors are emerging as a strategy to expedite the development of new projects, ensuring that investment translates into tangible outcomes for the tourism sector.
The Jordan Cable Cars & Ropeways Market presents significant investment opportunities, particularly for those looking to capitalize on the booming tourism industry. There is a clear demand for unique and efficient transport solutions that facilitate access to iconic sites such as Petra and Wadi Rum. Investors can also find opportunities through partnerships with local authorities to design and manage cable systems that offer safe, scenic, and convenient travel options for visitors, ultimately enhancing their overall experience.
The Jordanian government has rolled out various initiatives to promote the development of cable cars and ropeways as part of a broader strategy to boost tourism and enhance infrastructure. By offering incentives such as tax breaks and streamlining the approval process for new projects, the government is creating a favorable environment for investment. These policies are designed to ensure that safety and environmental sustainability remain at the forefront of new cable car systems, aligning with both economic goals and public interests.
The outlook for the Jordan Cable Cars & Ropeways Market through 2026-2032 is optimistic, driven by increasing tourism and a shift toward sustainable transport solutions. The picturesque landscapes of Jordan provide a unique opportunity for the development of cable systems that not only serve practical transportation needs but also enhance the overall visitor experience. As government initiatives continue to support this sector and technological innovations emerge, the market is poised for sustained growth and transformation, attracting new investments and fostering innovation.
Recent industry developments indicate a strengthening focus on enhancing safety and efficiency within the Jordan Cable Cars & Ropeways Market. With ongoing discussions around new project approvals and the introduction of advanced technology, stakeholders are actively exploring collaborative opportunities to leverage their expertise in this evolving sector. Furthermore, initiatives aimed at increasing the environmental sustainability of cable systems are beginning to gain traction, aligning with global trends towards eco-conscious tourism.
- 10 Years of Market Numbers
- Historical Data Starting from 2022 to 2025
- Base Year: 2025
- Forecast Data until 2032
- Key Performance Indicators Impacting the Market
- Major Upcoming Developments and Projects
Key Highlights of the Report:
- Jordan Cable Cars & Ropeways Market Outlook
- Market Size of Jordan Cable Cars & Ropeways Market, 2025
- Forecast of Jordan Cable Cars & Ropeways Market, 2032
- Historical Data and Forecast of Jordan Cable Cars & Ropeways Revenues & Volume for the Period 2022-2032F
- Jordan Cable Cars & Ropeways Market Trend Evolution
- Jordan Cable Cars & Ropeways Market Drivers and Challenges
- Jordan Cable Cars & Ropeways Price Trends
- Jordan Cable Cars & Ropeways Porter's Five Forces
- Jordan Cable Cars & Ropeways Industry Life Cycle
- Historical Data and Forecast of Jordan Cable Cars & Ropeways Market Revenues & Volume By Type for the Period 2022-2032F
- Historical Data and Forecast of Jordan Cable Cars & Ropeways Market Revenues & Volume By Tourism for the Period 2022-2032F
- Historical Data and Forecast of Jordan Cable Cars & Ropeways Market Revenues & Volume By Material handling for the Period 2022-2032F
- Historical Data and Forecast of Jordan Cable Cars & Ropeways Market Revenues & Volume By Public transportation for the Period 2022-2032F
- Historical Data and Forecast of Jordan Cable Cars & Ropeways Market Revenues & Volume By Mining industries for the Period 2022-2032F
- Historical Data and Forecast of Jordan Cable Cars & Ropeways Market Revenues & Volume By Sales Channel for the Period 2022-2032F
- Historical Data and Forecast of Jordan Cable Cars & Ropeways Market Revenues & Volume By OEM (Original Equipment Manufacturer) for the Period 2022-2032F
- Historical Data and Forecast of Jordan Cable Cars & Ropeways Market Revenues & Volume By Aftermarket for the Period 2022-2032F
- Jordan Cable Cars & Ropeways Import Export Trade Statistics
- Market Opportunity Assessment By Type
- Market Opportunity Assessment By Sales Channel
- Jordan Cable Cars & Ropeways Top Companies Market Share
- Jordan Cable Cars & Ropeways Competitive Benchmarking By Technical and Operational Parameters
- Jordan Cable Cars & Ropeways Company Profiles
- Jordan Cable Cars & Ropeways Key Strategic Recommendations
Frequently Asked Questions About the Market Study (FAQs):
The primary drivers include increasing tourism activities and government investments aimed at enhancing infrastructure, particularly in mountainous regions where cable systems are both practical and attractive.
The market was estimated at USD 222 Million in 2025 and is projected to reach USD 310 Million by 2032, growing at a CAGR of 4.9% from 2026 to 2032.
Key trends include advancements in safety features, improved capacity and efficiency of cable systems, and a growing emphasis on eco-friendly designs to minimize environmental impact.
Cable cars are increasingly vital in areas with challenging terrains, particularly near popular tourist attractions such as Petra, Wadi Rum, and the Dead Sea, where they enhance accessibility and visitor experience.
The Jordanian government is providing various incentives, including tax breaks and streamlined project approvals, to facilitate the development of cable car systems while ensuring adherence to safety and environmental standards.
6Wresearch actively monitors the Jordan Cable Cars & Ropeways Market and publishes its comprehensive annual report, highlighting emerging trends, growth drivers, revenue analysis, and forecast outlook. Our insights help businesses to make data-backed strategic decisions with ongoing market dynamics. Our analysts track relevent industries related to the Jordan Cable Cars & Ropeways Market, allowing our clients with actionable intelligence and reliable forecasts tailored to emerging regional needs.
Yes, we provide customisation as per your requirements. To learn more, feel free to contact us on sales@6wresearch.com
1 Executive Summary |
2 Introduction |
2.1 Key Highlights of the Report |
2.2 Report Description |
2.3 Market Scope & Segmentation |
2.4 Research Methodology |
2.5 Assumptions |
3 Jordan Cable Cars & Ropeways Market Overview |
3.1 Jordan Country Macro Economic Indicators |
3.2 Jordan Cable Cars & Ropeways Market Revenues & Volume, 2022 & 2032F |
3.3 Jordan Cable Cars & Ropeways Market - Industry Life Cycle |
3.4 Jordan Cable Cars & Ropeways Market - Porter's Five Forces |
3.5 Jordan Cable Cars & Ropeways Market Revenues & Volume Share, By Type, 2022 & 2032F |
3.6 Jordan Cable Cars & Ropeways Market Revenues & Volume Share, By Sales Channel, 2022 & 2032F |
4 Jordan Cable Cars & Ropeways Market Dynamics |
4.1 Impact Analysis |
4.2 Market Drivers |
4.2.1 Increasing tourism in Jordan |
4.2.2 Government investments in infrastructure development |
4.2.3 Growing demand for eco-friendly transportation solutions |
4.3 Market Restraints |
4.3.1 Seasonal variations in tourist footfall |
4.3.2 High initial investment costs |
4.3.3 Regulatory hurdles and approvals for new projects |
5 Jordan Cable Cars & Ropeways Market Trends |
6 Jordan Cable Cars & Ropeways Market, By Types |
6.1 Jordan Cable Cars & Ropeways Market, By Type |
6.1.1 Overview and Analysis |
6.1.2 Jordan Cable Cars & Ropeways Market Revenues & Volume, By Type, 2022-2032F |
6.1.3 Jordan Cable Cars & Ropeways Market Revenues & Volume, By Tourism, 2022-2032F |
6.1.4 Jordan Cable Cars & Ropeways Market Revenues & Volume, By Material handling, 2022-2032F |
6.1.5 Jordan Cable Cars & Ropeways Market Revenues & Volume, By Public transportation, 2022-2032F |
6.1.6 Jordan Cable Cars & Ropeways Market Revenues & Volume, By Mining industries, 2022-2032F |
6.2 Jordan Cable Cars & Ropeways Market, By Sales Channel |
6.2.1 Overview and Analysis |
6.2.2 Jordan Cable Cars & Ropeways Market Revenues & Volume, By OEM (Original Equipment Manufacturer), 2022-2032F |
6.2.3 Jordan Cable Cars & Ropeways Market Revenues & Volume, By Aftermarket, 2022-2032F |
7 Jordan Cable Cars & Ropeways Market Import-Export Trade Statistics |
7.1 Jordan Cable Cars & Ropeways Market Export to Major Countries |
7.2 Jordan Cable Cars & Ropeways Market Imports from Major Countries |
8 Jordan Cable Cars & Ropeways Market Key Performance Indicators |
8.1 Average daily ridership |
8.2 Number of new projects initiated |
8.3 Customer satisfaction ratings |
8.4 Average waiting time for passengers |
8.5 Percentage of revenue from non-tourism sources |
9 Jordan Cable Cars & Ropeways Market - Opportunity Assessment |
9.1 Jordan Cable Cars & Ropeways Market Opportunity Assessment, By Type, 2022 & 2032F |
9.2 Jordan Cable Cars & Ropeways Market Opportunity Assessment, By Sales Channel, 2022 & 2032F |
10 Jordan Cable Cars & Ropeways Market - Competitive Landscape |
10.1 Jordan Cable Cars & Ropeways Market Revenue Share, By Companies, 2025 |
10.2 Jordan Cable Cars & Ropeways Market Competitive Benchmarking, By Operating and Technical Parameters |
11 Company Profiles |
12 Recommendations |
13 Disclaimer |
Global Go To Market Strategy - 2030
Export potential enables firms to identify high-growth global markets with greater confidence by combining advanced trade intelligence with a structured quantitative methodology. The framework analyzes emerging demand trends and country-level import patterns while integrating macroeconomic and trade datasets such as GDP and population forecasts, bilateral import–export flows, tariff structures, elasticity differentials between developed and developing economies, geographic distance, and import demand projections. Using weighted trade values from 2020–2024 as the base period to project country-to-country export potential for 2030, these inputs are operationalized through calculated drivers such as gravity model parameters, tariff impact factors, and projected GDP per-capita growth. Through an analysis of hidden potentials, demand hotspots, and market conditions that are most favorable to success, this method enables firms to focus on target countries, maximize returns, and global expansion with data, backed by accuracy.
By factoring in the projected importer demand gap that is currently unmet and could be potential opportunity, it identifies the potential for the Exporter (Country) among 190 countries, against the general trade analysis, which identifies the biggest importer or exporter.
To discover high-growth global markets and optimize your business strategy:
Click Here
Pricing
- Single User License$ 1,995
- Department License$ 2,400
- Site License$ 3,120
- Global License$ 3,795

Leadership Perspectives from Industry Events
Search
Thought Leadership and Analyst Meet


Our Clients
6WResearch In News
- India Air Conditioner Market Set for Strong Rebound in 2026 After Weather-Led Correction and GST-Driven Recovery: 6Wresearch
- ADAS in India: How Automatic Emergency Braking, Blind Spot Detection & Driver Monitoring are Transforming Road Safety
- Doha a strategic location for EV manufacturing hub: IPA Qatar
- Demand for luxury TVs surging in the GCC, says Samsung
- Empowering Growth: The Thriving Journey of Bangladesh’s Cable Industry
- Demand for luxury TVs surging in the GCC, says Samsung
Latest Reports
- Nicaragua RPG Gaming Market (2026-2032)
- New Zealand RPG Gaming Market (2026-2032)
- Netherlands RPG Gaming Market (2026-2032)
- Nauru RPG Gaming Market (2026-2032)
- Namibia RPG Gaming Market (2026-2032)
- Mozambique RPG Gaming Market (2026-2032)
- Montenegro RPG Gaming Market (2026-2032)
- Mongolia RPG Gaming Market (2026-2032)
- Monaco RPG Gaming Market (2026-2032)
- Micronesia RPG Gaming Market (2026-2032)
Industry Events and Analyst Meet

EV India Expo 2026

HIMTEX 2026

India Refining Summit 2026

India EV Show 2026

EV tech India Expo 2026
Whitepaper
- Middle East & Africa Commercial Security Market Click here to view more.
- Middle East & Africa Fire Safety Systems & Equipment Market Click here to view more.
- GCC Drone Market Click here to view more.
- Middle East Lighting Fixture Market Click here to view more.
- GCC Physical & Perimeter Security Market Click here to view more.