Vietnam Cable Cars & Ropeways Market (2026-2032) Outlook | Trends, Revenue, Forecast, Size, Industry, Value, Share, Growth, Analysis & Companies
Market Forecast By Type (Tourism, Material handling, Public transportation, Mining industries), By Sales Channel (OEM (Original Equipment Manufacturer), Aftermarket) And Competitive Landscape
| Product Code: ETC285390 | Publication Date: Aug 2022 | Updated Date: Jul 2026 | Product Type: Market Research Report | |
| Publisher: 6Wresearch | Author: Ravi Bhandari | No. of Pages: 75 | No. of Figures: 35 | No. of Tables: 20 |
Vietnam Cable Cars & Ropeways Market Size, Share & Growth Rate
The Vietnam Cable Cars & Ropeways Market was estimated at USD 211 Million in 2025 and is projected to reach USD 297 Million by 2032, growing at a CAGR of 5.0% from 2026 to 2032. This growth trajectory is primarily driven by Vietnam's vibrant tourism sector, which increasingly relies on cable car systems to access breathtaking landscapes and mountainous regions. Moreover, the incorporation of these systems into urban transportation projects is further expanding their utility, promoting a dual role as both recreational and commuter transport options.
Vietnam Cable Cars & Ropeways Market Year-wise Growth Rate and Key Drivers
This graph highlights how the Vietnam Cable Cars & Ropeways Market has steadily grown over the years, supported by major growth factors.
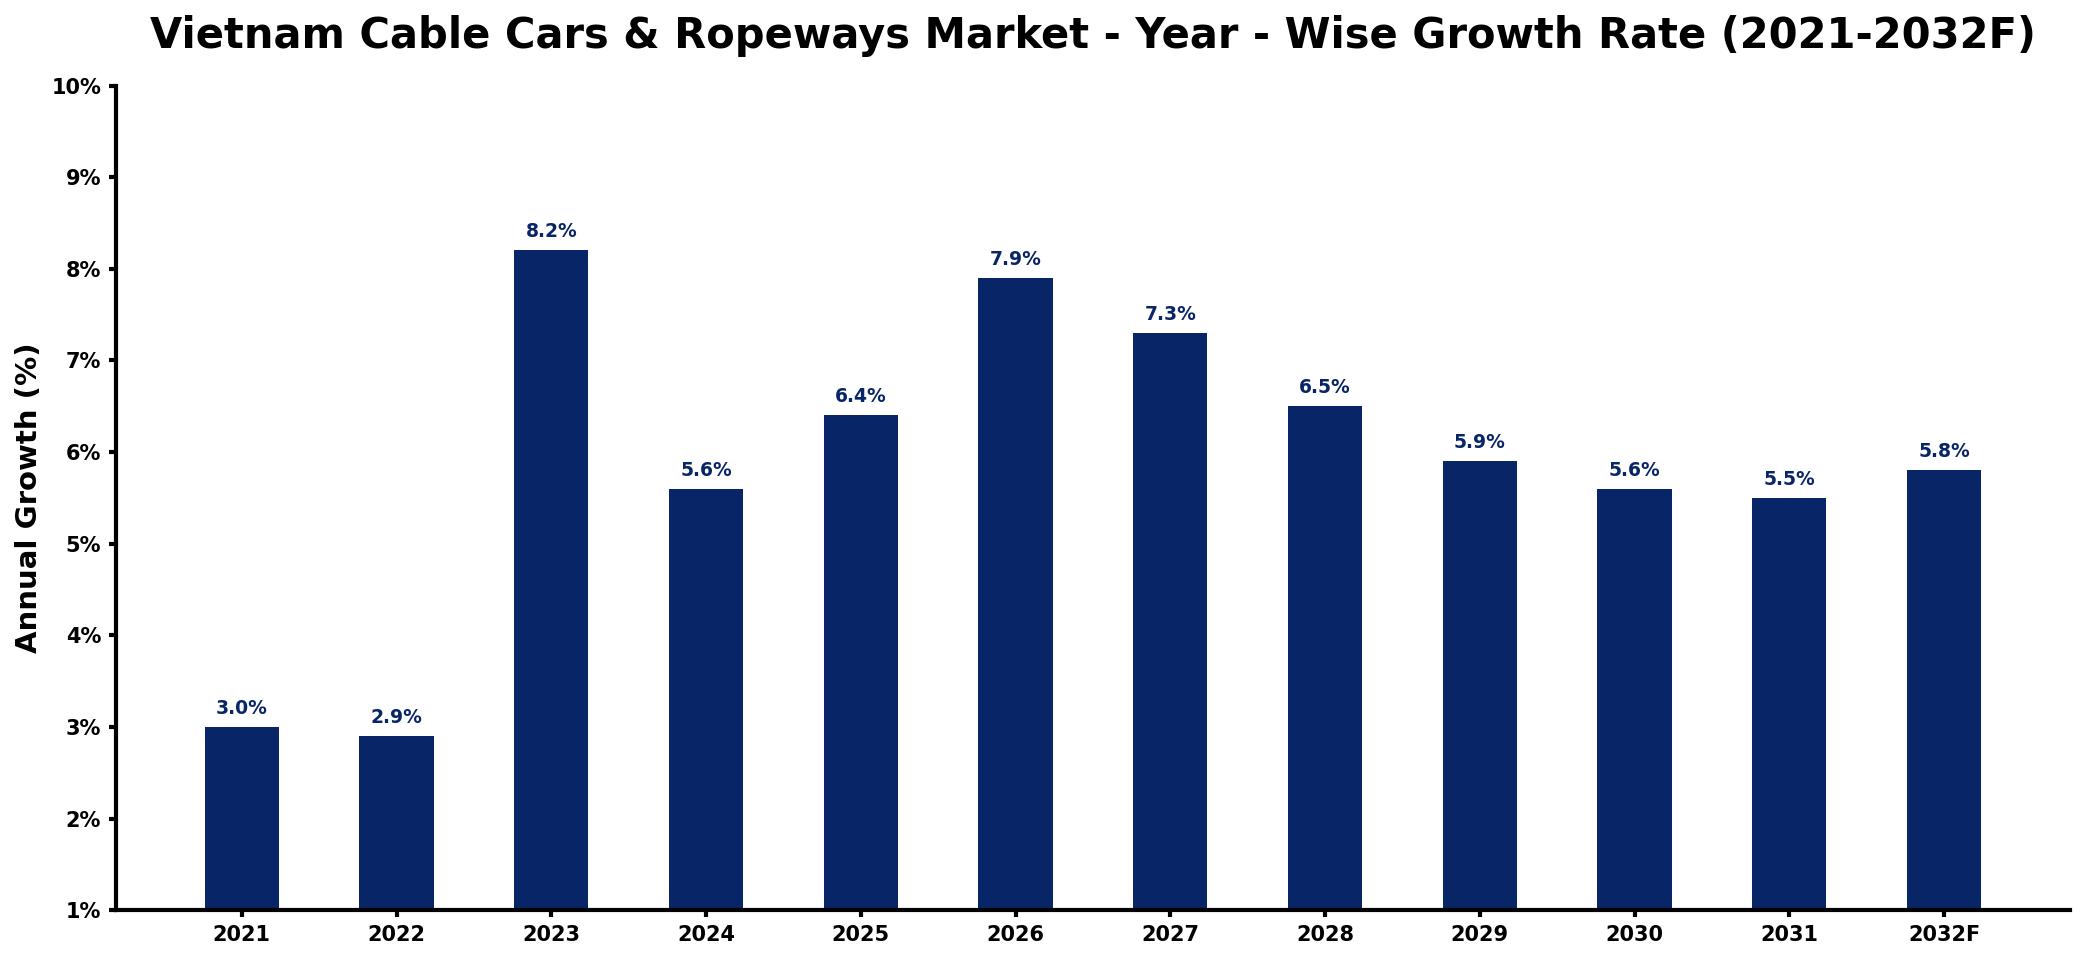
The table below presents the year‑wise growth rates along with the key drivers influencing the market
| Year | Growth Rate | Major Drivers |
| 2021 | 3.0% | Increased domestic tourism demand |
| 2022 | 2.9% | Growing infrastructure investment projects |
| 2023 | 8.2% | Expansion of leisure activities market |
| 2024 | 5.6% | Rising disposable income levels |
| 2025 | 6.4% | Emergence of eco-tourism trends |
| 2026 | 7.9% | Development of urban connectivity solutions |
| 2027 | 7.3% | Enhanced public transportation initiatives |
| 2028 | 6.5% | Integration of smart technology solutions |
| 2029 | 5.9% | Strengthening of tourism partnerships |
| 2030 | 5.6% | Growth in adventure tourism offerings |
| 2031 | 5.5% | Investment in sustainable transportation |
| 2032 | 5.8% | Increased focus on regional tourism |
Note: Market size estimations and growth projections presented in this report are based on 6Wresearch's proprietary forecasting methodology, utilizing the latest available industry data, government publications, and primary research inputs.
Vietnam Cable Cars & Ropeways Market Synopsis
The most powerful force shaping the Vietnam Cable Cars & Ropeways Market is the surge in domestic and international tourism, which has propelled the demand for accessible scenic destinations. Popular sites such as Ha Long Bay and Fansipan Mountain are becoming essential stops for visitors, and cable car systems are crucial in enhancing the overall tourist experience.
Additionally, urban development initiatives are transforming how residents and tourists navigate major cities like Hanoi and Ho Chi Minh City. By integrating cable car systems into urban transportation networks, Vietnam is not only alleviating traffic congestion but also promoting eco-friendly travel solutions in densely populated areas.
- Tourism is the primary growth driver, with cable cars enhancing access to key attractions.
- Urban transport integration is reshaping the market landscape, expanding its relevance beyond tourism.
- Safety and maintenance protocols are critical to ensuring reliability in rugged terrains.
- COVID-19 impacted ridership, but recovery trends indicate resilience in the market.
- Emerging technologies in ticketing and passenger comfort are becoming vital differentiators.
Despite the market's promising trajectory, several restraints exist that could hamper its potential. Safety and reliability are paramount, particularly given the rugged terrains and weather variability in Vietnam. Operators must invest in regular maintenance and sophisticated safety measures to ensure smooth operations. Furthermore, the integration of modern technologies for ticketing systems and security is imperative to meet the expectations of tech-savvy consumers, requiring ongoing investment and innovation.
Current trends in the Vietnam Cable Cars & Ropeways Market highlight a shift towards more sustainable practices and eco-friendly technology. As environmental concerns grow, operators are increasingly adopting green technologies in their systems. Additionally, the incorporation of advanced ticketing technologies and enhanced passenger experience features is becoming standard practice, catering to the evolving preferences of tourists and commuters alike.
The future landscape of the Vietnam Cable Cars & Ropeways Market presents substantial growth opportunities, particularly in expanding infrastructure in less-visited yet scenic locations. Investments in smaller, localized cable car systems could tap into niche tourism markets and promote regional development. Furthermore, partnerships with local governments to integrate cable systems into urban planning can bolster accessibility, ensuring long-term viability and growth.
The Vietnamese government has shown a commitment to enhancing tourism and transportation infrastructure, which is vital for the cable cars and ropeways market. Initiatives aimed at upgrading transport networks and increasing public spending on tourism-related projects underscore the governments strategy to position Vietnam as a competitive destination in Southeast Asia. These policies are likely to foster an environment conducive to private investments in cable car infrastructure.
Looking ahead, the Vietnam Cable Cars & Ropeways Market is poised for robust growth through 2026-2032, driven by a blend of tourism recovery and urban development initiatives. As destinations reopen and innovative transport solutions are embraced, cable cars are expected to play a pivotal role in reshaping both the tourist experience and daily commutes in urban areas. The ongoing expansion of both local and international investments will likely further entrench cable car systems into the country's transportation fabric.
Recent developments indicate a heightened focus on expanding cable car networks across Vietnam, with several new projects in the pipeline aimed at both tourism and urban transit. Operators are also implementing enhanced safety protocols and technology integrations in response to evolving consumer expectations post-COVID-19. Furthermore, marketing campaigns targeting domestic tourists are on the rise, signaling an adaptive approach to market fluctuations.
- 10 Years of Market Numbers
- Historical Data Starting from 2022 to 2025
- Base Year: 2025
- Forecast Data until 2032
- Key Performance Indicators Impacting the Market
- Major Upcoming Developments and Projects
Key Highlights of the Report:
- Vietnam Cable Cars & Ropeways Market Outlook
- Market Size of Vietnam Cable Cars & Ropeways Market, 2025
- Forecast of Vietnam Cable Cars & Ropeways Market, 2032
- Historical Data and Forecast of Vietnam Cable Cars & Ropeways Revenues & Volume for the Period 2022-2032F
- Vietnam Cable Cars & Ropeways Market Trend Evolution
- Vietnam Cable Cars & Ropeways Market Drivers and Challenges
- Vietnam Cable Cars & Ropeways Price Trends
- Vietnam Cable Cars & Ropeways Porter's Five Forces
- Vietnam Cable Cars & Ropeways Industry Life Cycle
- Historical Data and Forecast of Vietnam Cable Cars & Ropeways Market Revenues & Volume By Type for the Period 2022-2032F
- Historical Data and Forecast of Vietnam Cable Cars & Ropeways Market Revenues & Volume By Tourism for the Period 2022-2032F
- Historical Data and Forecast of Vietnam Cable Cars & Ropeways Market Revenues & Volume By Material handling for the Period 2022-2032F
- Historical Data and Forecast of Vietnam Cable Cars & Ropeways Market Revenues & Volume By Public transportation for the Period 2022-2032F
- Historical Data and Forecast of Vietnam Cable Cars & Ropeways Market Revenues & Volume By Mining industries for the Period 2022-2032F
- Historical Data and Forecast of Vietnam Cable Cars & Ropeways Market Revenues & Volume By Sales Channel for the Period 2022-2032F
- Historical Data and Forecast of Vietnam Cable Cars & Ropeways Market Revenues & Volume By OEM (Original Equipment Manufacturer) for the Period 2022-2032F
- Historical Data and Forecast of Vietnam Cable Cars & Ropeways Market Revenues & Volume By Aftermarket for the Period 2022-2032F
- Vietnam Cable Cars & Ropeways Import Export Trade Statistics
- Market Opportunity Assessment By Type
- Market Opportunity Assessment By Sales Channel
- Vietnam Cable Cars & Ropeways Top Companies Market Share
- Vietnam Cable Cars & Ropeways Competitive Benchmarking By Technical and Operational Parameters
- Vietnam Cable Cars & Ropeways Company Profiles
- Vietnam Cable Cars & Ropeways Key Strategic Recommendations
Frequently Asked Questions About the Market Study (FAQs):
The market's growth is largely fueled by an increase in domestic tourism and the integration of cable car systems into urban transport, addressing congestion in major cities.
The Vietnam Cable Cars & Ropeways Market was estimated at USD 211 Million in 2025 and is projected to reach USD 297 Million by 2032, growing at a CAGR of 5.0% from 2026 to 2032.
Operators are adopting safety measures and promoting local tourism initiatives to recover from the pandemic's impact on international visitor numbers.
Advanced ticketing systems and passenger comfort features are becoming essential in attracting and retaining users, reflecting the need for modernization in the sector.
Through supportive policies and public spending on tourism infrastructure, local governments can create an environment conducive to private investment and project development.
6Wresearch actively monitors the Vietnam Cable Cars & Ropeways Market and publishes its comprehensive annual report, highlighting emerging trends, growth drivers, revenue analysis, and forecast outlook. Our insights help businesses to make data-backed strategic decisions with ongoing market dynamics. Our analysts track relevent industries related to the Vietnam Cable Cars & Ropeways Market, allowing our clients with actionable intelligence and reliable forecasts tailored to emerging regional needs.
Yes, we provide customisation as per your requirements. To learn more, feel free to contact us on sales@6wresearch.com
1 Executive Summary |
2 Introduction |
2.1 Key Highlights of the Report |
2.2 Report Description |
2.3 Market Scope & Segmentation |
2.4 Research Methodology |
2.5 Assumptions |
3 Vietnam Cable Cars & Ropeways Market Overview |
3.1 Vietnam Country Macro Economic Indicators |
3.2 Vietnam Cable Cars & Ropeways Market Revenues & Volume, 2022 & 2032F |
3.3 Vietnam Cable Cars & Ropeways Market - Industry Life Cycle |
3.4 Vietnam Cable Cars & Ropeways Market - Porter's Five Forces |
3.5 Vietnam Cable Cars & Ropeways Market Revenues & Volume Share, By Type, 2022 & 2032F |
3.6 Vietnam Cable Cars & Ropeways Market Revenues & Volume Share, By Sales Channel, 2022 & 2032F |
4 Vietnam Cable Cars & Ropeways Market Dynamics |
4.1 Impact Analysis |
4.2 Market Drivers |
4.2.1 Increasing tourism in Vietnam leading to higher demand for cable cars and ropeways as tourist attractions. |
4.2.2 Government investments in infrastructure development, including cable car projects, to boost tourism. |
4.2.3 Rising disposable income of Vietnamese population, enabling more spending on leisure activities like cable car rides. |
4.2.4 Growing popularity of adventure tourism and outdoor activities driving the demand for cable cars and ropeways. |
4.2.5 Collaborations between local and international companies to introduce advanced cable car technologies in Vietnam. |
4.3 Market Restraints |
4.3.1 Environmental concerns and potential impact on local ecosystems from the construction and operation of cable cars and ropeways. |
4.3.2 High initial investment costs for developing cable car projects, leading to financial risks for investors. |
4.3.3 Seasonal fluctuations in tourist arrivals affecting the utilization and profitability of cable cars and ropeways. |
4.3.4 Regulatory challenges and bureaucratic hurdles delaying the approval and implementation of cable car projects. |
4.3.5 Competition from other modes of transportation and alternative tourist attractions impacting the market growth. |
5 Vietnam Cable Cars & Ropeways Market Trends |
6 Vietnam Cable Cars & Ropeways Market, By Types |
6.1 Vietnam Cable Cars & Ropeways Market, By Type |
6.1.1 Overview and Analysis |
6.1.2 Vietnam Cable Cars & Ropeways Market Revenues & Volume, By Type, 2022-2032F |
6.1.3 Vietnam Cable Cars & Ropeways Market Revenues & Volume, By Tourism, 2022-2032F |
6.1.4 Vietnam Cable Cars & Ropeways Market Revenues & Volume, By Material handling, 2022-2032F |
6.1.5 Vietnam Cable Cars & Ropeways Market Revenues & Volume, By Public transportation, 2022-2032F |
6.1.6 Vietnam Cable Cars & Ropeways Market Revenues & Volume, By Mining industries, 2022-2032F |
6.2 Vietnam Cable Cars & Ropeways Market, By Sales Channel |
6.2.1 Overview and Analysis |
6.2.2 Vietnam Cable Cars & Ropeways Market Revenues & Volume, By OEM (Original Equipment Manufacturer), 2022-2032F |
6.2.3 Vietnam Cable Cars & Ropeways Market Revenues & Volume, By Aftermarket, 2022-2032F |
7 Vietnam Cable Cars & Ropeways Market Import-Export Trade Statistics |
7.1 Vietnam Cable Cars & Ropeways Market Export to Major Countries |
7.2 Vietnam Cable Cars & Ropeways Market Imports from Major Countries |
8 Vietnam Cable Cars & Ropeways Market Key Performance Indicators |
8.1 Average waiting time for cable car rides, indicating operational efficiency and customer satisfaction. |
8.2 Percentage of revenue reinvested in maintenance and upgrades of cable car infrastructure, ensuring safety and reliability. |
8.3 Number of international tourists using cable cars and ropeways, reflecting the market's appeal to foreign visitors. |
8.4 Employee satisfaction and retention rates within cable car companies, influencing service quality and operational performance. |
8.5 Sustainability initiatives implemented by cable car operators, such as carbon footprint reduction and waste management practices, aligning with environmental concerns. |
9 Vietnam Cable Cars & Ropeways Market - Opportunity Assessment |
9.1 Vietnam Cable Cars & Ropeways Market Opportunity Assessment, By Type, 2022 & 2032F |
9.2 Vietnam Cable Cars & Ropeways Market Opportunity Assessment, By Sales Channel, 2022 & 2032F |
10 Vietnam Cable Cars & Ropeways Market - Competitive Landscape |
10.1 Vietnam Cable Cars & Ropeways Market Revenue Share, By Companies, 2025 |
10.2 Vietnam Cable Cars & Ropeways Market Competitive Benchmarking, By Operating and Technical Parameters |
11 Company Profiles |
12 Recommendations |
13 Disclaimer |
Global Go To Market Strategy - 2030
Export potential enables firms to identify high-growth global markets with greater confidence by combining advanced trade intelligence with a structured quantitative methodology. The framework analyzes emerging demand trends and country-level import patterns while integrating macroeconomic and trade datasets such as GDP and population forecasts, bilateral import–export flows, tariff structures, elasticity differentials between developed and developing economies, geographic distance, and import demand projections. Using weighted trade values from 2020–2024 as the base period to project country-to-country export potential for 2030, these inputs are operationalized through calculated drivers such as gravity model parameters, tariff impact factors, and projected GDP per-capita growth. Through an analysis of hidden potentials, demand hotspots, and market conditions that are most favorable to success, this method enables firms to focus on target countries, maximize returns, and global expansion with data, backed by accuracy.
By factoring in the projected importer demand gap that is currently unmet and could be potential opportunity, it identifies the potential for the Exporter (Country) among 190 countries, against the general trade analysis, which identifies the biggest importer or exporter.
To discover high-growth global markets and optimize your business strategy:
Click Here
Pricing
- Single User License$ 1,995
- Department License$ 2,400
- Site License$ 3,120
- Global License$ 3,795

Leadership Perspectives from Industry Events
Search
Thought Leadership and Analyst Meet


Our Clients
6WResearch In News
- India Air Conditioner Market Set for Strong Rebound in 2026 After Weather-Led Correction and GST-Driven Recovery: 6Wresearch
- ADAS in India: How Automatic Emergency Braking, Blind Spot Detection & Driver Monitoring are Transforming Road Safety
- Doha a strategic location for EV manufacturing hub: IPA Qatar
- Demand for luxury TVs surging in the GCC, says Samsung
- Empowering Growth: The Thriving Journey of Bangladesh’s Cable Industry
- Demand for luxury TVs surging in the GCC, says Samsung
Latest Reports
- Nicaragua RPG Gaming Market (2026-2032)
- New Zealand RPG Gaming Market (2026-2032)
- Netherlands RPG Gaming Market (2026-2032)
- Nauru RPG Gaming Market (2026-2032)
- Namibia RPG Gaming Market (2026-2032)
- Mozambique RPG Gaming Market (2026-2032)
- Montenegro RPG Gaming Market (2026-2032)
- Mongolia RPG Gaming Market (2026-2032)
- Monaco RPG Gaming Market (2026-2032)
- Micronesia RPG Gaming Market (2026-2032)
Industry Events and Analyst Meet

EV India Expo 2026

HIMTEX 2026

India Refining Summit 2026

India EV Show 2026

EV tech India Expo 2026
Whitepaper
- Middle East & Africa Commercial Security Market Click here to view more.
- Middle East & Africa Fire Safety Systems & Equipment Market Click here to view more.
- GCC Drone Market Click here to view more.
- Middle East Lighting Fixture Market Click here to view more.
- GCC Physical & Perimeter Security Market Click here to view more.