Kenya Coal Based Activated Carbon Market (2026-2032) Outlook | Growth, Industry, Share, Forecast, Companies, Analysis, Value, Size, Trends & Revenue
Market Forecast By Product (Granular, Powdered, Others), By End-Use (Water Treatment, Food & Beverage Processing, Pharmaceutical & Medical, Automotive, Air Purification, Others) And Competitive Landscape
| Product Code: ETC273950 | Publication Date: Aug 2022 | Updated Date: Jul 2026 | Product Type: Market Research Report | |
| Publisher: 6Wresearch | Author: Ravi Bhandari | No. of Pages: 75 | No. of Figures: 35 | No. of Tables: 20 |
Kenya Coal Based Activated Carbon Market Size, Share & Growth Rate
The Kenya Coal Based Activated Carbon Market was estimated at USD 182 Million in 2025 and is projected to reach USD 223 Million by 2032, growing at a CAGR of 2.9% from 2026 to 2032. This growth trajectory is propelled by the escalating demand for efficient water and air purification technologies amid rising environmental awareness and regulatory scrutiny. The diverse applications of coal-based activated carbon in critical sectors such as water treatment and industrial filtration further enhance its market potential.
Kenya Coal Based Activated Carbon Market Year-wise Growth Rate and Key Drivers
This graph highlights how the Kenya Coal Based Activated Carbon Market has steadily grown over the years, supported by major growth factors.
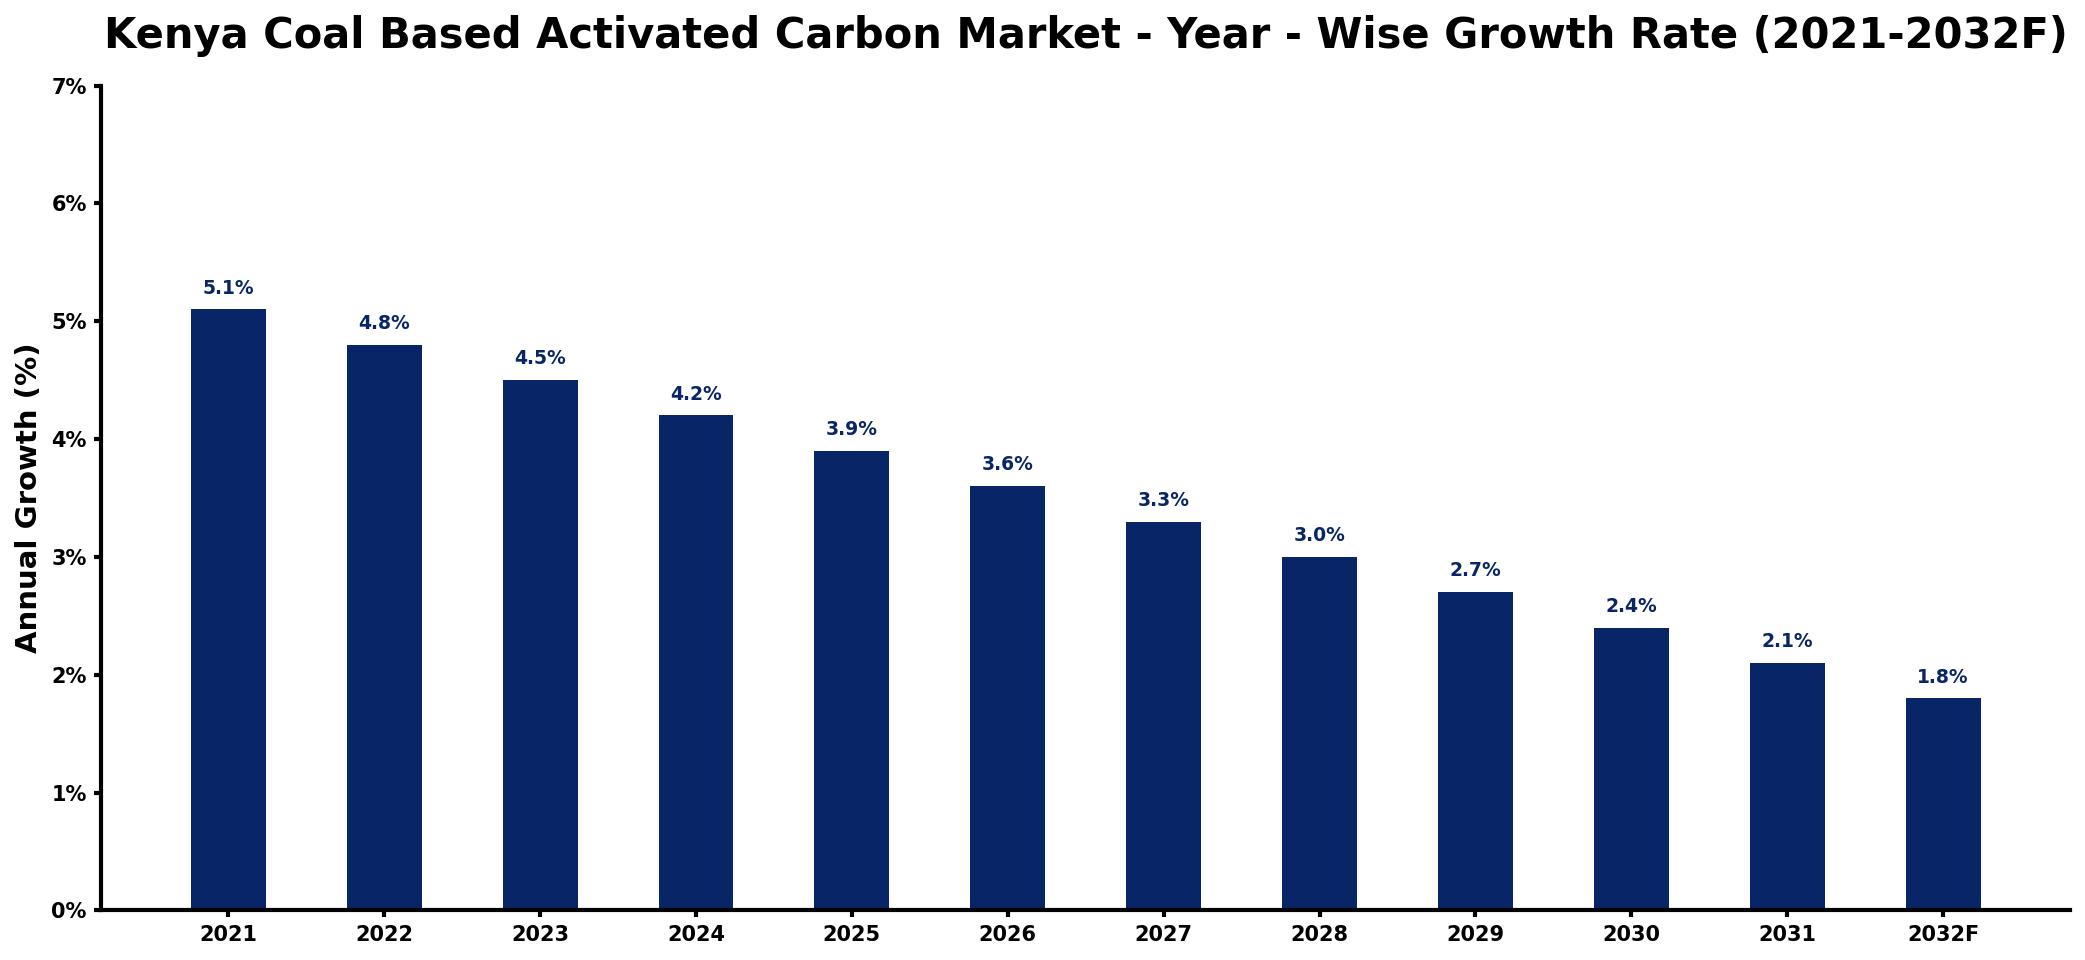
The table below presents the year‑wise growth rates along with the key drivers influencing the market
| Year | Growth Rate | Major Drivers |
| 2021 | 5.1% | increased industrial demand growth |
| 2022 | 4.8% | rising environmental regulations impact |
| 2023 | 4.5% | expansion of water treatment facilities |
| 2024 | 4.2% | growing need for air purification |
| 2025 | 3.9% | increased investments in infrastructure |
| 2026 | 3.6% | emerging applications in pharmaceuticals |
| 2027 | 3.3% | heightened focus on sustainability initiatives |
| 2028 | 3.0% | expanding agricultural applications utilization |
| 2029 | 2.7% | growing demand from food industry |
| 2030 | 2.4% | increased government support programs |
| 2031 | 2.1% | rising consumer awareness trends |
| 2032 | 1.8% | increased pharmaceutical industry usage |
Note: Market size estimations and growth projections presented in this report are based on 6Wresearch's proprietary forecasting methodology, utilizing the latest available industry data, government publications, and primary research inputs.
Kenya Coal Based Activated Carbon Market Synopsis
In Kenya, the increasing incidence of waterborne diseases has underscored the need for effective purification solutions, which directly boosts the demand for coal-based activated carbon. This materials high adsorption capacity is essential for removing a range of pollutants, thereby making it indispensable in both domestic and industrial applications.
Moreover, the growth of urbanization and industrialization in the region is contributing to a heightened awareness regarding air quality issues. This awareness is fostering the adoption of activated carbon in air filtration systems, thus driving the market further. As a result, the coal-based activated carbon market is becoming increasingly vital for both health and environmental sustainability.
Kenya Coal Based Activated Carbon Market Key Takeaways
- The market is driven by the growing need for purification solutions in water and air sectors.
- High adsorption capacity makes coal-based activated carbon suitable for a variety of applications.
- Government policies are increasingly promoting sustainability, impacting raw material sourcing.
- Emerging industries are expanding the potential applications for activated carbon.
- Environmental regulations are shaping market dynamics, creating both challenges and opportunities.
Evaluation of Restraints in Kenya Coal Based Activated Carbon Market
Despite the positive growth outlook, the Kenya coal-based activated carbon market faces significant restraints. One major concern involves the environmental impacts associated with coal extraction and its subsequent use. Growing public scrutiny and regulatory pressures are prompting a shift toward alternative raw materials, complicating the landscape for coal-based solutions. Additionally, competition from substitutes such as coconut shell and wood-based activated carbon poses a challenge to market share, urging producers to innovate and adapt to the changing preferences of consumers and regulators alike.
Kenya Coal Based Activated Carbon Market Trends
A notable trend in the Kenya coal-based activated carbon market is the rising incorporation of advanced technologies in production processes, enhancing the quality and efficiency of activated carbon. Furthermore, the ongoing research into optimizing adsorption techniques has opened doors to new applications, including those in gas purification and automotive emissions control. Concurrently, there is a growing emphasis on sustainable sourcing of raw materials, prompting the exploration of alternative sources for activated carbon production.
Kenya Coal Based Activated Carbon Market Opportunities
Opportunities for growth in the Kenya coal-based activated carbon market are plentiful. The expanding water treatment and industrial processing sectors are set to drive demand for effective filtration solutions. Additionally, as Kenya continues to implement stringent environmental regulations, industries are compelled to adopt advanced filtration technologies, further increasing the reliance on activated carbon. Investment in R&D for innovative applications, such as bioremediation and recovery processes, also presents avenues for substantial growth.
Government Initiatives in the Kenya Coal Based Activated Carbon Market
Government initiatives aimed at enhancing environmental sustainability play a crucial role in shaping the coal-based activated carbon market in Kenya. Various policies are being implemented to regulate emissions and encourage the use of effective filtration technologies. Additionally, public spending on infrastructure for water and air purification projects is anticipated to boost demand for activated carbon. Programs promoting research into alternative materials highlight the government's commitment to reducing the ecological footprint associated with coal usage.
Future Insights of the Kenya Coal Based Activated Carbon Market
Looking ahead to the period between 2026 and 2032, the Kenya coal-based activated carbon market is poised for steady growth. The increasing awareness of environmental issues, combined with regulatory support for clean technologies, will likely catalyze demand across various sectors. Innovations in activated carbon applications and advancements in production methods will be pivotal in enhancing market competitiveness. As industries pivot toward sustainable practices, coal-based activated carbon could emerge as a central element in achieving cleaner air and water in Kenya.
Kenya Coal Based Activated Carbon Market Latest Developments (2025 - 2026)
Recent developments in the Kenya coal-based activated carbon market reflect a shifting focus toward sustainability and innovation. Companies are increasingly investing in advanced technologies to optimize production and improve the efficacy of activated carbon. Additionally, there is a noticeable trend toward collaborations between government bodies and private sectors aimed at enhancing environmental compliance and promoting cleaner production methods. As these initiatives gain traction, they are expected to reshape the competitive landscape and drive forward the agenda for enhanced filtration solutions.
Kenya Coal Based Activated Carbon Market - Key Attractiveness of the Report
- 10 Years of Market Numbers
- Historical Data Starting from 2022 to 2025
- Base Year: 2025
- Forecast Data until 2032
- Key Performance Indicators Impacting the Market
- Major Upcoming Developments and Projects
Key Highlights of the Report:
- Kenya Coal Based Activated Carbon Market Outlook
- Market Size of Kenya Coal Based Activated Carbon Market, 2025
- Forecast of Kenya Coal Based Activated Carbon Market, 2032
- Historical Data and Forecast of Kenya Coal Based Activated Carbon Revenues & Volume for the Period 2022-2032F
- Kenya Coal Based Activated Carbon Market Trend Evolution
- Kenya Coal Based Activated Carbon Market Drivers and Challenges
- Kenya Coal Based Activated Carbon Price Trends
- Kenya Coal Based Activated Carbon Porter's Five Forces
- Kenya Coal Based Activated Carbon Industry Life Cycle
- Historical Data and Forecast of Kenya Coal Based Activated Carbon Market Revenues & Volume By Product for the Period 2022-2032F
- Historical Data and Forecast of Kenya Coal Based Activated Carbon Market Revenues & Volume By Granular for the Period 2022-2032F
- Historical Data and Forecast of Kenya Coal Based Activated Carbon Market Revenues & Volume By Powdered for the Period 2022-2032F
- Historical Data and Forecast of Kenya Coal Based Activated Carbon Market Revenues & Volume By Others for the Period 2022-2032F
- Historical Data and Forecast of Kenya Coal Based Activated Carbon Market Revenues & Volume By End-Use for the Period 2022-2032F
- Historical Data and Forecast of Kenya Coal Based Activated Carbon Market Revenues & Volume By Water Treatment for the Period 2022-2032F
- Historical Data and Forecast of Kenya Coal Based Activated Carbon Market Revenues & Volume By Food & Beverage Processing for the Period 2022-2032F
- Historical Data and Forecast of Kenya Coal Based Activated Carbon Market Revenues & Volume By Pharmaceutical & Medical for the Period 2022-2032F
- Historical Data and Forecast of Kenya Coal Based Activated Carbon Market Revenues & Volume By Automotive for the Period 2022-2032F
- Historical Data and Forecast of Kenya Coal Based Activated Carbon Market Revenues & Volume By Air Purification for the Period 2022-2032F
- Historical Data and Forecast of Kenya Coal Based Activated Carbon Market Revenues & Volume By Others for the Period 2022-2032F
- Kenya Coal Based Activated Carbon Import Export Trade Statistics
- Market Opportunity Assessment By Product
- Market Opportunity Assessment By End-Use
- Kenya Coal Based Activated Carbon Top Companies Market Share
- Kenya Coal Based Activated Carbon Competitive Benchmarking By Technical and Operational Parameters
- Kenya Coal Based Activated Carbon Company Profiles
- Kenya Coal Based Activated Carbon Key Strategic Recommendations
Frequently Asked Questions About the Market Study (FAQs):
The market was estimated at USD 182 Million in 2025 and is projected to reach USD 223 Million by 2032, growing at a CAGR of 2.9% from 2026 to 2032.
The primary applications include water purification, air filtration, and various industrial processes where effective filtration is essential for regulatory compliance and environmental sustainability.
Government regulations are critical, as they not only shape market dynamics but also encourage the adoption of cleaner technologies, directly influencing demand for activated carbon solutions.
Environmental concerns regarding coal extraction and usage are prompting a transition towards sustainable practices and alternative materials, which pose both challenges and opportunities for the industry.
Expect to see technological advancements in production and application processes, a greater emphasis on sustainability, and potential collaborations aimed at enhancing market competitiveness and environmental compliance.
6Wresearch actively monitors the Kenya Coal Based Activated Carbon Market and publishes its comprehensive annual report, highlighting emerging trends, growth drivers, revenue analysis, and forecast outlook. Our insights help businesses to make data-backed strategic decisions with ongoing market dynamics. Our analysts track relevent industries related to the Kenya Coal Based Activated Carbon Market, allowing our clients with actionable intelligence and reliable forecasts tailored to emerging regional needs.
Yes, we provide customisation as per your requirements. To learn more, feel free to contact us on sales@6wresearch.com
1 Executive Summary |
2 Introduction |
2.1 Key Highlights of the Report |
2.2 Report Description |
2.3 Market Scope & Segmentation |
2.4 Research Methodology |
2.5 Assumptions |
3 Kenya Coal Based Activated Carbon Market Overview |
3.1 Kenya Country Macro Economic Indicators |
3.2 Kenya Coal Based Activated Carbon Market Revenues & Volume, 2022 & 2032F |
3.3 Kenya Coal Based Activated Carbon Market - Industry Life Cycle |
3.4 Kenya Coal Based Activated Carbon Market - Porter's Five Forces |
3.5 Kenya Coal Based Activated Carbon Market Revenues & Volume Share, By Product, 2022 & 2032F |
3.6 Kenya Coal Based Activated Carbon Market Revenues & Volume Share, By End-Use, 2022 & 2032F |
4 Kenya Coal Based Activated Carbon Market Dynamics |
4.1 Impact Analysis |
4.2 Market Drivers |
4.2.1 Growing awareness about environmental pollution and the need for sustainable solutions |
4.2.2 Increasing demand for activated carbon in water and air purification applications |
4.2.3 Favorable government regulations promoting the use of activated carbon for environmental protection |
4.3 Market Restraints |
4.3.1 Volatility in coal prices impacting production costs |
4.3.2 Competition from alternative purification technologies such as UV treatment and membrane filtration |
5 Kenya Coal Based Activated Carbon Market Trends |
6 Kenya Coal Based Activated Carbon Market, By Types |
6.1 Kenya Coal Based Activated Carbon Market, By Product |
6.1.1 Overview and Analysis |
6.1.2 Kenya Coal Based Activated Carbon Market Revenues & Volume, By Product, 2022-2032F |
6.1.3 Kenya Coal Based Activated Carbon Market Revenues & Volume, By Granular, 2022-2032F |
6.1.4 Kenya Coal Based Activated Carbon Market Revenues & Volume, By Powdered, 2022-2032F |
6.1.5 Kenya Coal Based Activated Carbon Market Revenues & Volume, By Others, 2022-2032F |
6.2 Kenya Coal Based Activated Carbon Market, By End-Use |
6.2.1 Overview and Analysis |
6.2.2 Kenya Coal Based Activated Carbon Market Revenues & Volume, By Water Treatment, 2022-2032F |
6.2.3 Kenya Coal Based Activated Carbon Market Revenues & Volume, By Food & Beverage Processing, 2022-2032F |
6.2.4 Kenya Coal Based Activated Carbon Market Revenues & Volume, By Pharmaceutical & Medical, 2022-2032F |
6.2.5 Kenya Coal Based Activated Carbon Market Revenues & Volume, By Automotive, 2022-2032F |
6.2.6 Kenya Coal Based Activated Carbon Market Revenues & Volume, By Air Purification, 2022-2032F |
6.2.7 Kenya Coal Based Activated Carbon Market Revenues & Volume, By Others, 2022-2032F |
7 Kenya Coal Based Activated Carbon Market Import-Export Trade Statistics |
7.1 Kenya Coal Based Activated Carbon Market Export to Major Countries |
7.2 Kenya Coal Based Activated Carbon Market Imports from Major Countries |
8 Kenya Coal Based Activated Carbon Market Key Performance Indicators |
8.1 Percentage increase in adoption of coal-based activated carbon in water treatment plants |
8.2 Number of new government regulations supporting the use of activated carbon in environmental protection |
8.3 Growth in the number of partnerships between activated carbon manufacturers and water treatment companies |
8.4 Percentage increase in research and development investments in coal-based activated carbon technologies. |
9 Kenya Coal Based Activated Carbon Market - Opportunity Assessment |
9.1 Kenya Coal Based Activated Carbon Market Opportunity Assessment, By Product, 2022 & 2032F |
9.2 Kenya Coal Based Activated Carbon Market Opportunity Assessment, By End-Use, 2022 & 2032F |
10 Kenya Coal Based Activated Carbon Market - Competitive Landscape |
10.1 Kenya Coal Based Activated Carbon Market Revenue Share, By Companies, 2025 |
10.2 Kenya Coal Based Activated Carbon Market Competitive Benchmarking, By Operating and Technical Parameters |
11 Company Profiles |
12 Recommendations |
13 Disclaimer |
Global Go To Market Strategy - 2030
Export potential enables firms to identify high-growth global markets with greater confidence by combining advanced trade intelligence with a structured quantitative methodology. The framework analyzes emerging demand trends and country-level import patterns while integrating macroeconomic and trade datasets such as GDP and population forecasts, bilateral import–export flows, tariff structures, elasticity differentials between developed and developing economies, geographic distance, and import demand projections. Using weighted trade values from 2020–2024 as the base period to project country-to-country export potential for 2030, these inputs are operationalized through calculated drivers such as gravity model parameters, tariff impact factors, and projected GDP per-capita growth. Through an analysis of hidden potentials, demand hotspots, and market conditions that are most favorable to success, this method enables firms to focus on target countries, maximize returns, and global expansion with data, backed by accuracy.
By factoring in the projected importer demand gap that is currently unmet and could be potential opportunity, it identifies the potential for the Exporter (Country) among 190 countries, against the general trade analysis, which identifies the biggest importer or exporter.
To discover high-growth global markets and optimize your business strategy:
Click Here
Pricing
- Single User License$ 1,995
- Department License$ 2,400
- Site License$ 3,120
- Global License$ 3,795

Leadership Perspectives from Industry Events
Search
Thought Leadership and Analyst Meet


Our Clients
6WResearch In News
- India Air Conditioner Market Set for Strong Rebound in 2026 After Weather-Led Correction and GST-Driven Recovery: 6Wresearch
- ADAS in India: How Automatic Emergency Braking, Blind Spot Detection & Driver Monitoring are Transforming Road Safety
- Doha a strategic location for EV manufacturing hub: IPA Qatar
- Demand for luxury TVs surging in the GCC, says Samsung
- Empowering Growth: The Thriving Journey of Bangladesh’s Cable Industry
- Demand for luxury TVs surging in the GCC, says Samsung
Latest Reports
- Nicaragua RPG Gaming Market (2026-2032)
- New Zealand RPG Gaming Market (2026-2032)
- Netherlands RPG Gaming Market (2026-2032)
- Nauru RPG Gaming Market (2026-2032)
- Namibia RPG Gaming Market (2026-2032)
- Mozambique RPG Gaming Market (2026-2032)
- Montenegro RPG Gaming Market (2026-2032)
- Mongolia RPG Gaming Market (2026-2032)
- Monaco RPG Gaming Market (2026-2032)
- Micronesia RPG Gaming Market (2026-2032)
Industry Events and Analyst Meet

EV India Expo 2026

HIMTEX 2026

India Refining Summit 2026

India EV Show 2026

EV tech India Expo 2026
Whitepaper
- Middle East & Africa Commercial Security Market Click here to view more.
- Middle East & Africa Fire Safety Systems & Equipment Market Click here to view more.
- GCC Drone Market Click here to view more.
- Middle East Lighting Fixture Market Click here to view more.
- GCC Physical & Perimeter Security Market Click here to view more.