Kenya Electronic Materials And Chemicals Market (2026-2032) Outlook | Industry, Trends, Value, Companies, Revenue, Forecast, Analysis, Size, Share & Growth
Market Forecast By Product (Liquid, Gaseous, Solid), By Application (Silicon Wafers, PCB Laminates, Specialty Gases, Wet Chemicals and Solvents, Photoresist, Others), By End Uses (Semiconductors and Integrated Circuits, Printed Circuit Boards) And Competitive Landscape
| Product Code: ETC323510 | Publication Date: Aug 2022 | Updated Date: Jul 2026 | Product Type: Market Research Report | |
| Publisher: 6Wresearch | Author: Sumit Sagar | No. of Pages: 75 | No. of Figures: 35 | No. of Tables: 20 |
Kenya Electronic Materials And Chemicals Market Size, Share & Growth Rate
The Kenya Electronic Materials And Chemicals Market was estimated at USD 185 Million in 2025 and is projected to reach USD 242 Million by 2032, growing at a CAGR of 3.9% from 2026 to 2032. This growth trajectory is primarily driven by the increasing adoption of electronic devices across multiple sectors including telecommunications, automotive, and consumer electronics. The push towards innovation and the demand for advanced materials, such as semiconductors and eco-friendly chemicals, further reinforces this upward trend.
Kenya Electronic Materials And Chemicals Market Year-wise Growth Rate and Key Drivers
This graph highlights how the Kenya Electronic Materials And Chemicals Market has steadily grown over the years, supported by major growth factors.
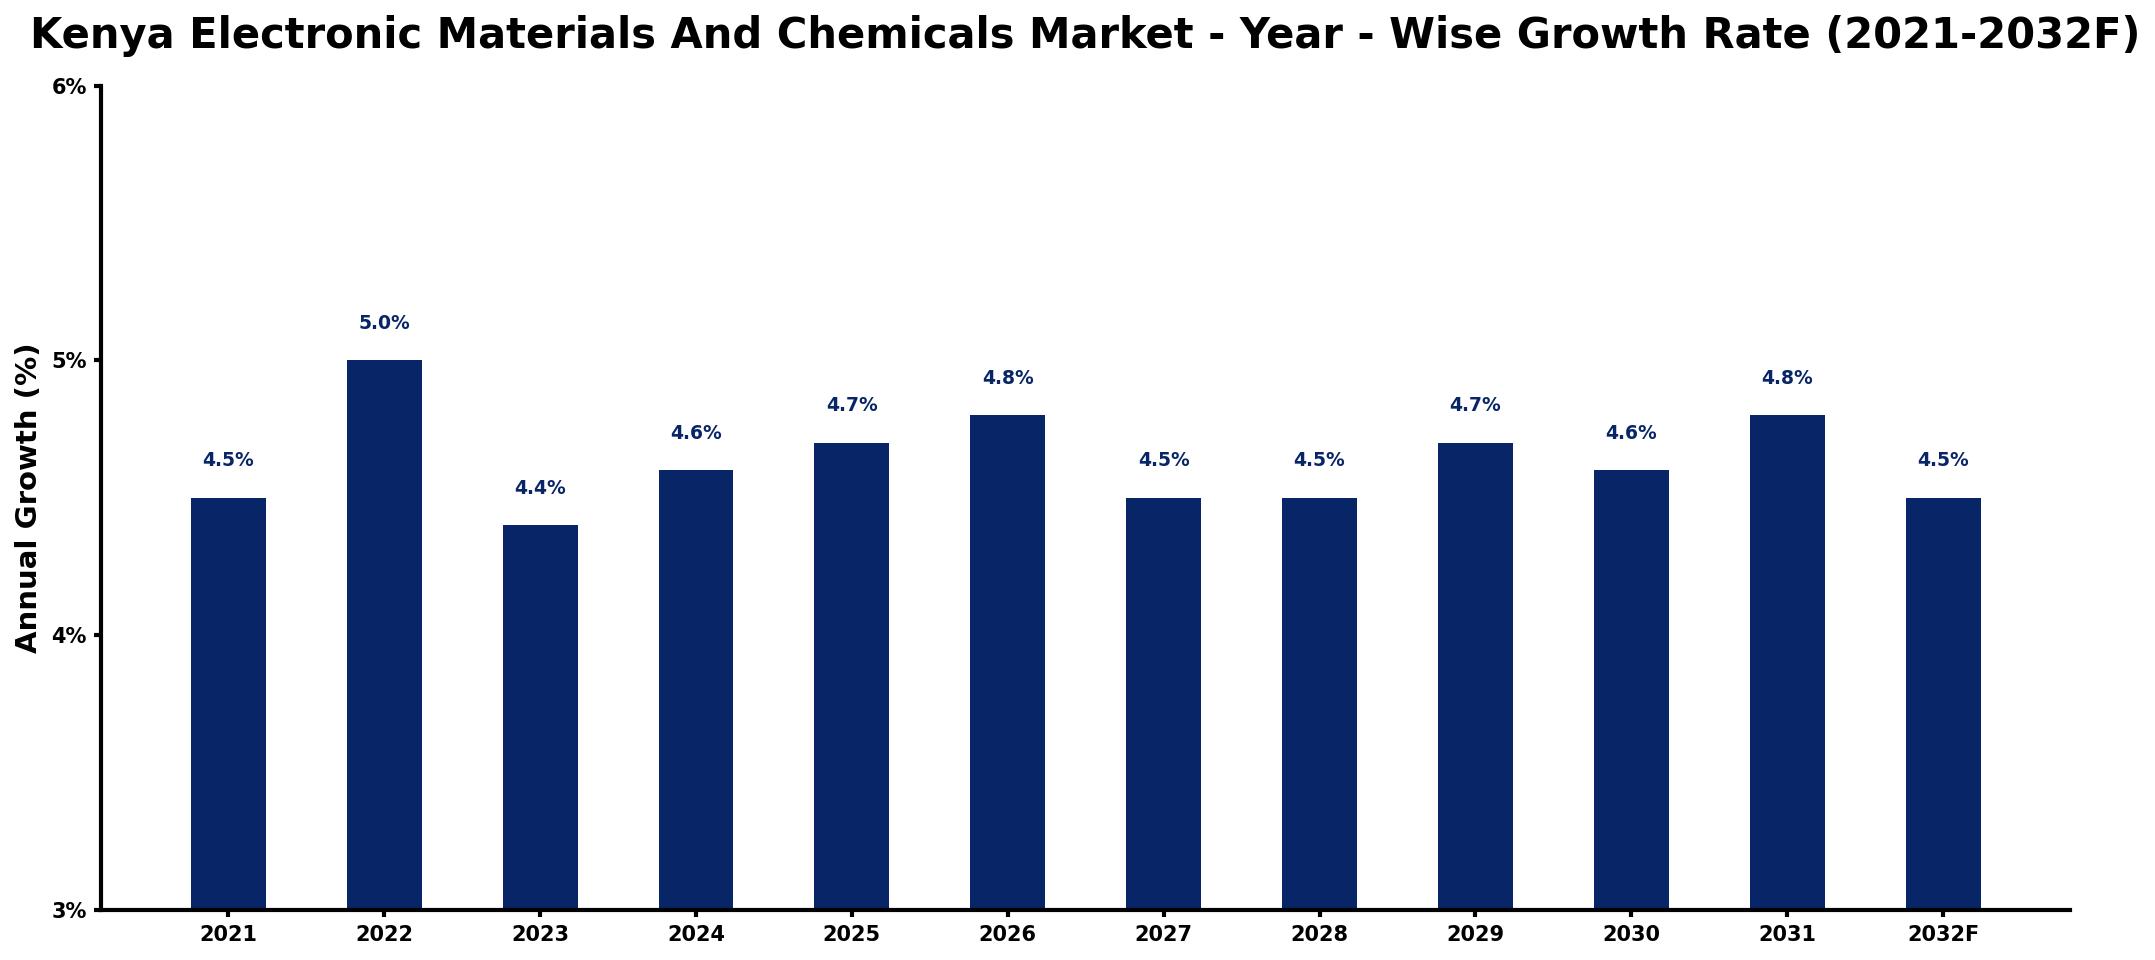
The table below presents the year‑wise growth rates along with the key drivers influencing the market
| Year | Growth Rate | Major Drivers |
| 2021 | 4.5% | Rising demand from manufacturing sector |
| 2022 | 5.0% | Increased investment in renewable energy |
| 2023 | 4.4% | Growth in telecommunications infrastructure projects |
| 2024 | 4.6% | Expansion of construction activities nationwide |
| 2025 | 4.7% | Surge in automotive industry innovation |
| 2026 | 4.8% | expanding manufacturing base activity |
| 2027 | 4.5% | Boost in agricultural technology applications |
| 2028 | 4.5% | Emergence of smart city initiatives |
| 2029 | 4.7% | Growth of e-commerce platforms |
| 2030 | 4.6% | Increase in public infrastructure projects |
| 2031 | 4.8% | Rising interest in sustainable solutions |
| 2032 | 4.5% | growing commercial sector adoption |
Note: Market size estimations and growth projections presented in this report are based on 6Wresearch's proprietary forecasting methodology, utilizing the latest available industry data, government publications, and primary research inputs.
Kenya Electronic Materials And Chemicals Market Synopsis
The Kenya Electronic Materials and Chemicals Market is currently experiencing notable advancements, propelled by rising consumer demand and technological innovations. The infusion of government support aimed at bolstering the electronics industry is equally significant, fostering an environment ripe for investment and development.
As more local and international players invest in the sector, the market is evolving to incorporate sustainable practices. The increasing focus on environmental concerns is shifting the landscape towards the adoption of green materials, which are gaining traction in manufacturing processes.
Kenya Electronic Materials And Chemicals Market Key Takeaways
- Rapid growth fueled by rising demand for smartphones, laptops, and other electronic devices.
- Shift towards environmentally sustainable materials is reshaping production practices.
- Government initiatives are enhancing competitiveness within the electronics sector.
- Investment opportunities are abundant in the supply chain of electronic materials and chemicals.
- Innovation in product development is key to addressing market demands and environmental challenges.
Evaluation of Restraints in Kenya Electronic Materials And Chemicals Market
Despite its potential, the Kenya Electronic Materials and Chemicals Market faces significant challenges that may hinder its growth. Access to advanced technologies and high-quality raw materials remains limited, which poses a barrier to local manufacturing capabilities. Additionally, the high import costs associated with electronic materials create a financial strain on businesses, particularly smaller ones. Furthermore, infrastructural deficiencies can impede supply chain efficiency, making it harder for companies to compete effectively. Coupled with regulatory uncertainties and a shortage of skilled labor, these factors create a complex landscape that requires strategic navigation.
Kenya Electronic Materials And Chemicals Market Trends
Current trends in the Kenya Electronic Materials and Chemicals Market reflect a growing demand for innovation and eco-conscious practices. The rising popularity of lead-free solder materials, alongside advancements in eco-friendly packaging, indicates a market increasingly aligned with global sustainability goals. Furthermore, the integration of renewable energy sources in manufacturing processes is also becoming a focal point. With consumer preferences shifting towards more sustainable options, local manufacturers are under pressure to adopt innovative techniques that improve product performance while minimizing environmental impact.
Kenya Electronic Materials And Chemicals Market Opportunities
The market presents several compelling investment opportunities, particularly for those looking to engage in the supply chain of electronic materials and chemicals. With the government actively promoting the manufacturing sector and encouraging foreign investments, there is a fertile ground for partnerships that can lead to expansion across neighboring East African countries. As technological advancements continue, the market is set to grow, providing avenues for investment in research and development aimed at introducing innovative products that meet both local and international demand.
Government Initiatives in the Kenya Electronic Materials And Chemicals Market
The Kenyan government has initiated several programs to nurture the growth of the electronic materials and chemicals sector. Notably, the Kenya Industrial Transformation Program is designed to enhance the competitiveness of the manufacturing industry, which encompasses electronics. Furthermore, the establishment of the Kenya National Innovation Agency underscores the emphasis on fostering research and development within the technology space, driving innovation in electronic materials. Tax incentives and various investment promotion strategies are also in place to attract both local and international players to invest in this burgeoning sector.
Future Insights of the Kenya Electronic Materials And Chemicals Market
Looking ahead to 2026-2032, the Kenya Electronic Materials and Chemicals Market is anticipated to maintain a positive growth trajectory, underpinned by heightened demand for electronic devices driven by industrial digitalization and automation. The consumer electronics segment is poised for expansion, while burgeoning sectors such as automotive and healthcare will further fuel the market's growth. Continuous investments in research and development focused on innovative, sustainable solutions will be crucial in shaping the future of the market, ultimately making it an attractive space for local and international investors.
Kenya Electronic Materials And Chemicals Market Latest Developments (2025 - 2026)
Recent trends indicate a notable shift towards collaborative efforts between private sector entities and government bodies aimed at boosting local manufacturing capabilities. New partnerships focused on technological advancements are emerging, particularly in developing environmentally friendly materials. Additionally, there have been reports of increasing investments in R&D initiatives aimed at enhancing product innovation, which is crucial for meeting both consumer expectations and regulatory standards in a rapidly changing market.
Kenya Electronic Materials And Chemicals Market - Key Attractiveness of the Report
- 10 Years of Market Numbers
- Historical Data Starting from 2022 to 2025
- Base Year: 2025
- Forecast Data until 2032
- Key Performance Indicators Impacting the Market
- Major Upcoming Developments and Projects
Key Highlights of the Report:
- Kenya Electronic Materials And Chemicals Market Outlook
- Market Size of Kenya Electronic Materials And Chemicals Market, 2025
- Forecast of Kenya Electronic Materials And Chemicals Market, 2032
- Historical Data and Forecast of Kenya Electronic Materials And Chemicals Revenues & Volume for the Period 2022-2032F
- Kenya Electronic Materials And Chemicals Market Trend Evolution
- Kenya Electronic Materials And Chemicals Market Drivers and Challenges
- Kenya Electronic Materials And Chemicals Price Trends
- Kenya Electronic Materials And Chemicals Porter's Five Forces
- Kenya Electronic Materials And Chemicals Industry Life Cycle
- Historical Data and Forecast of Kenya Electronic Materials And Chemicals Market Revenues & Volume By Product for the Period 2022-2032F
- Historical Data and Forecast of Kenya Electronic Materials And Chemicals Market Revenues & Volume By Liquid for the Period 2022-2032F
- Historical Data and Forecast of Kenya Electronic Materials And Chemicals Market Revenues & Volume By Gaseous for the Period 2022-2032F
- Historical Data and Forecast of Kenya Electronic Materials And Chemicals Market Revenues & Volume By Solid for the Period 2022-2032F
- Historical Data and Forecast of Kenya Electronic Materials And Chemicals Market Revenues & Volume By Application for the Period 2022-2032F
- Historical Data and Forecast of Kenya Electronic Materials And Chemicals Market Revenues & Volume By Silicon Wafers for the Period 2022-2032F
- Historical Data and Forecast of Kenya Electronic Materials And Chemicals Market Revenues & Volume By PCB Laminates for the Period 2022-2032F
- Historical Data and Forecast of Kenya Electronic Materials And Chemicals Market Revenues & Volume By Specialty Gases for the Period 2022-2032F
- Historical Data and Forecast of Kenya Electronic Materials And Chemicals Market Revenues & Volume By Wet Chemicals and Solvents for the Period 2022-2032F
- Historical Data and Forecast of Kenya Electronic Materials And Chemicals Market Revenues & Volume By Photoresist for the Period 2022-2032F
- Historical Data and Forecast of Kenya Electronic Materials And Chemicals Market Revenues & Volume By Others for the Period 2022-2032F
- Historical Data and Forecast of Kenya Electronic Materials And Chemicals Market Revenues & Volume By End Uses for the Period 2022-2032F
- Historical Data and Forecast of Kenya Electronic Materials And Chemicals Market Revenues & Volume By Semiconductors and Integrated Circuits for the Period 2022-2032F
- Historical Data and Forecast of Kenya Electronic Materials And Chemicals Market Revenues & Volume By Printed Circuit Boards for the Period 2022-2032F
- Kenya Electronic Materials And Chemicals Import Export Trade Statistics
- Market Opportunity Assessment By Product
- Market Opportunity Assessment By Application
- Market Opportunity Assessment By End Uses
- Kenya Electronic Materials And Chemicals Top Companies Market Share
- Kenya Electronic Materials And Chemicals Competitive Benchmarking By Technical and Operational Parameters
- Kenya Electronic Materials And Chemicals Company Profiles
- Kenya Electronic Materials And Chemicals Key Strategic Recommendations
Frequently Asked Questions About the Market Study (FAQs):
The market's growth is largely driven by increasing demand for electronic devices across various sectors, including telecommunications and automotive, along with government initiatives supporting manufacturing and innovation.
The market is witnessing a shift towards eco-friendly materials, including lead-free solder and renewable energy integration in manufacturing, reflecting a broader global trend toward sustainability.
The market is estimated to reach USD 242 Million by 2032, growing from USD 185 Million in 2025, at a CAGR of 3.9% from 2026 to 2032.
Companies contend with issues such as limited access to advanced technologies, high import costs, and a lack of skilled workforce, which can impede their competitive edge.
The consumer electronics sector, along with the automotive and healthcare industries, are anticipated to be major drivers of demand as these sectors continue to digitalize and automate.
Investors can explore opportunities in the supply chain of electronic materials, collaborations with local manufacturers, and R&D initiatives focused on sustainable innovations.
6Wresearch actively monitors the Kenya Electronic Materials And Chemicals Market and publishes its comprehensive annual report, highlighting emerging trends, growth drivers, revenue analysis, and forecast outlook. Our insights help businesses to make data-backed strategic decisions with ongoing market dynamics. Our analysts track relevent industries related to the Kenya Electronic Materials And Chemicals Market, allowing our clients with actionable intelligence and reliable forecasts tailored to emerging regional needs.
Yes, we provide customisation as per your requirements. To learn more, feel free to contact us on sales@6wresearch.com
1 Executive Summary |
2 Introduction |
2.1 Key Highlights of the Report |
2.2 Report Description |
2.3 Market Scope & Segmentation |
2.4 Research Methodology |
2.5 Assumptions |
3 Kenya Electronic Materials And Chemicals Market Overview |
3.1 Kenya Country Macro Economic Indicators |
3.2 Kenya Electronic Materials And Chemicals Market Revenues & Volume, 2022 & 2032F |
3.3 Kenya Electronic Materials And Chemicals Market - Industry Life Cycle |
3.4 Kenya Electronic Materials And Chemicals Market - Porter's Five Forces |
3.5 Kenya Electronic Materials And Chemicals Market Revenues & Volume Share, By Product, 2022 & 2032F |
3.6 Kenya Electronic Materials And Chemicals Market Revenues & Volume Share, By Application, 2022 & 2032F |
3.7 Kenya Electronic Materials And Chemicals Market Revenues & Volume Share, By End Uses, 2022 & 2032F |
4 Kenya Electronic Materials And Chemicals Market Dynamics |
4.1 Impact Analysis |
4.2 Market Drivers |
4.2.1 Increasing demand for electronic devices and components in Kenya |
4.2.2 Growing adoption of advanced technologies in the electronics industry |
4.2.3 Favorable government policies supporting the electronics manufacturing sector |
4.3 Market Restraints |
4.3.1 High import dependency for electronic materials and chemicals |
4.3.2 Fluctuating prices of raw materials |
4.3.3 Lack of skilled workforce in the electronics manufacturing sector |
5 Kenya Electronic Materials And Chemicals Market Trends |
6 Kenya Electronic Materials And Chemicals Market, By Types |
6.1 Kenya Electronic Materials And Chemicals Market, By Product |
6.1.1 Overview and Analysis |
6.1.2 Kenya Electronic Materials And Chemicals Market Revenues & Volume, By Product, 2022-2032F |
6.1.3 Kenya Electronic Materials And Chemicals Market Revenues & Volume, By Liquid, 2022-2032F |
6.1.4 Kenya Electronic Materials And Chemicals Market Revenues & Volume, By Gaseous, 2022-2032F |
6.1.5 Kenya Electronic Materials And Chemicals Market Revenues & Volume, By Solid, 2022-2032F |
6.2 Kenya Electronic Materials And Chemicals Market, By Application |
6.2.1 Overview and Analysis |
6.2.2 Kenya Electronic Materials And Chemicals Market Revenues & Volume, By Silicon Wafers, 2022-2032F |
6.2.3 Kenya Electronic Materials And Chemicals Market Revenues & Volume, By PCB Laminates, 2022-2032F |
6.2.4 Kenya Electronic Materials And Chemicals Market Revenues & Volume, By Specialty Gases, 2022-2032F |
6.2.5 Kenya Electronic Materials And Chemicals Market Revenues & Volume, By Wet Chemicals and Solvents, 2022-2032F |
6.2.6 Kenya Electronic Materials And Chemicals Market Revenues & Volume, By Photoresist, 2022-2032F |
6.2.7 Kenya Electronic Materials And Chemicals Market Revenues & Volume, By Others, 2022-2032F |
6.3 Kenya Electronic Materials And Chemicals Market, By End Uses |
6.3.1 Overview and Analysis |
6.3.2 Kenya Electronic Materials And Chemicals Market Revenues & Volume, By Semiconductors and Integrated Circuits, 2022-2032F |
6.3.3 Kenya Electronic Materials And Chemicals Market Revenues & Volume, By Printed Circuit Boards, 2022-2032F |
7 Kenya Electronic Materials And Chemicals Market Import-Export Trade Statistics |
7.1 Kenya Electronic Materials And Chemicals Market Export to Major Countries |
7.2 Kenya Electronic Materials And Chemicals Market Imports from Major Countries |
8 Kenya Electronic Materials And Chemicals Market Key Performance Indicators |
8.1 Investment in research and development for new electronic materials and chemicals |
8.2 Percentage increase in manufacturing capacity utilization |
8.3 Number of partnerships or collaborations with local suppliers for raw materials |
9 Kenya Electronic Materials And Chemicals Market - Opportunity Assessment |
9.1 Kenya Electronic Materials And Chemicals Market Opportunity Assessment, By Product, 2022 & 2032F |
9.2 Kenya Electronic Materials And Chemicals Market Opportunity Assessment, By Application, 2022 & 2032F |
9.3 Kenya Electronic Materials And Chemicals Market Opportunity Assessment, By End Uses, 2022 & 2032F |
10 Kenya Electronic Materials And Chemicals Market - Competitive Landscape |
10.1 Kenya Electronic Materials And Chemicals Market Revenue Share, By Companies, 2025 |
10.2 Kenya Electronic Materials And Chemicals Market Competitive Benchmarking, By Operating and Technical Parameters |
11 Company Profiles |
12 Recommendations |
13 Disclaimer |
Global Go To Market Strategy - 2030
Export potential enables firms to identify high-growth global markets with greater confidence by combining advanced trade intelligence with a structured quantitative methodology. The framework analyzes emerging demand trends and country-level import patterns while integrating macroeconomic and trade datasets such as GDP and population forecasts, bilateral import–export flows, tariff structures, elasticity differentials between developed and developing economies, geographic distance, and import demand projections. Using weighted trade values from 2020–2024 as the base period to project country-to-country export potential for 2030, these inputs are operationalized through calculated drivers such as gravity model parameters, tariff impact factors, and projected GDP per-capita growth. Through an analysis of hidden potentials, demand hotspots, and market conditions that are most favorable to success, this method enables firms to focus on target countries, maximize returns, and global expansion with data, backed by accuracy.
By factoring in the projected importer demand gap that is currently unmet and could be potential opportunity, it identifies the potential for the Exporter (Country) among 190 countries, against the general trade analysis, which identifies the biggest importer or exporter.
To discover high-growth global markets and optimize your business strategy:
Click Here
Pricing
- Single User License$ 1,995
- Department License$ 2,400
- Site License$ 3,120
- Global License$ 3,795

Leadership Perspectives from Industry Events
Search
Thought Leadership and Analyst Meet


Our Clients
6WResearch In News
- India Air Conditioner Market Set for Strong Rebound in 2026 After Weather-Led Correction and GST-Driven Recovery: 6Wresearch
- ADAS in India: How Automatic Emergency Braking, Blind Spot Detection & Driver Monitoring are Transforming Road Safety
- Doha a strategic location for EV manufacturing hub: IPA Qatar
- Demand for luxury TVs surging in the GCC, says Samsung
- Empowering Growth: The Thriving Journey of Bangladesh’s Cable Industry
- Demand for luxury TVs surging in the GCC, says Samsung
Latest Reports
- Nicaragua RPG Gaming Market (2026-2032)
- New Zealand RPG Gaming Market (2026-2032)
- Netherlands RPG Gaming Market (2026-2032)
- Nauru RPG Gaming Market (2026-2032)
- Namibia RPG Gaming Market (2026-2032)
- Mozambique RPG Gaming Market (2026-2032)
- Montenegro RPG Gaming Market (2026-2032)
- Mongolia RPG Gaming Market (2026-2032)
- Monaco RPG Gaming Market (2026-2032)
- Micronesia RPG Gaming Market (2026-2032)
Industry Events and Analyst Meet

EV India Expo 2026

HIMTEX 2026

India Refining Summit 2026

India EV Show 2026

EV tech India Expo 2026
Whitepaper
- Middle East & Africa Commercial Security Market Click here to view more.
- Middle East & Africa Fire Safety Systems & Equipment Market Click here to view more.
- GCC Drone Market Click here to view more.
- Middle East Lighting Fixture Market Click here to view more.
- GCC Physical & Perimeter Security Market Click here to view more.