Kenya Electronic parts Market (2026-2032) | Share, Value, Outlook, Analysis, Industry, Forecast, Trends, Revenue, Growth, Size & Companies
Market Forecast By Type (Passive, Active, Electro Mechanic), By Application (Automotive, Communications, Computing Applications, Others) And Competitive Landscape
| Product Code: ETC035590 | Publication Date: Oct 2020 | Updated Date: Jun 2026 | Product Type: Report | |
| Publisher: 6Wresearch | Author: Bhawna Singh | No. of Pages: 70 | No. of Figures: 35 | No. of Tables: 5 |
Kenya Electronic parts Market Summary
The kenya electronic parts market was estimated at USD 433 Million in 2025 and is projected to reach USD 566 Million by 2032, growing at a CAGR of 4.4% from 2026 to 2032.
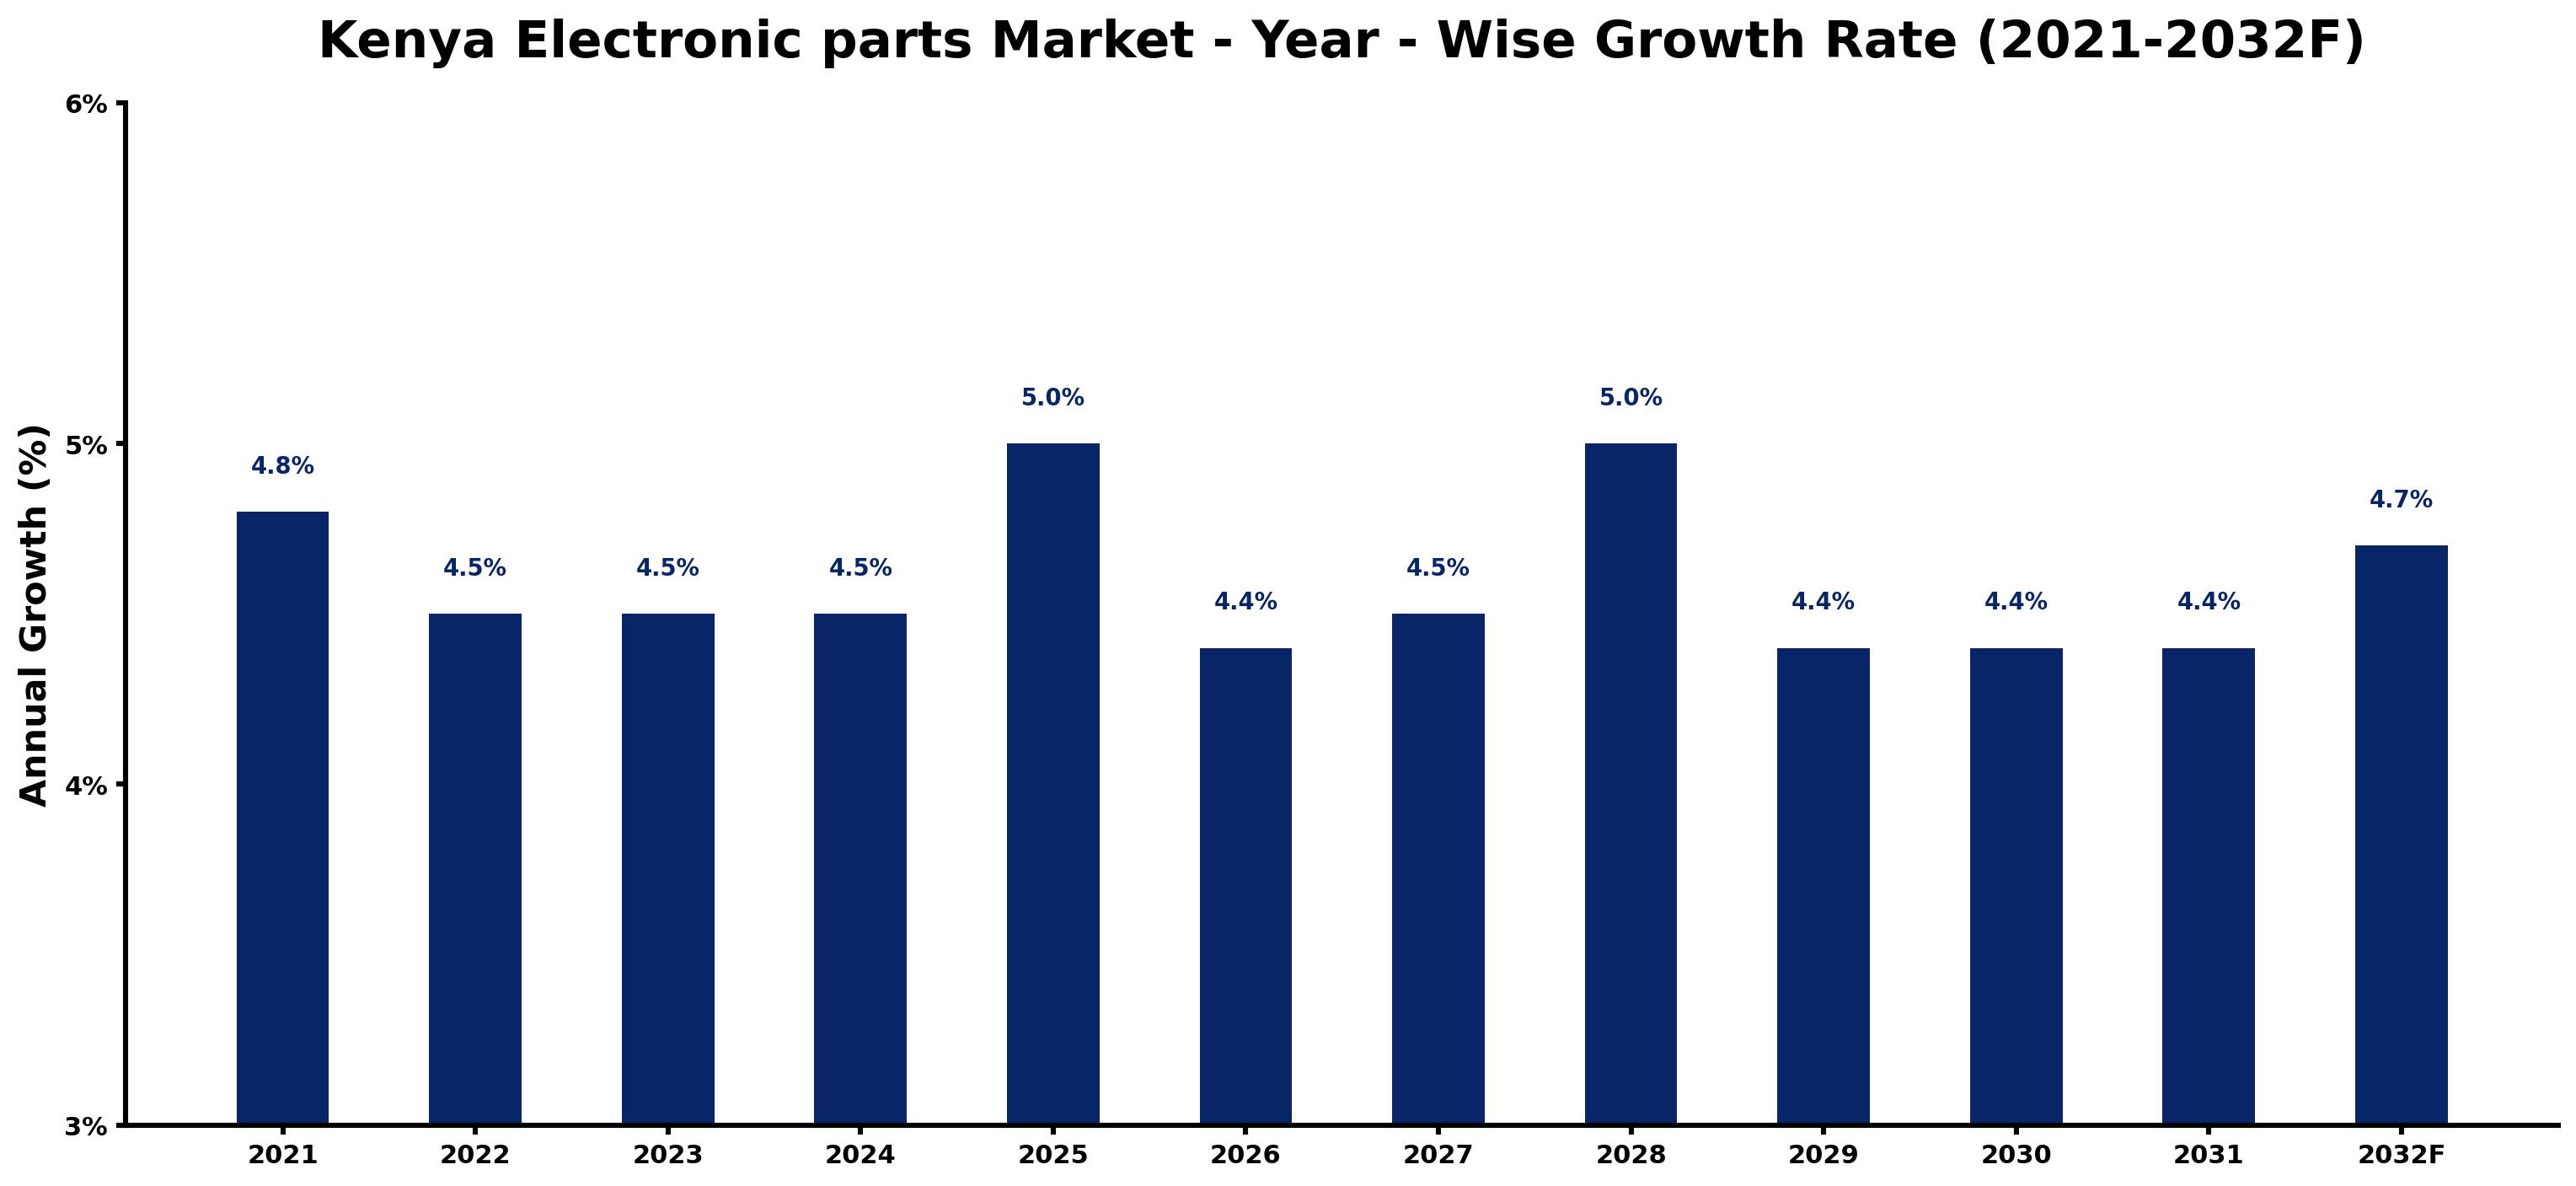
Kenya Electronic parts Market Growth Rate Analysis (2021-2032)
The Kenya electronic parts market has showcased stable growth, with a yearly increase of 4.8% in 2021, gradually stabilizing to around 4.5% from 2022 through 2024. This steady rise reflects a robust demand driven by advancements in technology and digitalization, as well as increased investments in infrastructure to support the burgeoning electronics sector. A slight uptick to 5.0% is anticipated in 2025, likely bolstered by energy transition efforts and consumer electronics demand. However, the market will see modest declines to 4.4% in the following years, suggesting some pressure from global supply chain challenges. Overall, as Kenya continues to embrace technological innovation, the electronic parts market is positioned for ongoing, though measured, expansion.
Kenya Electronic parts Market Year-wise Growth Rate and Key Drivers
This graph highlights how the Kenya Electronic parts Market has steadily grown over the past five years, supported by major growth factors.
The table below presents the year wise growth rates along with the key drivers influencing the market
| Year | Growth Rate | Major Drivers |
| 2021 | 4.8% | Growing smartphone penetration has created significant opportunities in electronic parts demand. |
| 2022 | 4.5% | Small businesses increasingly rely on local suppliers for electronic components and parts. |
| 2023 | 4.5% | E-commerce platforms have expanded access to electronic parts, fostering competitive pricing. |
| 2024 | 4.5% | Investment in renewable energy projects drives needs for specialized electronic components. |
| 2025 | 5.0% | Technological innovation in electric vehicles creates an emerging market for electronic parts. |
| 2026 | 4.4% | Integrated circuits and semiconductors become essential as consumer electronics proliferate. |
| 2027 | 4.5% | Smart city initiatives lead to heightened needs for smart electronic solutions in urban areas. |
| 2028 | 5.0% | Education programs in electronics boost local workforce skills, enhancing manufacturing capabilities. |
| 2029 | 4.4% | Government support for tech startups encourages innovation in electronic components sector. |
| 2030 | 4.4% | Sustainable practices reshape production methods, influencing electronic parts sourcing strategies. |
| 2031 | 4.4% | 5G technology rollout necessitates advanced electronic components for improved connectivity solutions. |
| 2032 | 4.7% | Global supply chain investments enhance local production capacities for electronic parts manufacturing. |
Note - Market size estimations and growth projections presented in this report are based on 6Wresearch's advanced forecasting approach, validated with industry datasets as of June 2026.
Kenya Electronic parts Market Synopsis
The Kenya Electronic parts Market is projected to reach 4.4% and witness significant growth during the forecast period (2026-2032). This growth trajectory is primarily fueled by escalating demand for consumer electronics, automotive components, and industrial machinery. Key factors propelling this market expansion include technological advancements, rising disposable incomes, and proactive government initiatives aimed at promoting the adoption of electronic devices across various sectors.
Kenya Electronic parts Market Growth Drivers
The Kenya Electronic parts Market is currently on an upward trend, driven by several critical factors:
- The rising consumer demand for electronics, including smartphones, computers, and household appliances, is stimulating growth in the electronic parts sector.
- Technological innovations and advancements are pushing manufacturers to develop more efficient and sophisticated electronic components, thereby enhancing market competitiveness.
- Increasing disposable incomes among the Kenyan population is facilitating higher expenditure on electronic devices, further driving the demand for electronic parts.
- Government policies that support the use of electronics in education and healthcare create a conducive environment for market growth.
- The growing automotive industry in Kenya necessitates the use of various electronic components in vehicles, which significantly contributes to the expansion of the electronic parts market.
Kenya Electronic parts Market Trends and Opportunities
In the current landscape, the Kenya Electronic parts Market is marked by notable trends that present lucrative opportunities for stakeholders:
- There is a clear shift towards the integration of advanced electronic components such as integrated circuits, sensors, and connectors, reflecting the market's adaptation to modern technological demands.
- The surge in renewable energy technologies, particularly solar power, is increasing the demand for electronic components necessary for solar panels and energy storage solutions.
- As digitalization continues to penetrate various sectors such as healthcare and agriculture, the need for IoT devices and smart technologies is fostering a robust demand for electronic parts.
- Local manufacturers are gaining traction, as there is a growing preference for locally sourced components, driven by initiatives aimed at reducing reliance on imports.
- The expansion of e-commerce platforms in Kenya is facilitating broader access to electronic parts, presenting an opportunity for manufacturers and distributors to capture new market segments.
Kenya Electronic parts Market Challenges and Restraints
Despite the growth potential, the Kenya Electronic parts Market faces several challenges that could impede progress:
- High import duties and taxes on electronic components elevate prices, which can limit accessibility for consumers and businesses alike.
- The prevalence of counterfeit products undermines consumer trust and poses significant risks to both businesses and the market's reputation.
- A lack of standardized quality control measures can result in variable product quality, further complicating market dynamics.
- Logistical challenges and limited infrastructure can delay distribution, affecting the timely delivery of electronic parts across regions.
- The competitive landscape is also intensified by cheaper imported products, making it difficult for local manufacturers to maintain market share based on pricing.
Kenya Electronic parts Market Investment Opportunities
The Kenya Electronic parts Market offers a range of investment opportunities that can be leveraged by businesses looking to capitalize on the sector's growth:
- Investing in the distribution of essential electronic components—such as semiconductors, resistors, and capacitors—can yield lucrative returns due to the rising demand within manufacturing sectors.
- Local manufacturing capabilities present an attractive avenue for investment, particularly with government incentives aimed at enhancing production and reducing import dependence.
- Providing value-added services, such as repair and maintenance for electronic devices, represents a viable business model as consumer electronics become increasingly prevalent.
- Investments in R&D for innovative electronic solutions can secure a competitive edge in a market characterized by rapid technological evolution.
- Collaborations with the government on initiatives that promote technological adoption can facilitate access to funding and resources, enhancing business viability.
Kenya Electronic parts Market Government Investment and Initiatives
The Kenyan government has played a proactive role in fostering the growth of the electronic parts market through various policies and initiatives:
- The elimination of import duties on raw materials for electronics manufacturing has significantly reduced costs, encouraging local production.
- Tax incentives, including reduced corporate tax rates for companies investing in the electronics sector, are designed to stimulate growth and attract foreign investment.
- Initiatives aimed at enhancing research and development in the electronics industry provide grants and funding opportunities for innovative projects, fostering a culture of innovation.
- Public spending on infrastructure improvements is aimed at enhancing logistics capabilities, which is crucial for efficient distribution of electronic parts across the country.
- The government is also working to create awareness about the importance of quality standards and certification processes within the electronics market.
Kenya Electronic parts Market Latest Developments (May 2025 - June 2026)
Recent developments in the Kenya Electronic parts Market reflect a dynamic and evolving industry landscape:
- The market has witnessed an uptick in local manufacturing initiatives, supported by government policies aimed at enhancing domestic production capabilities.
- New partnerships between local entities and foreign investors are emerging, facilitating knowledge transfer and technological advancements in electronic components.
- There is an increasing focus on sustainability, with manufacturers exploring eco-friendly materials for electronic components as part of a broader trend towards renewable energy.
- Consumer demand for smart and interconnected devices continues to rise, prompting manufacturers to innovate their product offerings to meet this expectation.
- Regulatory bodies are working to combat the challenges posed by counterfeit products through stricter enforcement of quality control measures and standards.
Kenya Electronic parts Market - Key Attractiveness of the Report
- 10 Years of Market Numbers
- Historical Data Starting from 2022 to 2025
- Base Year: 2025
- Forecast Data until 2032
- Key Performance Indicators Impacting the Market
- Major Upcoming Developments and Projects
Key Highlights of the Report:
- Kenya Electronic parts Market Outlook
- Market Size of Kenya Electronic parts Market, 2025
- Forecast of Kenya Electronic parts Market, 2032F
- Historical Data and Forecast of Kenya Electronic parts Revenues & Volume for the Period 2022-2032F
- Kenya Electronic parts Market Trend Evolution
- Kenya Electronic parts Market Drivers and Challenges
- Kenya Electronic parts Price Trends
- Kenya Electronic parts Porter's Five Forces
- Kenya Electronic parts Industry Life Cycle
- Historical Data and Forecast of Kenya Electronic parts Market Revenues & Volume By Type for the Period 2022-2032F
- Historical Data and Forecast of Kenya Electronic parts Market Revenues & Volume By Passive for the Period 2022-2032F
- Historical Data and Forecast of Kenya Electronic parts Market Revenues & Volume By Active for the Period 2022-2032F
- Historical Data and Forecast of Kenya Electronic parts Market Revenues & Volume By Electro Mechanic for the Period 2022-2032F
- Historical Data and Forecast of Kenya Electronic parts Market Revenues & Volume By Application for the Period 2022-2032F
- Historical Data and Forecast of Kenya Electronic parts Market Revenues & Volume By Automotive for the Period 2022-2032F
- Historical Data and Forecast of Kenya Electronic parts Market Revenues & Volume By Communications for the Period 2022-2032F
- Historical Data and Forecast of Kenya Electronic parts Market Revenues & Volume By Computing Applications for the Period 2022-2032F
- Historical Data and Forecast of Kenya Electronic parts Market Revenues & Volume By Others for the Period 2022-2032F
- Kenya Electronic parts Import Export Trade Statistics
- Market Opportunity Assessment By Type
- Market Opportunity Assessment By Application
- Kenya Electronic parts Top Companies Market Share
- Kenya Electronic parts Competitive Benchmarking By Technical and Operational Parameters
- Kenya Electronic parts Company Profiles
- Kenya Electronic parts Key Strategic Recommendations
Frequently Asked Questions About the Market Study (FAQs):
The growth is primarily driven by increasing demand for consumer electronics, advancements in technology, and supportive government policies aimed at enhancing local manufacturing capabilities.
Challenges include high import duties, the prevalence of counterfeit products, and logistical issues that hinder the efficient distribution of electronic parts.
Opportunities include investing in local manufacturing, distribution of electronic components, and providing repair services related to consumer electronics.
The government is implementing policies such as reducing import duties, offering tax incentives for investments, and supporting R&D initiatives to boost local production in the electronics sector.
6Wresearch actively monitors the Kenya Electronic parts Market and publishes its comprehensive annual report, highlighting emerging trends, growth drivers, revenue analysis, and forecast outlook. Our insights help businesses to make data-backed strategic decisions with ongoing market dynamics. Our analysts track relevent industries related to the Kenya Electronic parts Market, allowing our clients with actionable intelligence and reliable forecasts tailored to emerging regional needs.
Yes, we provide customisation as per your requirements. To learn more, feel free to contact us on sales@6wresearch.com
1 Executive Summary |
2 Introduction |
2.1 Key Highlights of the Report |
2.2 Report Description |
2.3 Market Scope & Segmentation |
2.4 Research Methodology |
2.5 Assumptions |
3 Kenya Electronic parts Market Overview |
3.1 Kenya Country Macro Economic Indicators |
3.2 Kenya Electronic parts Market Revenues & Volume, 2022 & 2032F |
3.3 Kenya Electronic parts Market - Industry Life Cycle |
3.4 Kenya Electronic parts Market - Porter's Five Forces |
3.5 Kenya Electronic parts Market Revenues & Volume Share, By Type, 2022 & 2032F |
3.6 Kenya Electronic parts Market Revenues & Volume Share, By Application, 2022 & 2032F |
4 Kenya Electronic parts Market Dynamics |
4.1 Impact Analysis |
4.2 Market Drivers |
4.3 Market Restraints |
5 Kenya Electronic parts Market Trends |
6 Kenya Electronic parts Market, By Types |
6.1 Kenya Electronic parts Market, By Type |
6.1.1 Overview and Analysis |
6.1.2 Kenya Electronic parts Market Revenues & Volume, By Type, 2022-2032F |
6.1.3 Kenya Electronic parts Market Revenues & Volume, By Passive, 2022-2032F |
6.1.4 Kenya Electronic parts Market Revenues & Volume, By Active, 2022-2032F |
6.1.5 Kenya Electronic parts Market Revenues & Volume, By Electro Mechanic, 2022-2032F |
6.2 Kenya Electronic parts Market, By Application |
6.2.1 Overview and Analysis |
6.2.2 Kenya Electronic parts Market Revenues & Volume, By Automotive, 2022-2032F |
6.2.3 Kenya Electronic parts Market Revenues & Volume, By Communications, 2022-2032F |
6.2.4 Kenya Electronic parts Market Revenues & Volume, By Computing Applications, 2022-2032F |
6.2.5 Kenya Electronic parts Market Revenues & Volume, By Others, 2022-2032F |
7 Kenya Electronic parts Market Import-Export Trade Statistics |
7.1 Kenya Electronic parts Market Export to Major Countries |
7.2 Kenya Electronic parts Market Imports from Major Countries |
8 Kenya Electronic parts Market Key Performance Indicators |
9 Kenya Electronic parts Market - Opportunity Assessment |
9.1 Kenya Electronic parts Market Opportunity Assessment, By Type, 2022 & 2032F |
9.2 Kenya Electronic parts Market Opportunity Assessment, By Application, 2022 & 2032F |
10 Kenya Electronic parts Market - Competitive Landscape |
10.1 Kenya Electronic parts Market Revenue Share, By Companies, 2025 |
10.2 Kenya Electronic parts Market Competitive Benchmarking, By Operating and Technical Parameters |
11 Company Profiles |
12 Recommendations |
13 Disclaimer |
Global Go To Market Strategy - 2030
Export potential enables firms to identify high-growth global markets with greater confidence by combining advanced trade intelligence with a structured quantitative methodology. The framework analyzes emerging demand trends and country-level import patterns while integrating macroeconomic and trade datasets such as GDP and population forecasts, bilateral import–export flows, tariff structures, elasticity differentials between developed and developing economies, geographic distance, and import demand projections. Using weighted trade values from 2020–2024 as the base period to project country-to-country export potential for 2030, these inputs are operationalized through calculated drivers such as gravity model parameters, tariff impact factors, and projected GDP per-capita growth. Through an analysis of hidden potentials, demand hotspots, and market conditions that are most favorable to success, this method enables firms to focus on target countries, maximize returns, and global expansion with data, backed by accuracy.
By factoring in the projected importer demand gap that is currently unmet and could be potential opportunity, it identifies the potential for the Exporter (Country) among 190 countries, against the general trade analysis, which identifies the biggest importer or exporter.
To discover high-growth global markets and optimize your business strategy:
Click Here
Pricing
- Single User License$ 1,995
- Department License$ 2,400
- Site License$ 3,120
- Global License$ 3,795

Leadership Perspectives from Industry Events
Search
Thought Leadership and Analyst Meet


Our Clients
6WResearch In News
- India Air Conditioner Market Set for Strong Rebound in 2026 After Weather-Led Correction and GST-Driven Recovery: 6Wresearch
- ADAS in India: How Automatic Emergency Braking, Blind Spot Detection & Driver Monitoring are Transforming Road Safety
- Doha a strategic location for EV manufacturing hub: IPA Qatar
- Demand for luxury TVs surging in the GCC, says Samsung
- Empowering Growth: The Thriving Journey of Bangladesh’s Cable Industry
- Demand for luxury TVs surging in the GCC, says Samsung
Latest Reports
- Nicaragua RPG Gaming Market (2026-2032)
- New Zealand RPG Gaming Market (2026-2032)
- Netherlands RPG Gaming Market (2026-2032)
- Nauru RPG Gaming Market (2026-2032)
- Namibia RPG Gaming Market (2026-2032)
- Mozambique RPG Gaming Market (2026-2032)
- Montenegro RPG Gaming Market (2026-2032)
- Mongolia RPG Gaming Market (2026-2032)
- Monaco RPG Gaming Market (2026-2032)
- Micronesia RPG Gaming Market (2026-2032)
Industry Events and Analyst Meet

HIMTEX 2026

India Refining Summit 2026

India EV Show 2026

EV tech India Expo 2026

Auto Tech Asia 2026
Whitepaper
- Middle East & Africa Commercial Security Market Click here to view more.
- Middle East & Africa Fire Safety Systems & Equipment Market Click here to view more.
- GCC Drone Market Click here to view more.
- Middle East Lighting Fixture Market Click here to view more.
- GCC Physical & Perimeter Security Market Click here to view more.