Kenya Epoxidized Soybean Oil Market Outlook | Share, COVID-19 IMPACT, Trends, Companies, Value, Growth, Revenue, Analysis, Forecast, Size & Industry
Market Forecast By Raw Material (Soybean Oil, Hydrogen Peroxide, Formic Acid, Acetic Acid), By Application (Plasticizers, Pigment Dispersion Agent, Flavours & Fragrances, UV Care Applications, Fuel Additives, Surfactants, Lubricants, Others), By End-Users (Food & Beverages, Personal & Healthcare, Adhesives & Sealants, Automotive & Transportation, Others) And Competitive Landscape
| Product Code: ETC128754 | Publication Date: Jun 2021 | Updated Date: Jun 2025 | Product Type: Report | |
| Publisher: 6Wresearch | Author: Vasudha | No. of Pages: 70 | No. of Figures: 35 | No. of Tables: 5 |
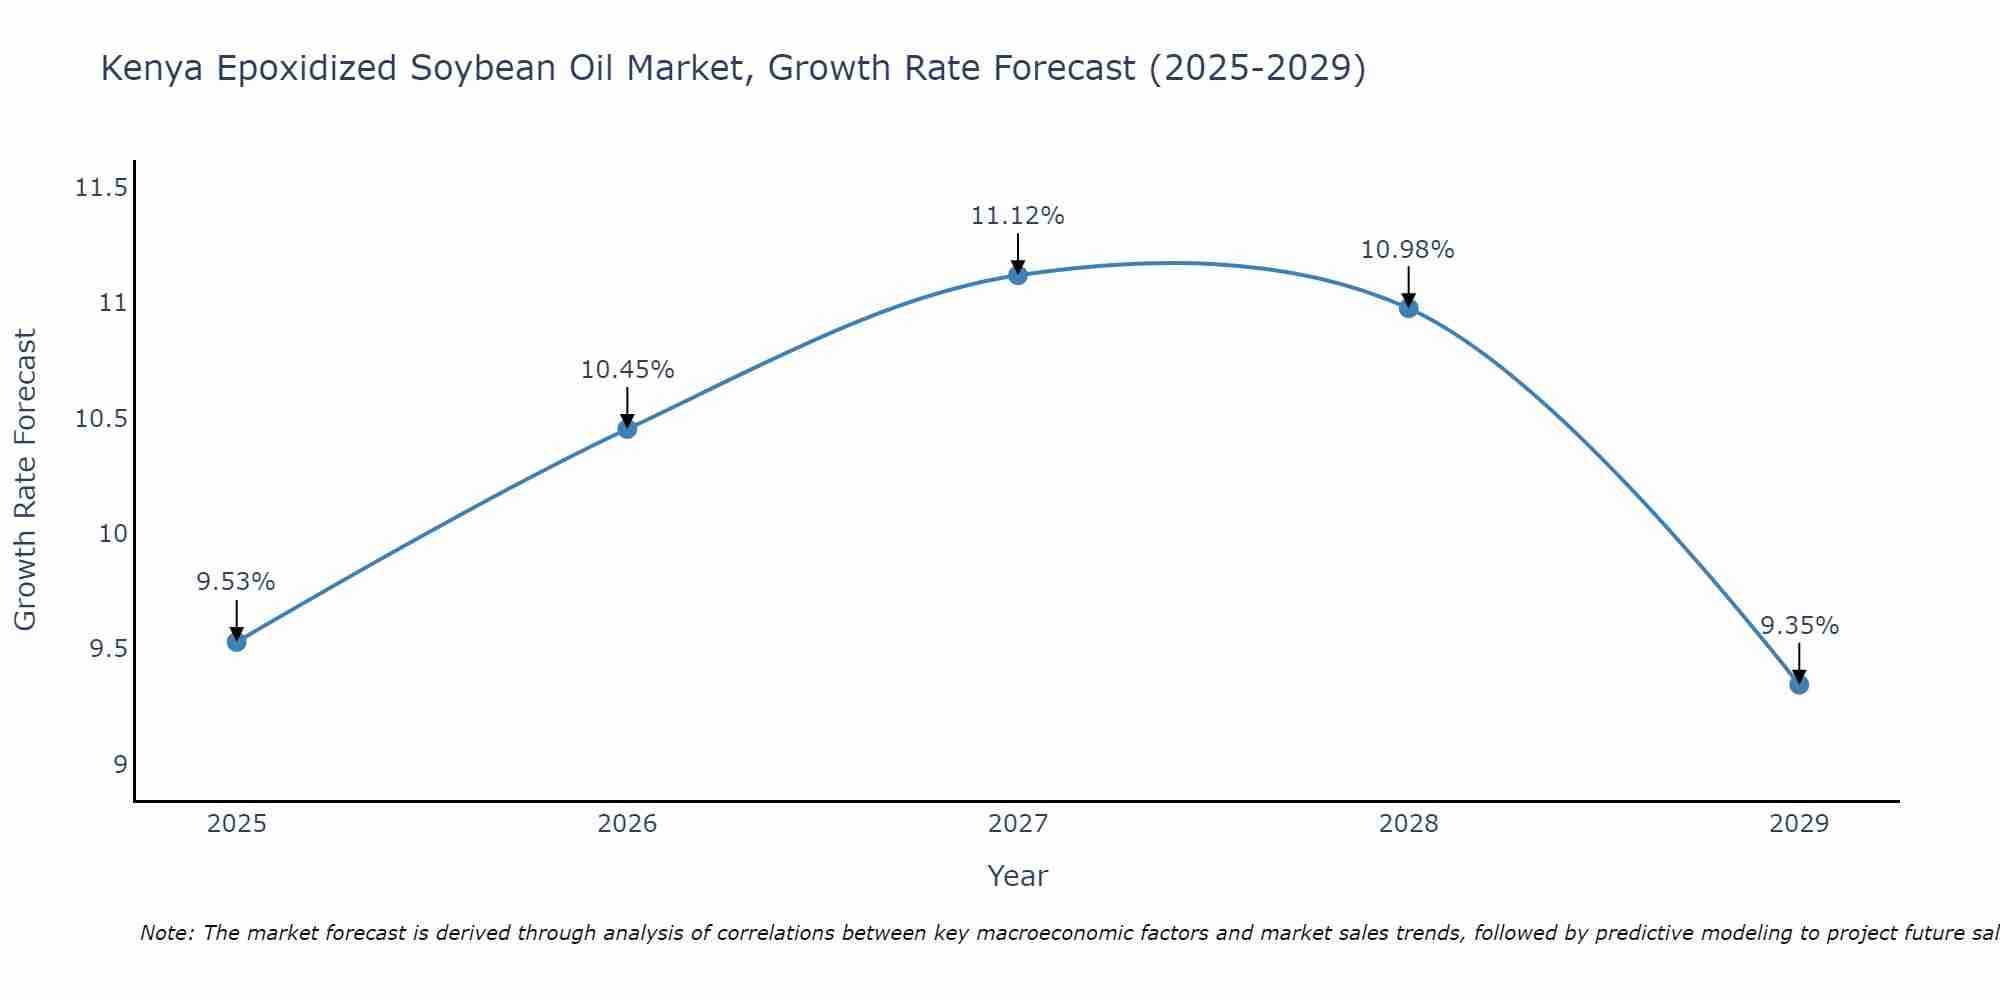
Kenya Epoxidized Soybean Oil Market Size Growth Rate
The Kenya Epoxidized Soybean Oil Market is projected to witness mixed growth rate patterns during 2025 to 2029. Starting at 9.53% in 2025, the market peaks at 11.12% in 2027, and settles at 9.35% by 2029.
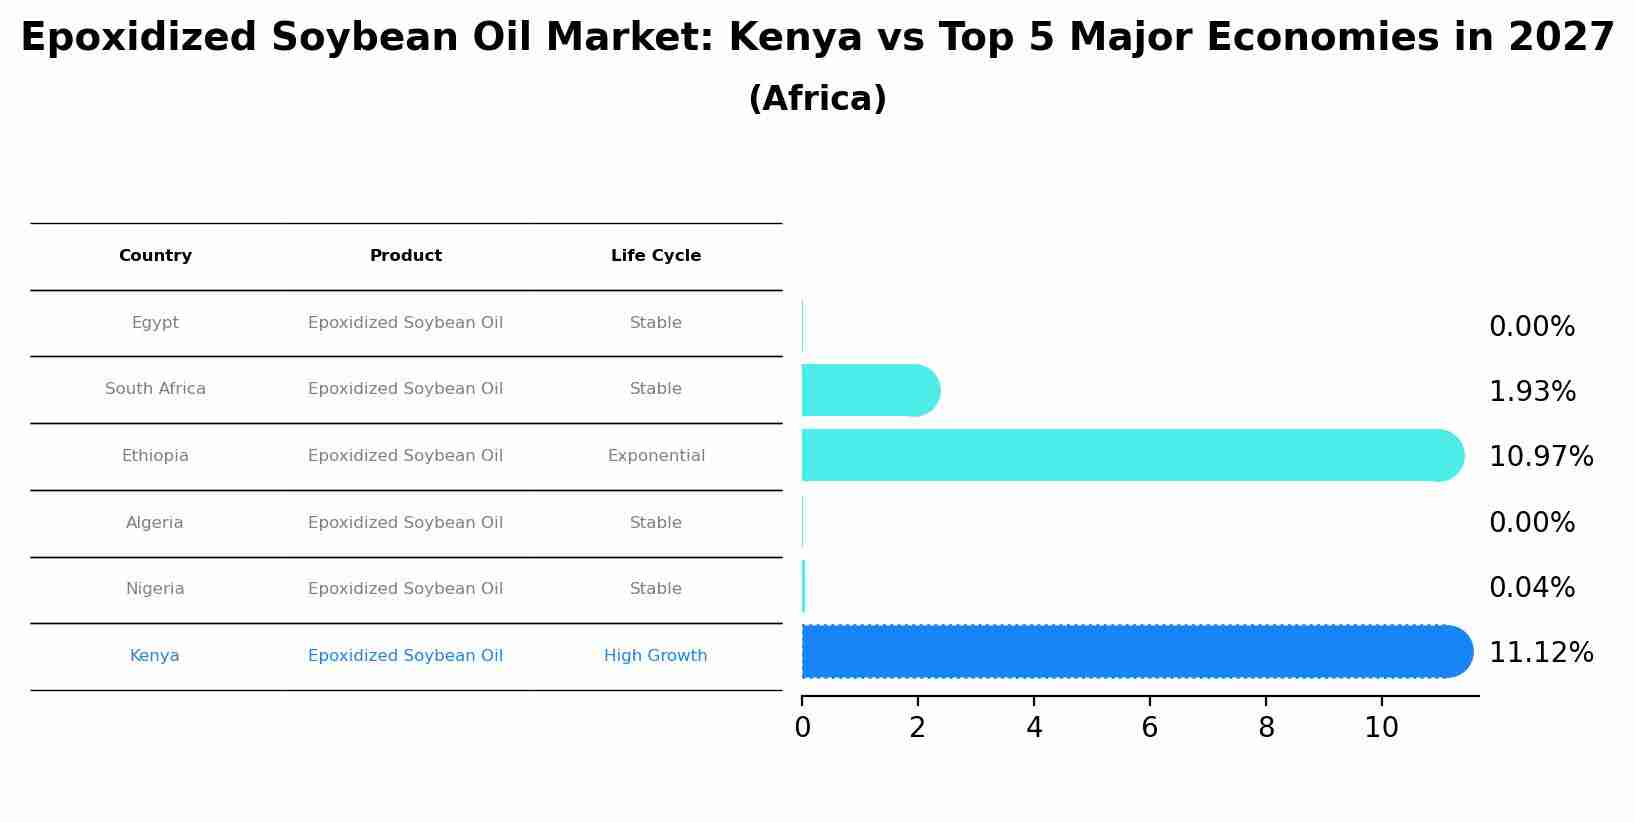
Epoxidized Soybean Oil Market: Kenya vs Top 5 Major Economies in 2027 (Africa)
The Epoxidized Soybean Oil market in Kenya is projected to grow at a high growth rate of 11.12% by 2027, highlighting the country's increasing focus on advanced technologies within the Africa region, where Egypt holds the dominant position, followed closely by South Africa, Ethiopia, Algeria and Nigeria, shaping overall regional demand.
Kenya Epoxidized Soybean Oil Market Overview
The Kenya Epoxidized Soybean Oil Market is experiencing steady growth driven by the increasing demand for eco-friendly plasticizers in various industries such as food packaging, automotive, and healthcare. Epoxidized soybean oil is preferred over traditional phthalate-based plasticizers due to its non-toxic nature and sustainability aspects. The market is also benefiting from the rising awareness about the harmful effects of conventional plasticizers on human health and the environment. Key players in the Kenya Epoxidized Soybean Oil Market are focusing on product innovation, strategic partnerships, and marketing initiatives to gain a competitive edge. Government regulations promoting the use of bio-based chemicals further support the market growth, with a shift towards sustainable solutions driving the adoption of epoxidized soybean oil in various applications.
Kenya Epoxidized Soybean Oil Market Trends
The Kenya Epoxidized Soybean Oil market is experiencing growth due to the increasing demand for eco-friendly plasticizers in various industries such as food packaging, automotive, and healthcare. Consumers are becoming more conscious of the environmental impact of chemicals used in products, leading to a shift towards bio-based alternatives like epoxidized soybean oil. The market is also benefiting from the government initiatives promoting the use of sustainable materials and the growing awareness of health hazards associated with traditional plasticizers. Key players in the market are focusing on product innovations, such as high-performance epoxidized soybean oil grades, to cater to the specific requirements of different end-use industries. Overall, the Kenya Epoxidized Soybean Oil market is poised for steady growth in the coming years as sustainability and health considerations continue to drive consumer choices.
Kenya Epoxidized Soybean Oil Market Challenges
In the Kenya Epoxidized Soybean Oil Market, challenges primarily include limited awareness and understanding of the product among consumers and industrial users, leading to slow adoption rates. Additionally, there is a lack of standardized regulations and quality control measures, which can hinder market growth and trust among stakeholders. The availability of cheaper alternatives and fluctuating prices of raw materials also present challenges in maintaining competitiveness for manufacturers and suppliers. Moreover, logistical issues, such as transportation and storage constraints, can impact the supply chain efficiency and overall market distribution. Addressing these challenges would require targeted marketing efforts, industry collaboration for setting quality standards, and strategic partnerships to optimize the supply chain in the Kenya Epoxidized Soybean Oil Market.
Kenya Epoxidized Soybean Oil Market Investment Opportunities
The Kenya Epoxidized Soybean Oil market presents promising investment opportunities due to the increasing demand for eco-friendly plasticizers in various industries such as food packaging, pharmaceuticals, and automotive. With the growing awareness of the harmful effects of traditional plasticizers, there is a shift towards using safer alternatives like epoxidized soybean oil. Investing in this market could be lucrative as the government and consumers are increasingly prioritizing sustainability and environmental protection. Additionally, the expanding industrial sector in Kenya provides a favorable environment for the growth of the Epoxidized Soybean Oil market. Potential investors can consider partnering with local manufacturers, conducting market research to identify specific industry needs, and exploring opportunities for product innovation and differentiation to capitalize on this growing market segment.
Kenya Epoxidized Soybean Oil Market Government Policy
In Kenya, the government has implemented policies aimed at promoting the use of bio-based products, including epoxidized soybean oil (ESO), as part of efforts to reduce reliance on traditional petroleum-based chemicals. These policies include providing incentives and subsidies to encourage the production and consumption of ESO, as well as setting quality standards and regulations to ensure the safety and efficacy of ESO products in the market. Additionally, the government has been actively supporting research and development initiatives to enhance the production processes and explore new applications for ESO in various industries. Overall, the government`s policies are geared towards fostering a sustainable and environmentally friendly market for ESO in Kenya.
Kenya Epoxidized Soybean Oil Market Future Outlook
The Kenya Epoxidized Soybean Oil market is poised for significant growth in the coming years due to increasing awareness about the health benefits and eco-friendly nature of soybean oil-based products. With a rising trend towards sustainable and renewable sources in various industries such as food and beverages, pharmaceuticals, and plastics, the demand for epoxidized soybean oil is expected to surge. Additionally, government initiatives promoting the use of bio-based products and stringent regulations on conventional plasticizers are driving the market growth. Key players are focusing on expanding their product portfolios and investing in research and development to cater to the growing demand for eco-friendly alternatives. Overall, the future outlook for the Kenya Epoxidized Soybean Oil market is promising, with opportunities for market expansion and innovation.
Key Highlights of the Report:
- Kenya Epoxidized Soybean Oil Market Outlook
- Market Size of Kenya Epoxidized Soybean Oil Market, 2021
- Forecast of Kenya Epoxidized Soybean Oil Market, 2027
- Historical Data and Forecast of Kenya Epoxidized Soybean Oil Revenues & Volume for the Period 2018 - 2027
- Kenya Epoxidized Soybean Oil Market Trend Evolution
- Kenya Epoxidized Soybean Oil Market Drivers and Challenges
- Kenya Epoxidized Soybean Oil Price Trends
- Kenya Epoxidized Soybean Oil Porter's Five Forces
- Kenya Epoxidized Soybean Oil Industry Life Cycle
- Historical Data and Forecast of Kenya Epoxidized Soybean Oil Market Revenues & Volume By Raw Material for the Period 2018 - 2027
- Historical Data and Forecast of Kenya Epoxidized Soybean Oil Market Revenues & Volume By Soybean Oil for the Period 2018 - 2027
- Historical Data and Forecast of Kenya Epoxidized Soybean Oil Market Revenues & Volume By Hydrogen Peroxide for the Period 2018 - 2027
- Historical Data and Forecast of Kenya Epoxidized Soybean Oil Market Revenues & Volume By Formic Acid for the Period 2018 - 2027
- Historical Data and Forecast of Kenya Epoxidized Soybean Oil Market Revenues & Volume By Acetic Acid for the Period 2018 - 2027
- Historical Data and Forecast of Kenya Epoxidized Soybean Oil Market Revenues & Volume By Application for the Period 2018 - 2027
- Historical Data and Forecast of Kenya Epoxidized Soybean Oil Market Revenues & Volume By Plasticizers for the Period 2018 - 2027
- Historical Data and Forecast of Kenya Epoxidized Soybean Oil Market Revenues & Volume By Pigment Dispersion Agent for the Period 2018 - 2027
- Historical Data and Forecast of Kenya Epoxidized Soybean Oil Market Revenues & Volume By Flavours & Fragrances for the Period 2018 - 2027
- Historical Data and Forecast of Kenya Epoxidized Soybean Oil Market Revenues & Volume By UV Care Applications for the Period 2018 - 2027
- Historical Data and Forecast of Kenya Epoxidized Soybean Oil Market Revenues & Volume By Fuel Additives for the Period 2018 - 2027
- Historical Data and Forecast of Kenya Epoxidized Soybean Oil Market Revenues & Volume By Surfactants for the Period 2018 - 2027
- Historical Data and Forecast of Kenya Epoxidized Soybean Oil Market Revenues & Volume By Lubricants for the Period 2018 - 2027
- Historical Data and Forecast of Kenya Epoxidized Soybean Oil Market Revenues & Volume By Others for the Period 2018 - 2027
- Historical Data and Forecast of Kenya Epoxidized Soybean Oil Market Revenues & Volume By End-Users for the Period 2018 - 2027
- Historical Data and Forecast of Kenya Epoxidized Soybean Oil Market Revenues & Volume By Food & Beverages for the Period 2018 - 2027
- Historical Data and Forecast of Kenya Epoxidized Soybean Oil Market Revenues & Volume By Personal & Healthcare for the Period 2018 - 2027
- Historical Data and Forecast of Kenya Epoxidized Soybean Oil Market Revenues & Volume By Adhesives & Sealants for the Period 2018 - 2027
- Historical Data and Forecast of Kenya Epoxidized Soybean Oil Market Revenues & Volume By Automotive & Transportation for the Period 2018 - 2027
- Historical Data and Forecast of Kenya Epoxidized Soybean Oil Market Revenues & Volume By Others for the Period 2018 - 2027
- Kenya Epoxidized Soybean Oil Import Export Trade Statistics
- Market Opportunity Assessment By Raw Material
- Market Opportunity Assessment By Application
- Market Opportunity Assessment By End-Users
- Kenya Epoxidized Soybean Oil Top Companies Market Share
- Kenya Epoxidized Soybean Oil Competitive Benchmarking By Technical and Operational Parameters
- Kenya Epoxidized Soybean Oil Company Profiles
- Kenya Epoxidized Soybean Oil Key Strategic Recommendations
Frequently Asked Questions About the Market Study (FAQs):
6Wresearch actively monitors the Kenya Epoxidized Soybean Oil Market and publishes its comprehensive annual report, highlighting emerging trends, growth drivers, revenue analysis, and forecast outlook. Our insights help businesses to make data-backed strategic decisions with ongoing market dynamics. Our analysts track relevent industries related to the Kenya Epoxidized Soybean Oil Market, allowing our clients with actionable intelligence and reliable forecasts tailored to emerging regional needs.
Yes, we provide customisation as per your requirements. To learn more, feel free to contact us on sales@6wresearch.com
Kenya Epoxidized Soybean Oil |
1 Executive Summary |
2 Introduction |
2.1 Key Highlights of the Report |
2.2 Report Description |
2.3 Market Scope & Segmentation |
2.4 Research Methodology |
2.5 Assumptions |
3 Kenya Epoxidized Soybean Oil Market Overview |
3.1 Kenya Country Macro Economic Indicators |
3.2 Kenya Epoxidized Soybean Oil Market Revenues & Volume, 2021 & 2027F |
3.3 Kenya Epoxidized Soybean Oil Market - Industry Life Cycle |
3.4 Kenya Epoxidized Soybean Oil Market - Porter's Five Forces |
3.5 Kenya Epoxidized Soybean Oil Market Revenues & Volume Share, By Raw Material, 2021 & 2027F |
3.6 Kenya Epoxidized Soybean Oil Market Revenues & Volume Share, By Application, 2021 & 2027F |
3.7 Kenya Epoxidized Soybean Oil Market Revenues & Volume Share, By End-Users, 2021 & 2027F |
4 Kenya Epoxidized Soybean Oil Market Dynamics |
4.1 Impact Analysis |
4.2 Market Drivers |
4.3 Market Restraints |
5 Kenya Epoxidized Soybean Oil Market Trends |
6 Kenya Epoxidized Soybean Oil Market, By Types |
6.1 Kenya Epoxidized Soybean Oil Market, By Raw Material |
6.1.1 Overview and Analysis |
6.1.2 Kenya Epoxidized Soybean Oil Market Revenues & Volume, By Raw Material, 2018 - 2027F |
6.1.3 Kenya Epoxidized Soybean Oil Market Revenues & Volume, By Soybean Oil, 2018 - 2027F |
6.1.4 Kenya Epoxidized Soybean Oil Market Revenues & Volume, By Hydrogen Peroxide, 2018 - 2027F |
6.1.5 Kenya Epoxidized Soybean Oil Market Revenues & Volume, By Formic Acid, 2018 - 2027F |
6.1.6 Kenya Epoxidized Soybean Oil Market Revenues & Volume, By Acetic Acid, 2018 - 2027F |
6.2 Kenya Epoxidized Soybean Oil Market, By Application |
6.2.1 Overview and Analysis |
6.2.2 Kenya Epoxidized Soybean Oil Market Revenues & Volume, By Plasticizers, 2018 - 2027F |
6.2.3 Kenya Epoxidized Soybean Oil Market Revenues & Volume, By Pigment Dispersion Agent, 2018 - 2027F |
6.2.4 Kenya Epoxidized Soybean Oil Market Revenues & Volume, By Flavours & Fragrances, 2018 - 2027F |
6.2.5 Kenya Epoxidized Soybean Oil Market Revenues & Volume, By UV Care Applications, 2018 - 2027F |
6.2.6 Kenya Epoxidized Soybean Oil Market Revenues & Volume, By Fuel Additives , 2018 - 2027F |
6.2.7 Kenya Epoxidized Soybean Oil Market Revenues & Volume, By Surfactants, 2018 - 2027F |
6.2.8 Kenya Epoxidized Soybean Oil Market Revenues & Volume, By Others, 2018 - 2027F |
6.2.9 Kenya Epoxidized Soybean Oil Market Revenues & Volume, By Others, 2018 - 2027F |
6.3 Kenya Epoxidized Soybean Oil Market, By End-Users |
6.3.1 Overview and Analysis |
6.3.2 Kenya Epoxidized Soybean Oil Market Revenues & Volume, By Food & Beverages, 2018 - 2027F |
6.3.3 Kenya Epoxidized Soybean Oil Market Revenues & Volume, By Personal & Healthcare, 2018 - 2027F |
6.3.4 Kenya Epoxidized Soybean Oil Market Revenues & Volume, By Adhesives & Sealants, 2018 - 2027F |
6.3.5 Kenya Epoxidized Soybean Oil Market Revenues & Volume, By Automotive & Transportation, 2018 - 2027F |
6.3.6 Kenya Epoxidized Soybean Oil Market Revenues & Volume, By Others, 2018 - 2027F |
7 Kenya Epoxidized Soybean Oil Market Import-Export Trade Statistics |
7.1 Kenya Epoxidized Soybean Oil Market Export to Major Countries |
7.2 Kenya Epoxidized Soybean Oil Market Imports from Major Countries |
8 Kenya Epoxidized Soybean Oil Market Key Performance Indicators |
9 Kenya Epoxidized Soybean Oil Market - Opportunity Assessment |
9.1 Kenya Epoxidized Soybean Oil Market Opportunity Assessment, By Raw Material, 2021 & 2027F |
9.2 Kenya Epoxidized Soybean Oil Market Opportunity Assessment, By Application, 2021 & 2027F |
9.3 Kenya Epoxidized Soybean Oil Market Opportunity Assessment, By End-Users, 2021 & 2027F |
10 Kenya Epoxidized Soybean Oil Market - Competitive Landscape |
10.1 Kenya Epoxidized Soybean Oil Market Revenue Share, By Companies, 2021 |
10.2 Kenya Epoxidized Soybean Oil Market Competitive Benchmarking, By Operating and Technical Parameters |
11 Company Profiles |
12 Recommendations |
13 Disclaimer |
Global Go To Market Strategy - 2030
Export potential enables firms to identify high-growth global markets with greater confidence by combining advanced trade intelligence with a structured quantitative methodology. The framework analyzes emerging demand trends and country-level import patterns while integrating macroeconomic and trade datasets such as GDP and population forecasts, bilateral import–export flows, tariff structures, elasticity differentials between developed and developing economies, geographic distance, and import demand projections. Using weighted trade values from 2020–2024 as the base period to project country-to-country export potential for 2030, these inputs are operationalized through calculated drivers such as gravity model parameters, tariff impact factors, and projected GDP per-capita growth. Through an analysis of hidden potentials, demand hotspots, and market conditions that are most favorable to success, this method enables firms to focus on target countries, maximize returns, and global expansion with data, backed by accuracy.
By factoring in the projected importer demand gap that is currently unmet and could be potential opportunity, it identifies the potential for the Exporter (Country) among 190 countries, against the general trade analysis, which identifies the biggest importer or exporter.
To discover high-growth global markets and optimize your business strategy:
Click Here
Pricing
- Single User License$ 1,995
- Department License$ 2,400
- Site License$ 3,120
- Global License$ 3,795

Leadership Perspectives from Industry Events
Search
Thought Leadership and Analyst Meet


Our Clients
6WResearch In News
- India Air Conditioner Market Set for Strong Rebound in 2026 After Weather-Led Correction and GST-Driven Recovery: 6Wresearch
- ADAS in India: How Automatic Emergency Braking, Blind Spot Detection & Driver Monitoring are Transforming Road Safety
- Doha a strategic location for EV manufacturing hub: IPA Qatar
- Demand for luxury TVs surging in the GCC, says Samsung
- Empowering Growth: The Thriving Journey of Bangladesh’s Cable Industry
- Demand for luxury TVs surging in the GCC, says Samsung
Latest Reports
- Nicaragua RPG Gaming Market (2026-2032)
- New Zealand RPG Gaming Market (2026-2032)
- Netherlands RPG Gaming Market (2026-2032)
- Nauru RPG Gaming Market (2026-2032)
- Namibia RPG Gaming Market (2026-2032)
- Mozambique RPG Gaming Market (2026-2032)
- Montenegro RPG Gaming Market (2026-2032)
- Mongolia RPG Gaming Market (2026-2032)
- Monaco RPG Gaming Market (2026-2032)
- Micronesia RPG Gaming Market (2026-2032)
Industry Events and Analyst Meet

HIMTEX 2026

India Refining Summit 2026

India EV Show 2026

EV tech India Expo 2026

Auto Tech Asia 2026
Whitepaper
- Middle East & Africa Commercial Security Market Click here to view more.
- Middle East & Africa Fire Safety Systems & Equipment Market Click here to view more.
- GCC Drone Market Click here to view more.
- Middle East Lighting Fixture Market Click here to view more.
- GCC Physical & Perimeter Security Market Click here to view more.