Kenya Expanded Clay Market (2026-2032) Outlook | Growth, Revenue, Industry, Value, Share, Analysis, Size, Companies, Forecast & Trends
Market Forecast By Types (Up to 250 kg/mA, 250-280 kg/mA, 280-330 kg/mA, 330-500 kg/mA, Above 500 kg/mA), By Applications (Residential Building, Commercial Building, Infrastructure, Others) And Competitive Landscape
| Product Code: ETC274610 | Publication Date: Aug 2022 | Updated Date: Jul 2026 | Product Type: Market Research Report | |
| Publisher: 6Wresearch | Author: Ravi Bhandari | No. of Pages: 75 | No. of Figures: 35 | No. of Tables: 20 |
Kenya Expanded Clay Market Size, Share & Growth Rate
The Kenya Expanded Clay Market was estimated at USD 544 Million in 2025 and is projected to reach USD 775 Million by 2032, growing at a CAGR of 5.2% from 2026 to 2032. This upward trajectory is primarily driven by the burgeoning construction sector in Kenya, where there is an increasing shift towards lightweight and sustainable building materials. The growing urbanization and substantial infrastructure projects across the country are fueling the demand for expanded clay products, as they offer significant advantages in terms of energy efficiency, fire resistance, and overall durability.
Kenya Expanded Clay Market Growth Rate Analysis (2021-2032)
The Kenya Expanded Clay market has displayed stable growth, with an impressive annual rate of 6.1% observed in 2023, following a solid 6.0% in 2021 and 5.8% in 2022. Increased investments in the construction sector, fueled by government's infrastructural developments and energy transition initiatives, have significantly driven demand for lightweight and durable materials like expanded clay. Although growth slightly moderated to 6.2% in 2025, it rebounded to 6.4% in 2024, reflecting a strong consumer preference for sustainable construction practices. Anticipated fluctuations, such as a dip to 5.8% in 2031 and 5.9% in 2030, may arise from market saturation and external economic pressures. Overall, the sector remains robust against a backdrop of evolving industrial standards and digitalization trends.
Kenya Expanded Clay Market Year-wise Growth Rate and Key Drivers
This graph highlights how the Kenya Expanded Clay Market has steadily grown over the years, supported by major growth factors.
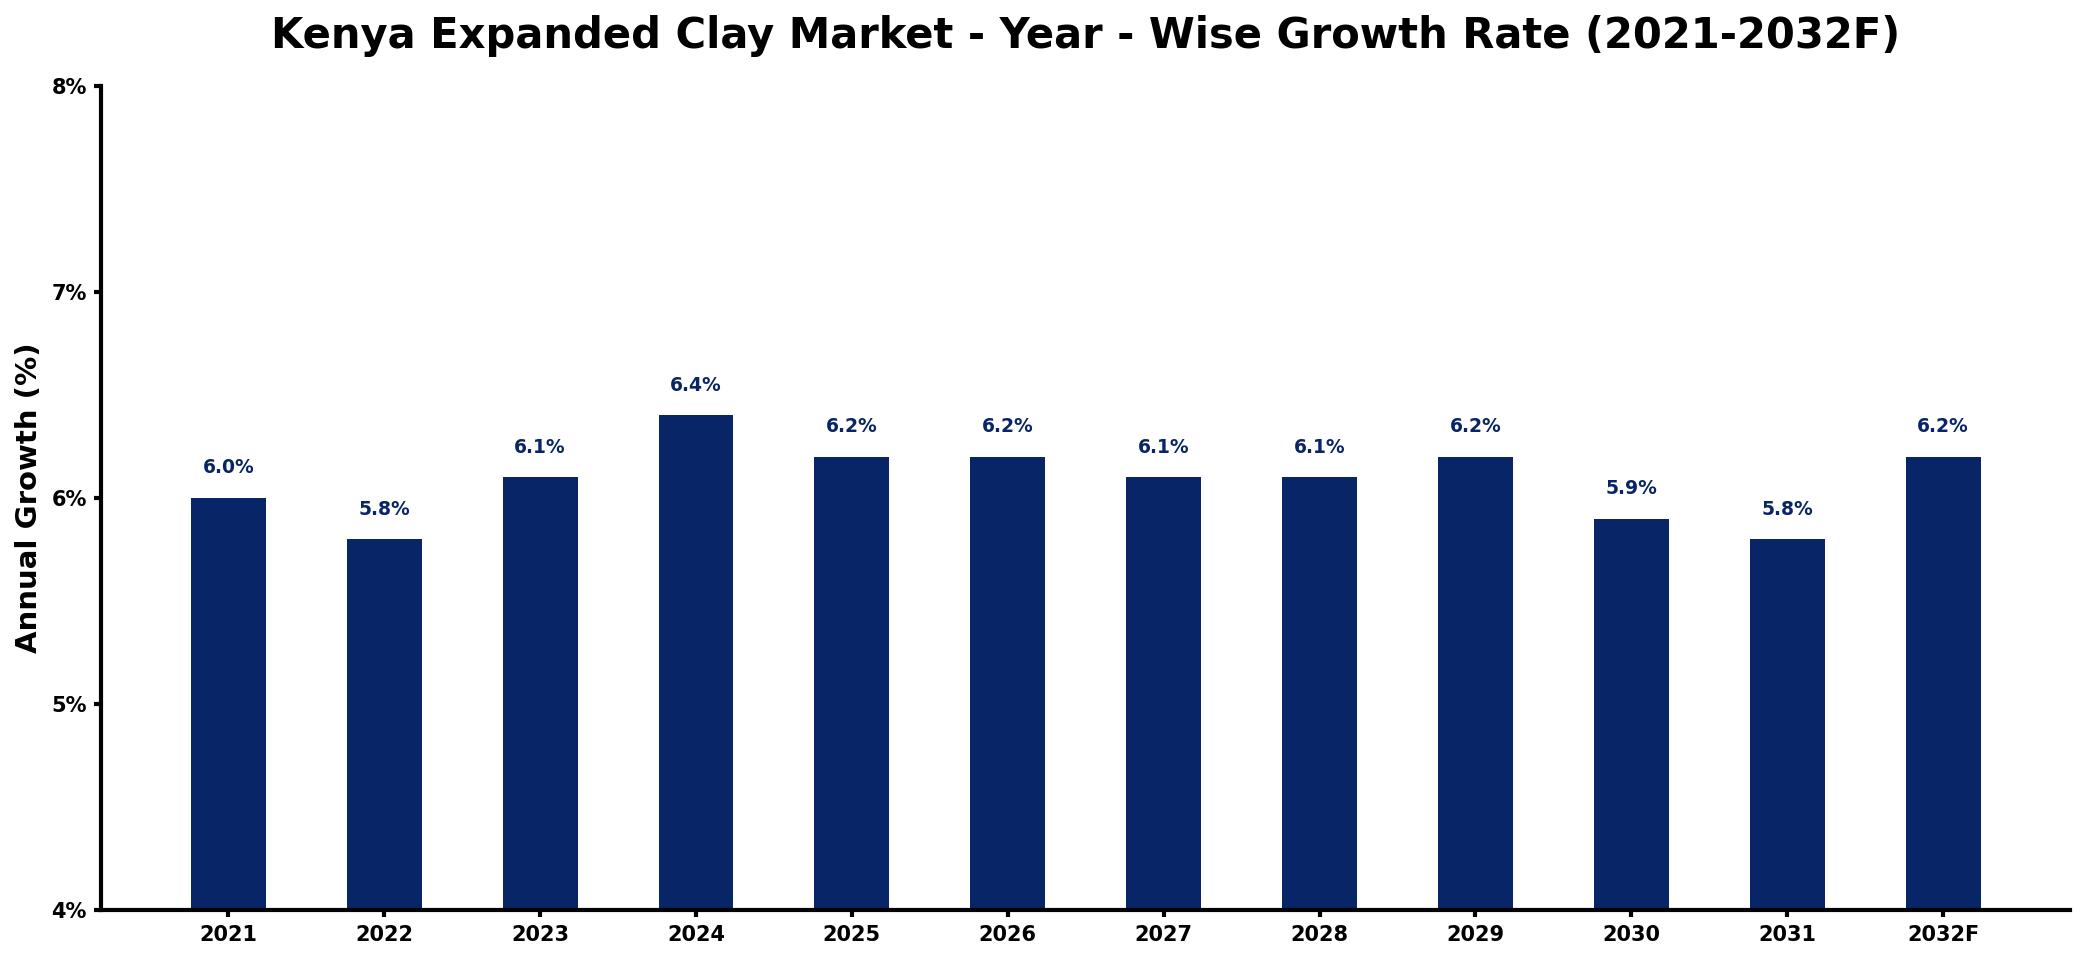
The table below presents the year‑wise growth rates along with the key drivers influencing the market
| Year | Growth Rate | Major Drivers |
| 2021 | 6.0% | Rising construction sector investments |
| 2022 | 5.8% | Increasing demand for lightweight materials |
| 2023 | 6.1% | Growth in sustainable building practices |
| 2024 | 6.4% | Expansion of urban infrastructure projects |
| 2025 | 6.2% | Surge in residential housing developments |
| 2026 | 6.2% | Growing popularity of eco-friendly solutions |
| 2027 | 6.1% | Increase in government construction initiatives |
| 2028 | 6.1% | Heightened interest in green technologies |
| 2029 | 6.2% | growing commercial sector adoption |
| 2030 | 5.9% | Shift towards innovative building techniques |
| 2031 | 5.8% | Demand for energy-efficient structures |
| 2032 | 6.2% | Advancements in construction technology |
Note: Market size estimations and growth projections presented in this report are based on 6Wresearch's proprietary forecasting methodology, utilizing the latest available industry data, government publications, and primary research inputs.
Kenya Expanded Clay Market Synopsis
In recent years, the Kenya expanded clay market has gained momentum due to the rising focus on sustainability within the construction industry. Expanded clay, known for its lightweight and insulating properties, is becoming a favored choice for various applications, including lightweight concrete and horticulture.
As urban areas expand, the demand for affordable housing and resilient infrastructure continues to rise. The unique attributes of expanded clay not only support energy-efficient building practices but also cater to the growing trend of green roofs and environmentally friendly construction methods, making it an essential component in today's market.
Kenya Expanded Clay Market Key Takeaways
- The market is experiencing a significant growth phase driven by construction sector demands.
- Expanded clay offers sustainable benefits, making it a preferred choice in building materials.
- Kenya's rapid urbanization is leading to increased applications in housing and infrastructure projects.
- Innovations in product offerings are enhancing the versatility of expanded clay in diverse applications.
- Government policies are reinforcing the use of expanded clay aggregates to improve construction sustainability.
Evaluation of Restraints in Kenya Expanded Clay Market
Despite its growth potential, the Kenya expanded clay market faces notable challenges. Market saturation and intense competition from alternative building materials can hinder expansion efforts. Furthermore, the lack of widespread awareness about the benefits of expanded clay can limit its adoption, especially among smaller construction firms. Sustainability concerns around manufacturing processes also pose hurdles, compelling manufacturers to innovate continuously. Effectively addressing these restraints is crucial for leveraging the full potential of expanded clay in the construction landscape.
Kenya Expanded Clay Market Trends
Current trends in the Kenya expanded clay market indicate a strong emphasis on eco-friendly construction practices. There is a growing preference for materials that contribute to energy efficiency and reduced carbon footprints. Innovations in lightweight concrete formulations are also emerging, integrating expanded clay aggregates to enhance thermal insulation and reduce structural weight.
Moreover, the market is witnessing an increasing interest in specialized applications, such as green roofing systems and horticultural uses, reflecting the dual demand for functionality and environmental sustainability. These trends not only underscore the versatility of expanded clay but also its critical role in modern construction.
Kenya Expanded Clay Market Opportunities
As urban development accelerates, opportunities within the Kenya expanded clay market are abundant. The rising focus on affordable housing initiatives opens doors for expanded clay solutions, particularly in lightweight construction. Additionally, the government's push towards green building practices fosters an environment ripe for investment in sustainable materials.
Another area of growth lies in the export potential of expanded clay products, as global demand for sustainable building materials continues to rise. As the market evolves, companies that innovate in product offerings and adhere to sustainability standards will likely capitalize on these emerging opportunities.
Government Initiatives in the Kenya Expanded Clay Market
The Kenyan government has taken significant steps to bolster the expanded clay market through supportive policies aimed at enhancing construction quality. Initiatives encouraging the use of lightweight and insulating materials are in place, fostering an environment conducive to sustainable building practices. By promoting compliance with building standards and incentivizing green construction methods, the government is actively working to improve energy performance and promote environmental sustainability in the built environment.
Future Insights of the Kenya Expanded Clay Market
Looking ahead to the years 2026-2032, the Kenya expanded clay market is poised for substantial growth. The acceleration of urbanization will continue to drive demand for innovative building solutions, with expanded clay playing a pivotal role. As awareness of sustainability increases, the market will likely see advancements in product development and application diversity.
The integration of expanded clay in construction practices, coupled with supportive government initiatives, will enhance its appeal. Furthermore, as global trends shift towards environmentally friendly materials, Kenya's expanded clay market stands to benefit significantly, positioning itself as a leader in sustainable construction solutions.
Kenya Expanded Clay Market Latest Developments (2025 - 2026)
Recent developments in the Kenya expanded clay market have showcased increasing collaboration among industry stakeholders to enhance product innovation. Manufacturers are focusing on improving the performance characteristics of expanded clay aggregates to meet diverse construction needs. Additionally, market players are investing in research and development to explore new applications, ensuring their products align with modern building practices. Furthermore, awareness campaigns highlighting the benefits of expanded clay are gaining traction, aiming to inform builders and developers about its advantages.
Kenya Expanded Clay Market - Key Attractiveness of the Report
- 10 Years of Market Numbers
- Historical Data Starting from 2022 to 2025
- Base Year: 2025
- Forecast Data until 2032
- Key Performance Indicators Impacting the Market
- Major Upcoming Developments and Projects
Key Highlights of the Report:
- Kenya Expanded Clay Market Outlook
- Market Size of Kenya Expanded Clay Market, 2025
- Forecast of Kenya Expanded Clay Market, 2032
- Historical Data and Forecast of Kenya Expanded Clay Revenues & Volume for the Period 2022-2032F
- Kenya Expanded Clay Market Trend Evolution
- Kenya Expanded Clay Market Drivers and Challenges
- Kenya Expanded Clay Price Trends
- Kenya Expanded Clay Porter's Five Forces
- Kenya Expanded Clay Industry Life Cycle
- Historical Data and Forecast of Kenya Expanded Clay Market Revenues & Volume By Types for the Period 2022-2032F
- Historical Data and Forecast of Kenya Expanded Clay Market Revenues & Volume By Up to 250 kg/mA for the Period 2022-2032F
- Historical Data and Forecast of Kenya Expanded Clay Market Revenues & Volume By 250-280 kg/mA for the Period 2022-2032F
- Historical Data and Forecast of Kenya Expanded Clay Market Revenues & Volume By 280-330 kg/mA for the Period 2022-2032F
- Historical Data and Forecast of Kenya Expanded Clay Market Revenues & Volume By 330-500 kg/mA for the Period 2022-2032F
- Historical Data and Forecast of Kenya Expanded Clay Market Revenues & Volume By Above 500 kg/mA for the Period 2022-2032F
- Historical Data and Forecast of Kenya Expanded Clay Market Revenues & Volume By Applications for the Period 2022-2032F
- Historical Data and Forecast of Kenya Expanded Clay Market Revenues & Volume By Residential Building for the Period 2022-2032F
- Historical Data and Forecast of Kenya Expanded Clay Market Revenues & Volume By Commercial Building for the Period 2022-2032F
- Historical Data and Forecast of Kenya Expanded Clay Market Revenues & Volume By Infrastructure for the Period 2022-2032F
- Historical Data and Forecast of Kenya Expanded Clay Market Revenues & Volume By Others for the Period 2022-2032F
- Kenya Expanded Clay Import Export Trade Statistics
- Market Opportunity Assessment By Types
- Market Opportunity Assessment By Applications
- Kenya Expanded Clay Top Companies Market Share
- Kenya Expanded Clay Competitive Benchmarking By Technical and Operational Parameters
- Kenya Expanded Clay Company Profiles
- Kenya Expanded Clay Key Strategic Recommendations
Frequently Asked Questions About the Market Study (FAQs):
The Kenya Expanded Clay Market was estimated at USD 544 Million in 2025 and is projected to reach USD 775 Million by 2032, reflecting a CAGR of 5.2% from 2026 to 2032, showcasing its robust growth potential.
The primary applications include insulation materials, lightweight concrete production, horticultural uses, and green roofing systems, all of which are gaining traction due to the emphasis on sustainable construction.
The construction sector is a major driver of the expanded clay market as it seeks lightweight and energy-efficient materials to meet modern building standards, reflecting a trend towards sustainability and resilience.
The government supports the market through policies that promote sustainable building practices, compliance with industry standards, and investment incentives for the use of innovative materials.
Key challenges include competition from alternative materials, market saturation, and the need for greater awareness about the benefits of expanded clay among smaller construction firms.
6Wresearch actively monitors the Kenya Expanded Clay Market and publishes its comprehensive annual report, highlighting emerging trends, growth drivers, revenue analysis, and forecast outlook. Our insights help businesses to make data-backed strategic decisions with ongoing market dynamics. Our analysts track relevent industries related to the Kenya Expanded Clay Market, allowing our clients with actionable intelligence and reliable forecasts tailored to emerging regional needs.
Yes, we provide customisation as per your requirements. To learn more, feel free to contact us on sales@6wresearch.com
1 Executive Summary |
2 Introduction |
2.1 Key Highlights of the Report |
2.2 Report Description |
2.3 Market Scope & Segmentation |
2.4 Research Methodology |
2.5 Assumptions |
3 Kenya Expanded Clay Market Overview |
3.1 Kenya Country Macro Economic Indicators |
3.2 Kenya Expanded Clay Market Revenues & Volume, 2022 & 2032F |
3.3 Kenya Expanded Clay Market - Industry Life Cycle |
3.4 Kenya Expanded Clay Market - Porter's Five Forces |
3.5 Kenya Expanded Clay Market Revenues & Volume Share, By Types, 2022 & 2032F |
3.6 Kenya Expanded Clay Market Revenues & Volume Share, By Applications, 2022 & 2032F |
4 Kenya Expanded Clay Market Dynamics |
4.1 Impact Analysis |
4.2 Market Drivers |
4.2.1 Growing construction industry in Kenya leading to increased demand for construction materials. |
4.2.2 Government initiatives promoting infrastructure development and affordable housing projects. |
4.2.3 Rising awareness about the benefits of expanded clay in construction applications. |
4.3 Market Restraints |
4.3.1 Fluctuating raw material prices impacting production costs. |
4.3.2 Limited availability of skilled labor for expanded clay manufacturing. |
4.3.3 Environmental concerns related to clay mining and processing. |
5 Kenya Expanded Clay Market Trends |
6 Kenya Expanded Clay Market, By Types |
6.1 Kenya Expanded Clay Market, By Types |
6.1.1 Overview and Analysis |
6.1.2 Kenya Expanded Clay Market Revenues & Volume, By Types, 2022-2032F |
6.1.3 Kenya Expanded Clay Market Revenues & Volume, By Up to 250 kg/mA, 2022-2032F |
6.1.4 Kenya Expanded Clay Market Revenues & Volume, By 250-280 kg/mA, 2022-2032F |
6.1.5 Kenya Expanded Clay Market Revenues & Volume, By 280-330 kg/mA, 2022-2032F |
6.1.6 Kenya Expanded Clay Market Revenues & Volume, By 330-500 kg/mA, 2022-2032F |
6.1.7 Kenya Expanded Clay Market Revenues & Volume, By Above 500 kg/mA, 2022-2032F |
6.2 Kenya Expanded Clay Market, By Applications |
6.2.1 Overview and Analysis |
6.2.2 Kenya Expanded Clay Market Revenues & Volume, By Residential Building, 2022-2032F |
6.2.3 Kenya Expanded Clay Market Revenues & Volume, By Commercial Building, 2022-2032F |
6.2.4 Kenya Expanded Clay Market Revenues & Volume, By Infrastructure, 2022-2032F |
6.2.5 Kenya Expanded Clay Market Revenues & Volume, By Others, 2022-2032F |
7 Kenya Expanded Clay Market Import-Export Trade Statistics |
7.1 Kenya Expanded Clay Market Export to Major Countries |
7.2 Kenya Expanded Clay Market Imports from Major Countries |
8 Kenya Expanded Clay Market Key Performance Indicators |
8.1 Average selling price of expanded clay products. |
8.2 Number of infrastructure and housing projects using expanded clay. |
8.3 Adoption rate of expanded clay in construction projects. |
8.4 Percentage of market share captured by expanded clay compared to traditional construction materials. |
8.5 Customer satisfaction levels with the performance of expanded clay products. |
9 Kenya Expanded Clay Market - Opportunity Assessment |
9.1 Kenya Expanded Clay Market Opportunity Assessment, By Types, 2022 & 2032F |
9.2 Kenya Expanded Clay Market Opportunity Assessment, By Applications, 2022 & 2032F |
10 Kenya Expanded Clay Market - Competitive Landscape |
10.1 Kenya Expanded Clay Market Revenue Share, By Companies, 2025 |
10.2 Kenya Expanded Clay Market Competitive Benchmarking, By Operating and Technical Parameters |
11 Company Profiles |
12 Recommendations |
13 Disclaimer |
Global Go To Market Strategy - 2030
Export potential enables firms to identify high-growth global markets with greater confidence by combining advanced trade intelligence with a structured quantitative methodology. The framework analyzes emerging demand trends and country-level import patterns while integrating macroeconomic and trade datasets such as GDP and population forecasts, bilateral import–export flows, tariff structures, elasticity differentials between developed and developing economies, geographic distance, and import demand projections. Using weighted trade values from 2020–2024 as the base period to project country-to-country export potential for 2030, these inputs are operationalized through calculated drivers such as gravity model parameters, tariff impact factors, and projected GDP per-capita growth. Through an analysis of hidden potentials, demand hotspots, and market conditions that are most favorable to success, this method enables firms to focus on target countries, maximize returns, and global expansion with data, backed by accuracy.
By factoring in the projected importer demand gap that is currently unmet and could be potential opportunity, it identifies the potential for the Exporter (Country) among 190 countries, against the general trade analysis, which identifies the biggest importer or exporter.
To discover high-growth global markets and optimize your business strategy:
Click Here
Pricing
- Single User License$ 1,995
- Department License$ 2,400
- Site License$ 3,120
- Global License$ 3,795

Leadership Perspectives from Industry Events
Search
Thought Leadership and Analyst Meet


Our Clients
6WResearch In News
- India Air Conditioner Market Set for Strong Rebound in 2026 After Weather-Led Correction and GST-Driven Recovery: 6Wresearch
- ADAS in India: How Automatic Emergency Braking, Blind Spot Detection & Driver Monitoring are Transforming Road Safety
- Doha a strategic location for EV manufacturing hub: IPA Qatar
- Demand for luxury TVs surging in the GCC, says Samsung
- Empowering Growth: The Thriving Journey of Bangladesh’s Cable Industry
- Demand for luxury TVs surging in the GCC, says Samsung
Latest Reports
- Nicaragua RPG Gaming Market (2026-2032)
- New Zealand RPG Gaming Market (2026-2032)
- Netherlands RPG Gaming Market (2026-2032)
- Nauru RPG Gaming Market (2026-2032)
- Namibia RPG Gaming Market (2026-2032)
- Mozambique RPG Gaming Market (2026-2032)
- Montenegro RPG Gaming Market (2026-2032)
- Mongolia RPG Gaming Market (2026-2032)
- Monaco RPG Gaming Market (2026-2032)
- Micronesia RPG Gaming Market (2026-2032)
Industry Events and Analyst Meet

HIMTEX 2026

India Refining Summit 2026

India EV Show 2026

EV tech India Expo 2026

Auto Tech Asia 2026
Whitepaper
- Middle East & Africa Commercial Security Market Click here to view more.
- Middle East & Africa Fire Safety Systems & Equipment Market Click here to view more.
- GCC Drone Market Click here to view more.
- Middle East Lighting Fixture Market Click here to view more.
- GCC Physical & Perimeter Security Market Click here to view more.