Kenya Faucets, Mixers & Taps Market (2026-2032) | Industry, Companies, Value, Size, Analysis, Share, Trends, Growth, Outlook, Forecast, COVID-19 IMPACT & Revenue
Market Forecast By Technology (Sensor, Non-Sensor), By Product Type (One-hand mixer, Two-hand mixer, Others ), By End-Users (Residential, Commercial, Industrial), By Applications (Bathroom Faucets, Kitchen Faucets) And Competitive Landscape
| Product Code: ETC011110 | Publication Date: Jun 2023 | Updated Date: Jun 2026 | Product Type: Report | |
| Publisher: 6Wresearch | Author: Ravi Bhandari | No. of Pages: 70 | No. of Figures: 35 | No. of Tables: 5 |
Kenya Faucets, Mixers & Taps Market Summary
The kenya faucets, mixers & taps market was estimated at USD 393 Million in 2025 and is projected to reach USD 556 Million by 2032, growing at a CAGR of 5.9% from 2026 to 2032.
Kenya Faucets, Mixers & Taps Market Year-wise Growth Rate and Key Drivers
This graph highlights how the Kenya Faucets, Mixers & Taps Market has steadily grown over the past five years, supported by major growth factors.
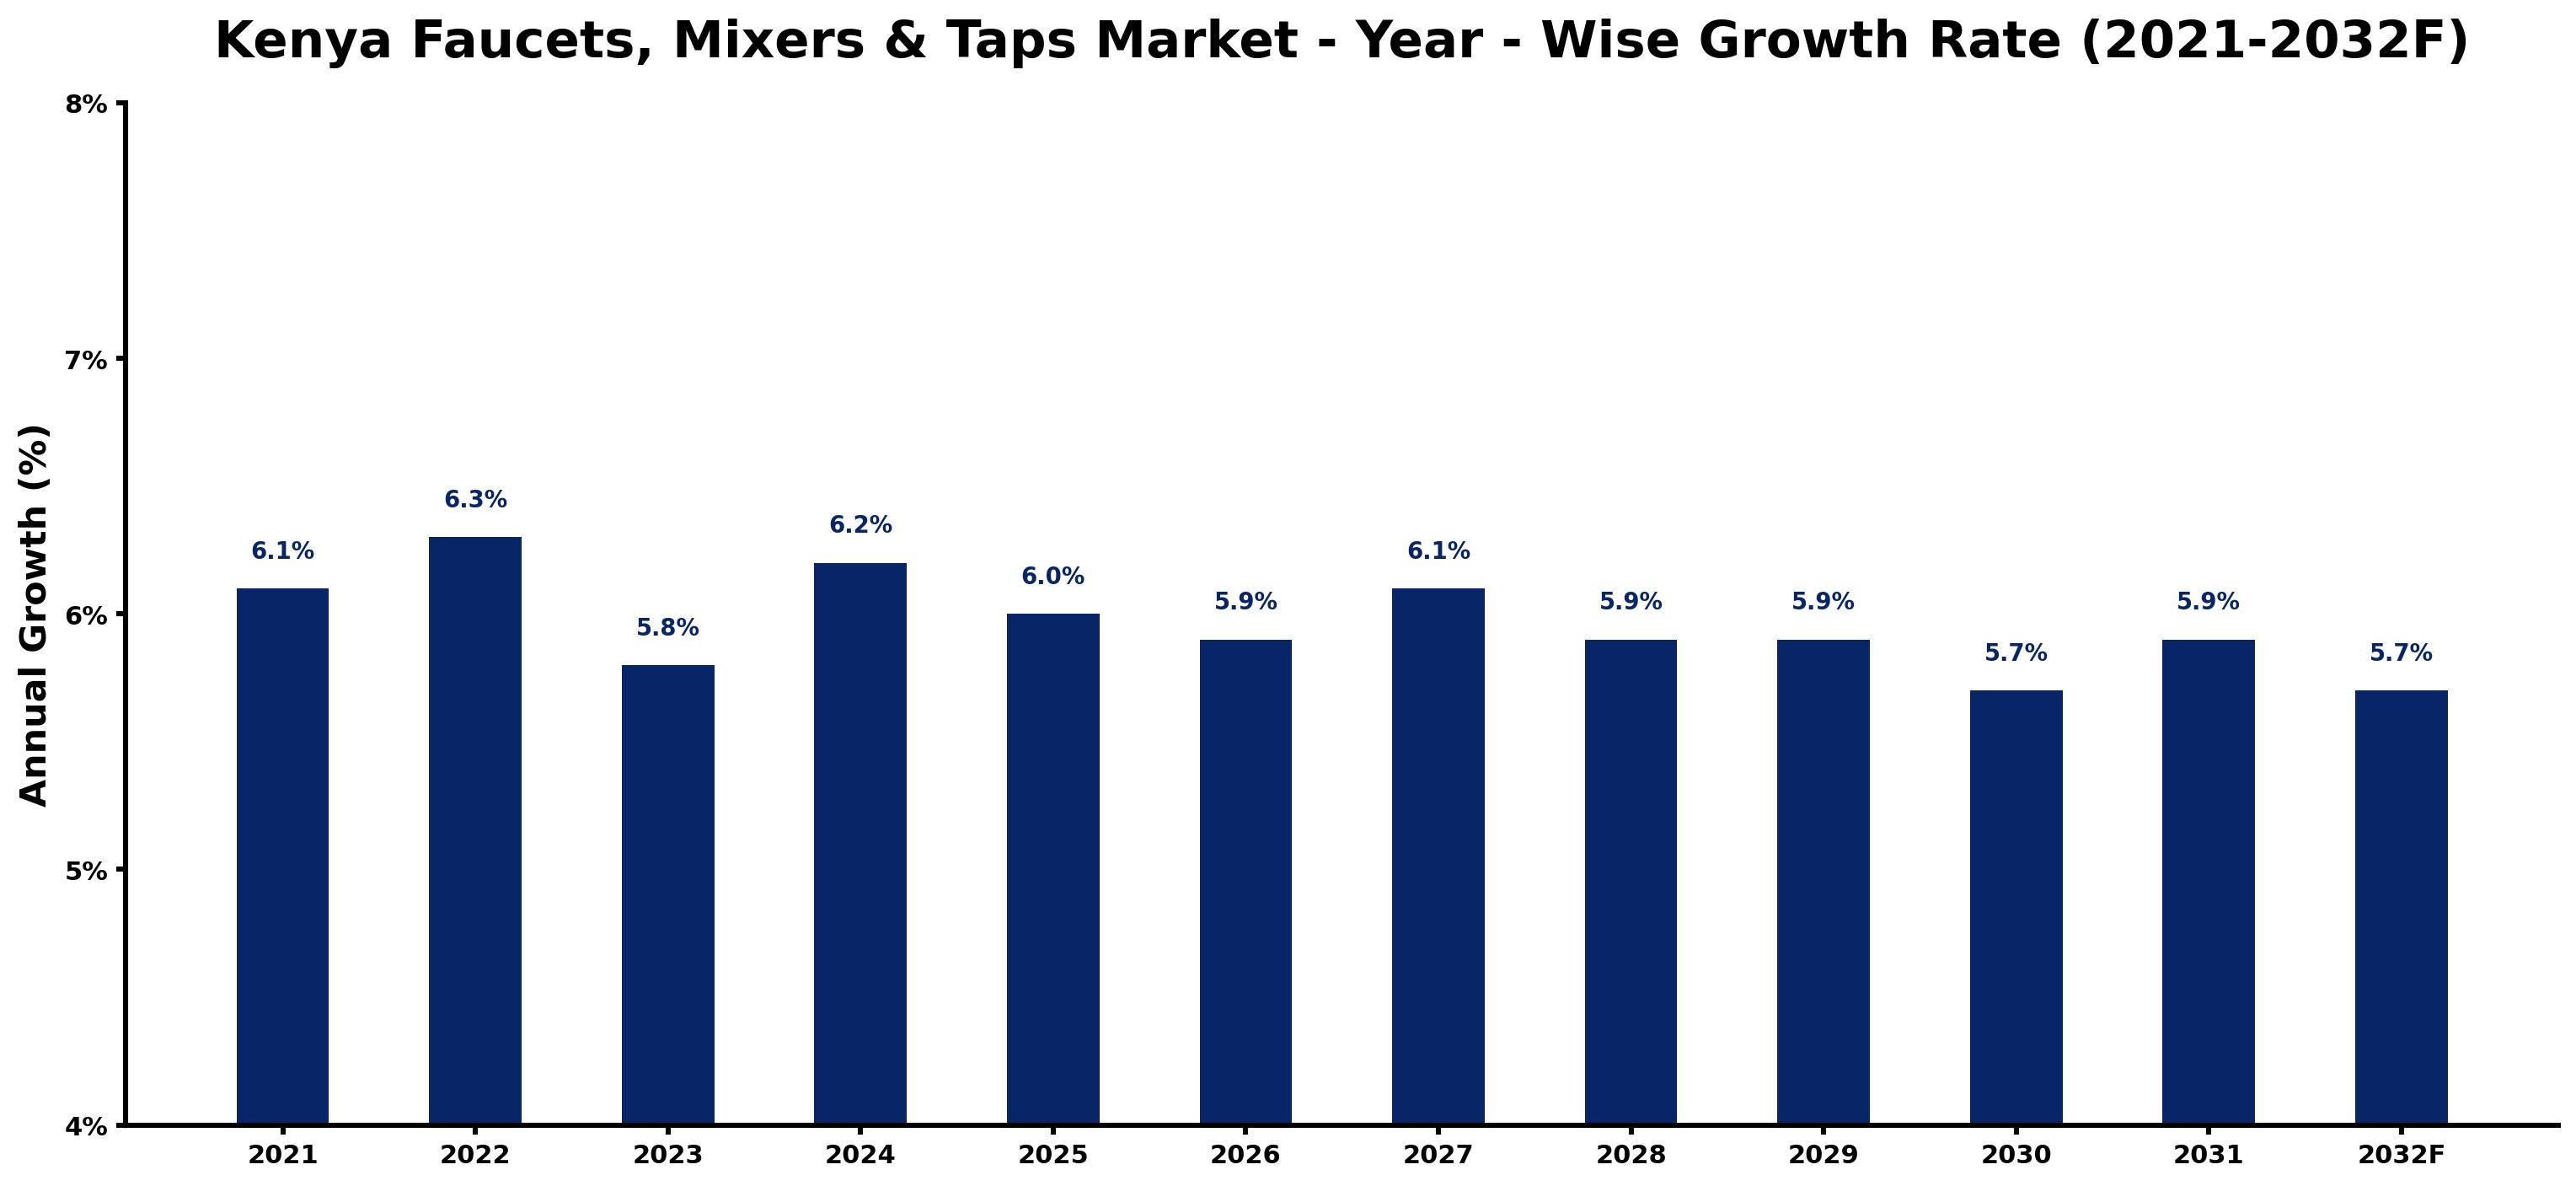
The table below presents the year wise growth rates along with the key drivers influencing the market
| Year | Growth Rate | Major Drivers |
| 2021 | 6.1% | Post-lockdown retail projects showcased a renewed focus on bathroom renovations. |
| 2022 | 6.3% | Urbanization trends pushed demand for modern plumbing fixtures in growing urban areas. |
| 2023 | 5.8% | Home improvement investments surged as homeowners upgraded outdated kitchen appliances. |
| 2024 | 6.2% | The influx of foreign investments stimulated local manufacturing of plumbing products. |
| 2025 | 6.0% | Increased water conservation awareness encouraged the adoption of efficient faucet technologies. |
| 2026 | 5.9% | A shift towards eco-friendly materials became prevalent among discerning consumers. |
| 2027 | 6.1% | Rural electrification projects improved access to modern plumbing in previously underserved areas. |
| 2028 | 5.9% | The construction boom in both residential and commercial sectors fueled market expansion. |
| 2029 | 5.9% | Online retail platforms enabled easier access to a variety of faucet options. |
| 2030 | 5.7% | Innovative designs from local artisans started gaining popularity among affluent customers. |
| 2031 | 5.9% | Partnerships between local suppliers and international brands broadened market offerings significantly. |
| 2032 | 5.7% | Sustainability concerns led manufacturers to invest in greener production processes. |
Note - Market size estimations and growth projections presented in this report are based on 6Wresearch's advanced forecasting approach, validated with industry datasets as of June 2026.
Kenya Faucets, Mixers & Taps Market Synopsis
The Kenya Faucets, Mixers Taps Market is projected to reach 5.9% and witness significant growth during the forecast period (2026-2032). The expanding population and urbanization have catalyzed a robust demand for contemporary plumbing fixtures in both residential and commercial sectors. Increased disposable incomes are driving consumers towards modernizing their home interiors with advanced plumbing solutions. This trend provides ample growth opportunities for manufacturers and suppliers within the Kenyan market for faucets, mixers, and taps.
Kenya Faucets, Mixers & Taps Market Growth Drivers
The growth trajectory of the Kenya Faucets, Mixers & Taps Market can be attributed to several key factors. First, the improving economic conditions have led to higher levels of disposable income, resulting in increased spending on durable goods such as plumbing fixtures. Second, ongoing urbanization is inspiring new construction and renovation projects, further fueling demand.
- The rising population density in urban areas is exerting greater pressure on existing infrastructure, necessitating the installation of modern plumbing solutions.
- Government initiatives aimed at enhancing clean water supply and sanitation infrastructure are additionally supporting market expansion.
- The growing trend of interior design modernization is encouraging consumers to invest in high-quality faucets, mixers, and taps.
- Foreign direct investment (FDI) in the construction sector is enhancing the availability of essential building materials, including plumbing fixtures.
- Increasing accessibility of various international brands and local products caters to diverse consumer preferences, further stimulating market growth.
Kenya Faucets, Mixers & Taps Market Trends and Opportunities
Emerging trends in the Kenya Faucets, Mixers & Taps Market are indicative of evolving consumer preferences and technological advancements. A notable trend is the growing popularity of water-efficient fixtures, driven by heightened awareness of water conservation practices. Furthermore, smart plumbing technology is gaining traction as consumers seek more automated solutions for convenience and efficiency.
- There is a shift towards eco-friendly tap and mixer solutions, highlighting sustainability as a critical consideration for consumers.
- Innovative designs and customization options are becoming increasingly important, allowing homeowners to select fixtures that complement their personal style.
- Online retail channels are expanding, providing easier access to a wide range of products and facilitating informed purchasing decisions.
- Collaboration between manufacturers and interior designers is resulting in product offerings that are more aesthetically aligned with contemporary home designs.
- Increased awareness regarding hygiene is pushing the demand for touchless faucets that minimize contact, especially in public facilities.
Kenya Faucets, Mixers & Taps Market Government Investment and Initiatives
The Kenyan government has implemented several initiatives aimed at enhancing infrastructure, particularly in providing clean water supply and sanitation facilities. Public spending in this area is crucial for supporting the growth of the faucets, mixers, and taps market. Various programs focus on improving water access in both urban and rural regions, aligning with the nation's Vision 2030 development blueprint.
- The government is promoting policies that incentivize investments in the plumbing and construction sectors, which indirectly benefits the faucets, mixers, and taps market.
- Investment in public health campaigns emphasizes sanitation and the essential nature of effective plumbing infrastructure, thus driving demand.
- Government partnerships with private sector entities aim to enhance the efficiency of plumbing installations in new housing projects.
- Regulatory frameworks are being established to ensure that plumbing fixtures meet quality and sustainability standards, promoting better product offerings.
- Focus on regional development initiatives is helping expand markets within lesser-explored areas, creating new opportunities for manufacturers and suppliers.
Kenya Faucets, Mixers & Taps Market Latest Developments (May 2025 - June 2026)
Recent developments in the Kenya Faucets, Mixers & Taps Market highlight a strong alignment with residential and commercial construction trends. The government has announced several infrastructure projects that significantly boost the demand for plumbing fixtures. Concurrently, new regulations promoting energy-efficient and water-saving technologies are being introduced, influencing product designs across the market. Further, increased investment from both domestic and foreign entities signals a robust growth environment, culminating in the expansion of production facilities within the country.
- There have been initiatives to promote public-private partnerships to enhance the supply chain for plumbing materials, ensuring product availability.
- The trend towards e-commerce has intensified, with various platforms emerging to suit changing consumer behaviors.
- Awareness campaigns about the importance of modern plumbing systems are being actively promoted by both governmental and non-governmental organizations.
- Engagements between stakeholders in the construction and plumbing sectors are leading to more integrated project approaches, streamlining processes.
- Technological advancements in manufacturing processes are enabling the production of higher quality, more durable plumbing products.
Kenya Faucets, Mixers & Taps Market - Key Attractiveness of the Report
- 10 Years of Market Numbers
- Historical Data Starting from 2022 to 2025
- Base Year: 2025
- Forecast Data until 2032
- Key Performance Indicators Impacting the Market
- Major Upcoming Developments and Projects
Key Highlights of the Report:
- Kenya Faucets, Mixers & Taps Market Outlook
- Market Size of Kenya Faucets, Mixers & Taps Market, 2025
- Forecast of Kenya Faucets, Mixers & Taps Market, 2032F
- Historical Data and Forecast of Kenya Faucets, Mixers & Taps Revenues & Volume for the Period 2022-2032F
- Kenya Faucets, Mixers & Taps Market Trend Evolution
- Kenya Faucets, Mixers & Taps Market Drivers and Challenges
- Kenya Faucets, Mixers & Taps Price Trends
- Kenya Faucets, Mixers & Taps Porter's Five Forces
- Kenya Faucets, Mixers & Taps Industry Life Cycle
- Historical Data and Forecast of Kenya Faucets, Mixers & Taps Market Revenues & Volume By Technology for the Period 2022-2032F
- Historical Data and Forecast of Kenya Faucets, Mixers & Taps Market Revenues & Volume By Sensor for the Period 2022-2032F
- Historical Data and Forecast of Kenya Faucets, Mixers & Taps Market Revenues & Volume By Non-Sensor for the Period 2022-2032F
- Historical Data and Forecast of Kenya Faucets, Mixers & Taps Market Revenues & Volume By Product Type for the Period 2022-2032F
- Historical Data and Forecast of Kenya Faucets, Mixers & Taps Market Revenues & Volume By One-hand mixer for the Period 2022-2032F
- Historical Data and Forecast of Kenya Faucets, Mixers & Taps Market Revenues & Volume By Two-hand mixer for the Period 2022-2032F
- Historical Data and Forecast of Kenya Faucets, Mixers & Taps Market Revenues & Volume By Others for the Period 2022-2032F
- Historical Data and Forecast of Kenya Faucets, Mixers & Taps Market Revenues & Volume By End-Users for the Period 2022-2032F
- Historical Data and Forecast of Kenya Faucets, Mixers & Taps Market Revenues & Volume By Residential for the Period 2022-2032F
- Historical Data and Forecast of Kenya Faucets, Mixers & Taps Market Revenues & Volume By Commercial for the Period 2022-2032F
- Historical Data and Forecast of Kenya Faucets, Mixers & Taps Market Revenues & Volume By Industrial for the Period 2022-2032F
- Historical Data and Forecast of Kenya Faucets, Mixers & Taps Market Revenues & Volume By Applications for the Period 2022-2032F
- Historical Data and Forecast of Kenya Faucets, Mixers & Taps Market Revenues & Volume By Bathroom Faucets for the Period 2022-2032F
- Historical Data and Forecast of Kenya Faucets, Mixers & Taps Market Revenues & Volume By Kitchen Faucets for the Period 2022-2032F
- Kenya Faucets, Mixers & Taps Import Export Trade Statistics
- Market Opportunity Assessment By Technology
- Market Opportunity Assessment By Product Type
- Market Opportunity Assessment By End-Users
- Market Opportunity Assessment By Applications
- Kenya Faucets, Mixers & Taps Top Companies Market Share
- Kenya Faucets, Mixers & Taps Competitive Benchmarking By Technical and Operational Parameters
- Kenya Faucets, Mixers & Taps Company Profiles
- Kenya Faucets, Mixers & Taps Key Strategic Recommendations
Frequently Asked Questions About the Market Study (FAQs):
The growth is primarily driven by population increase, urbanization, rising disposable incomes, and government initiatives aimed at improving water access.
Key trends include the demand for water-efficient fixtures, the rise of smart plumbing technologies, and a shift towards eco-friendly products.
The government supports this market through public spending on infrastructure, regulatory frameworks ensuring quality standards, and partnerships with the private sector.
The market is expected to witness significant growth driven by various economic and demographic factors, with a positive outlook for the coming years.
6Wresearch actively monitors the Kenya Faucets, Mixers & Taps Market and publishes its comprehensive annual report, highlighting emerging trends, growth drivers, revenue analysis, and forecast outlook. Our insights help businesses to make data-backed strategic decisions with ongoing market dynamics. Our analysts track relevent industries related to the Kenya Faucets, Mixers & Taps Market, allowing our clients with actionable intelligence and reliable forecasts tailored to emerging regional needs.
Yes, we provide customisation as per your requirements. To learn more, feel free to contact us on sales@6wresearch.com
1 Executive Summary |
2 Introduction |
2.1 Key Highlights of the Report |
2.2 Report Description |
2.3 Market Scope & Segmentation |
2.4 Research Methodology |
2.5 Assumptions |
3 Kenya Faucets, Mixers & Taps Market Overview |
3.1 Kenya Country Macro Economic Indicators |
3.2 Kenya Faucets, Mixers & Taps Market Revenues & Volume, 2022 & 2032F |
3.3 Kenya Faucets, Mixers & Taps Market - Industry Life Cycle |
3.4 Kenya Faucets, Mixers & Taps Market - Porter's Five Forces |
3.5 Kenya Faucets, Mixers & Taps Market Revenues & Volume Share, By Technology, 2022 & 2032F |
3.6 Kenya Faucets, Mixers & Taps Market Revenues & Volume Share, By Product Type, 2022 & 2032F |
3.7 Kenya Faucets, Mixers & Taps Market Revenues & Volume Share, By End-Users, 2022 & 2032F |
3.8 Kenya Faucets, Mixers & Taps Market Revenues & Volume Share, By Applications, 2022 & 2032F |
4 Kenya Faucets, Mixers & Taps Market Dynamics |
4.1 Impact Analysis |
4.2 Market Drivers |
4.3 Market Restraints |
5 Kenya Faucets, Mixers & Taps Market Trends |
6 Kenya Faucets, Mixers & Taps Market, By Types |
6.1 Kenya Faucets, Mixers & Taps Market, By Technology |
6.1.1 Overview and Analysis |
6.1.2 Kenya Faucets, Mixers & Taps Market Revenues & Volume, By Technology, 2022-2032F |
6.1.3 Kenya Faucets, Mixers & Taps Market Revenues & Volume, By Sensor, 2022-2032F |
6.1.4 Kenya Faucets, Mixers & Taps Market Revenues & Volume, By Non-Sensor, 2022-2032F |
6.2 Kenya Faucets, Mixers & Taps Market, By Product Type |
6.2.1 Overview and Analysis |
6.2.2 Kenya Faucets, Mixers & Taps Market Revenues & Volume, By One-hand mixer, 2022-2032F |
6.2.3 Kenya Faucets, Mixers & Taps Market Revenues & Volume, By Two-hand mixer, 2022-2032F |
6.2.4 Kenya Faucets, Mixers & Taps Market Revenues & Volume, By Others , 2022-2032F |
6.3 Kenya Faucets, Mixers & Taps Market, By End-Users |
6.3.1 Overview and Analysis |
6.3.2 Kenya Faucets, Mixers & Taps Market Revenues & Volume, By Residential, 2022-2032F |
6.3.3 Kenya Faucets, Mixers & Taps Market Revenues & Volume, By Commercial, 2022-2032F |
6.3.4 Kenya Faucets, Mixers & Taps Market Revenues & Volume, By Industrial, 2022-2032F |
6.4 Kenya Faucets, Mixers & Taps Market, By Applications |
6.4.1 Overview and Analysis |
6.4.2 Kenya Faucets, Mixers & Taps Market Revenues & Volume, By Bathroom Faucets, 2022-2032F |
6.4.3 Kenya Faucets, Mixers & Taps Market Revenues & Volume, By Kitchen Faucets, 2022-2032F |
7 Kenya Faucets, Mixers & Taps Market Import-Export Trade Statistics |
7.1 Kenya Faucets, Mixers & Taps Market Export to Major Countries |
7.2 Kenya Faucets, Mixers & Taps Market Imports from Major Countries |
8 Kenya Faucets, Mixers & Taps Market Key Performance Indicators |
9 Kenya Faucets, Mixers & Taps Market - Opportunity Assessment |
9.1 Kenya Faucets, Mixers & Taps Market Opportunity Assessment, By Technology, 2022 & 2032F |
9.2 Kenya Faucets, Mixers & Taps Market Opportunity Assessment, By Product Type, 2022 & 2032F |
9.3 Kenya Faucets, Mixers & Taps Market Opportunity Assessment, By End-Users, 2022 & 2032F |
9.4 Kenya Faucets, Mixers & Taps Market Opportunity Assessment, By Applications, 2022 & 2032F |
10 Kenya Faucets, Mixers & Taps Market - Competitive Landscape |
10.1 Kenya Faucets, Mixers & Taps Market Revenue Share, By Companies, 2025 |
10.2 Kenya Faucets, Mixers & Taps Market Competitive Benchmarking, By Operating and Technical Parameters |
11 Company Profiles |
12 Recommendations |
13 Disclaimer |
Global Go To Market Strategy - 2030
Export potential enables firms to identify high-growth global markets with greater confidence by combining advanced trade intelligence with a structured quantitative methodology. The framework analyzes emerging demand trends and country-level import patterns while integrating macroeconomic and trade datasets such as GDP and population forecasts, bilateral import–export flows, tariff structures, elasticity differentials between developed and developing economies, geographic distance, and import demand projections. Using weighted trade values from 2020–2024 as the base period to project country-to-country export potential for 2030, these inputs are operationalized through calculated drivers such as gravity model parameters, tariff impact factors, and projected GDP per-capita growth. Through an analysis of hidden potentials, demand hotspots, and market conditions that are most favorable to success, this method enables firms to focus on target countries, maximize returns, and global expansion with data, backed by accuracy.
By factoring in the projected importer demand gap that is currently unmet and could be potential opportunity, it identifies the potential for the Exporter (Country) among 190 countries, against the general trade analysis, which identifies the biggest importer or exporter.
To discover high-growth global markets and optimize your business strategy:
Click Here
Pricing
- Single User License$ 1,995
- Department License$ 2,400
- Site License$ 3,120
- Global License$ 3,795

Leadership Perspectives from Industry Events
Search
Thought Leadership and Analyst Meet


Our Clients
6WResearch In News
- India Air Conditioner Market Set for Strong Rebound in 2026 After Weather-Led Correction and GST-Driven Recovery: 6Wresearch
- ADAS in India: How Automatic Emergency Braking, Blind Spot Detection & Driver Monitoring are Transforming Road Safety
- Doha a strategic location for EV manufacturing hub: IPA Qatar
- Demand for luxury TVs surging in the GCC, says Samsung
- Empowering Growth: The Thriving Journey of Bangladesh’s Cable Industry
- Demand for luxury TVs surging in the GCC, says Samsung
Latest Reports
- Nicaragua RPG Gaming Market (2026-2032)
- New Zealand RPG Gaming Market (2026-2032)
- Netherlands RPG Gaming Market (2026-2032)
- Nauru RPG Gaming Market (2026-2032)
- Namibia RPG Gaming Market (2026-2032)
- Mozambique RPG Gaming Market (2026-2032)
- Montenegro RPG Gaming Market (2026-2032)
- Mongolia RPG Gaming Market (2026-2032)
- Monaco RPG Gaming Market (2026-2032)
- Micronesia RPG Gaming Market (2026-2032)
Industry Events and Analyst Meet

EV India Expo 2026

HIMTEX 2026

India Refining Summit 2026

India EV Show 2026

EV tech India Expo 2026
Whitepaper
- Middle East & Africa Commercial Security Market Click here to view more.
- Middle East & Africa Fire Safety Systems & Equipment Market Click here to view more.
- GCC Drone Market Click here to view more.
- Middle East Lighting Fixture Market Click here to view more.
- GCC Physical & Perimeter Security Market Click here to view more.