Kenya Fire Protection Material Market (2026-2032) | COVID-19 IMPACT, Industry, Growth, Forecast, Revenue, Companies, Share, Trends, Size, Analysis, Outlook & Value
Market Forecast By Type (Sealants, Mortar, Putty, Spray, Sheets/Boards, Others), By Application Type (Residential, Commercial, Industrial), By Elevator Technology (Traction & Machine Room Less Traction, Hydraulic), By End-User (Residential, Commercial, Institutional, Infrastructural, Others) And Competitive Landscape
| Product Code: ETC005770 | Publication Date: Jun 2023 | Product Type: Report | ||
| Publisher: 6Wresearch | Author: Ravi Bhandari | No. of Pages: 70 | No. of Figures: 35 | No. of Tables: 5 |
Kenya Fire Protection Material Market Summary
The kenya fire protection material market was estimated at USD 323 Million in 2025 and is projected to reach USD 434 Million by 2032, growing at a CAGR of 4.9% from 2026 to 2032.
Kenya Fire Protection Material Market Year-wise Growth Rate and Key Drivers
This graph highlights how the Kenya Fire Protection Material Market has steadily grown over the past five years, supported by major growth factors.
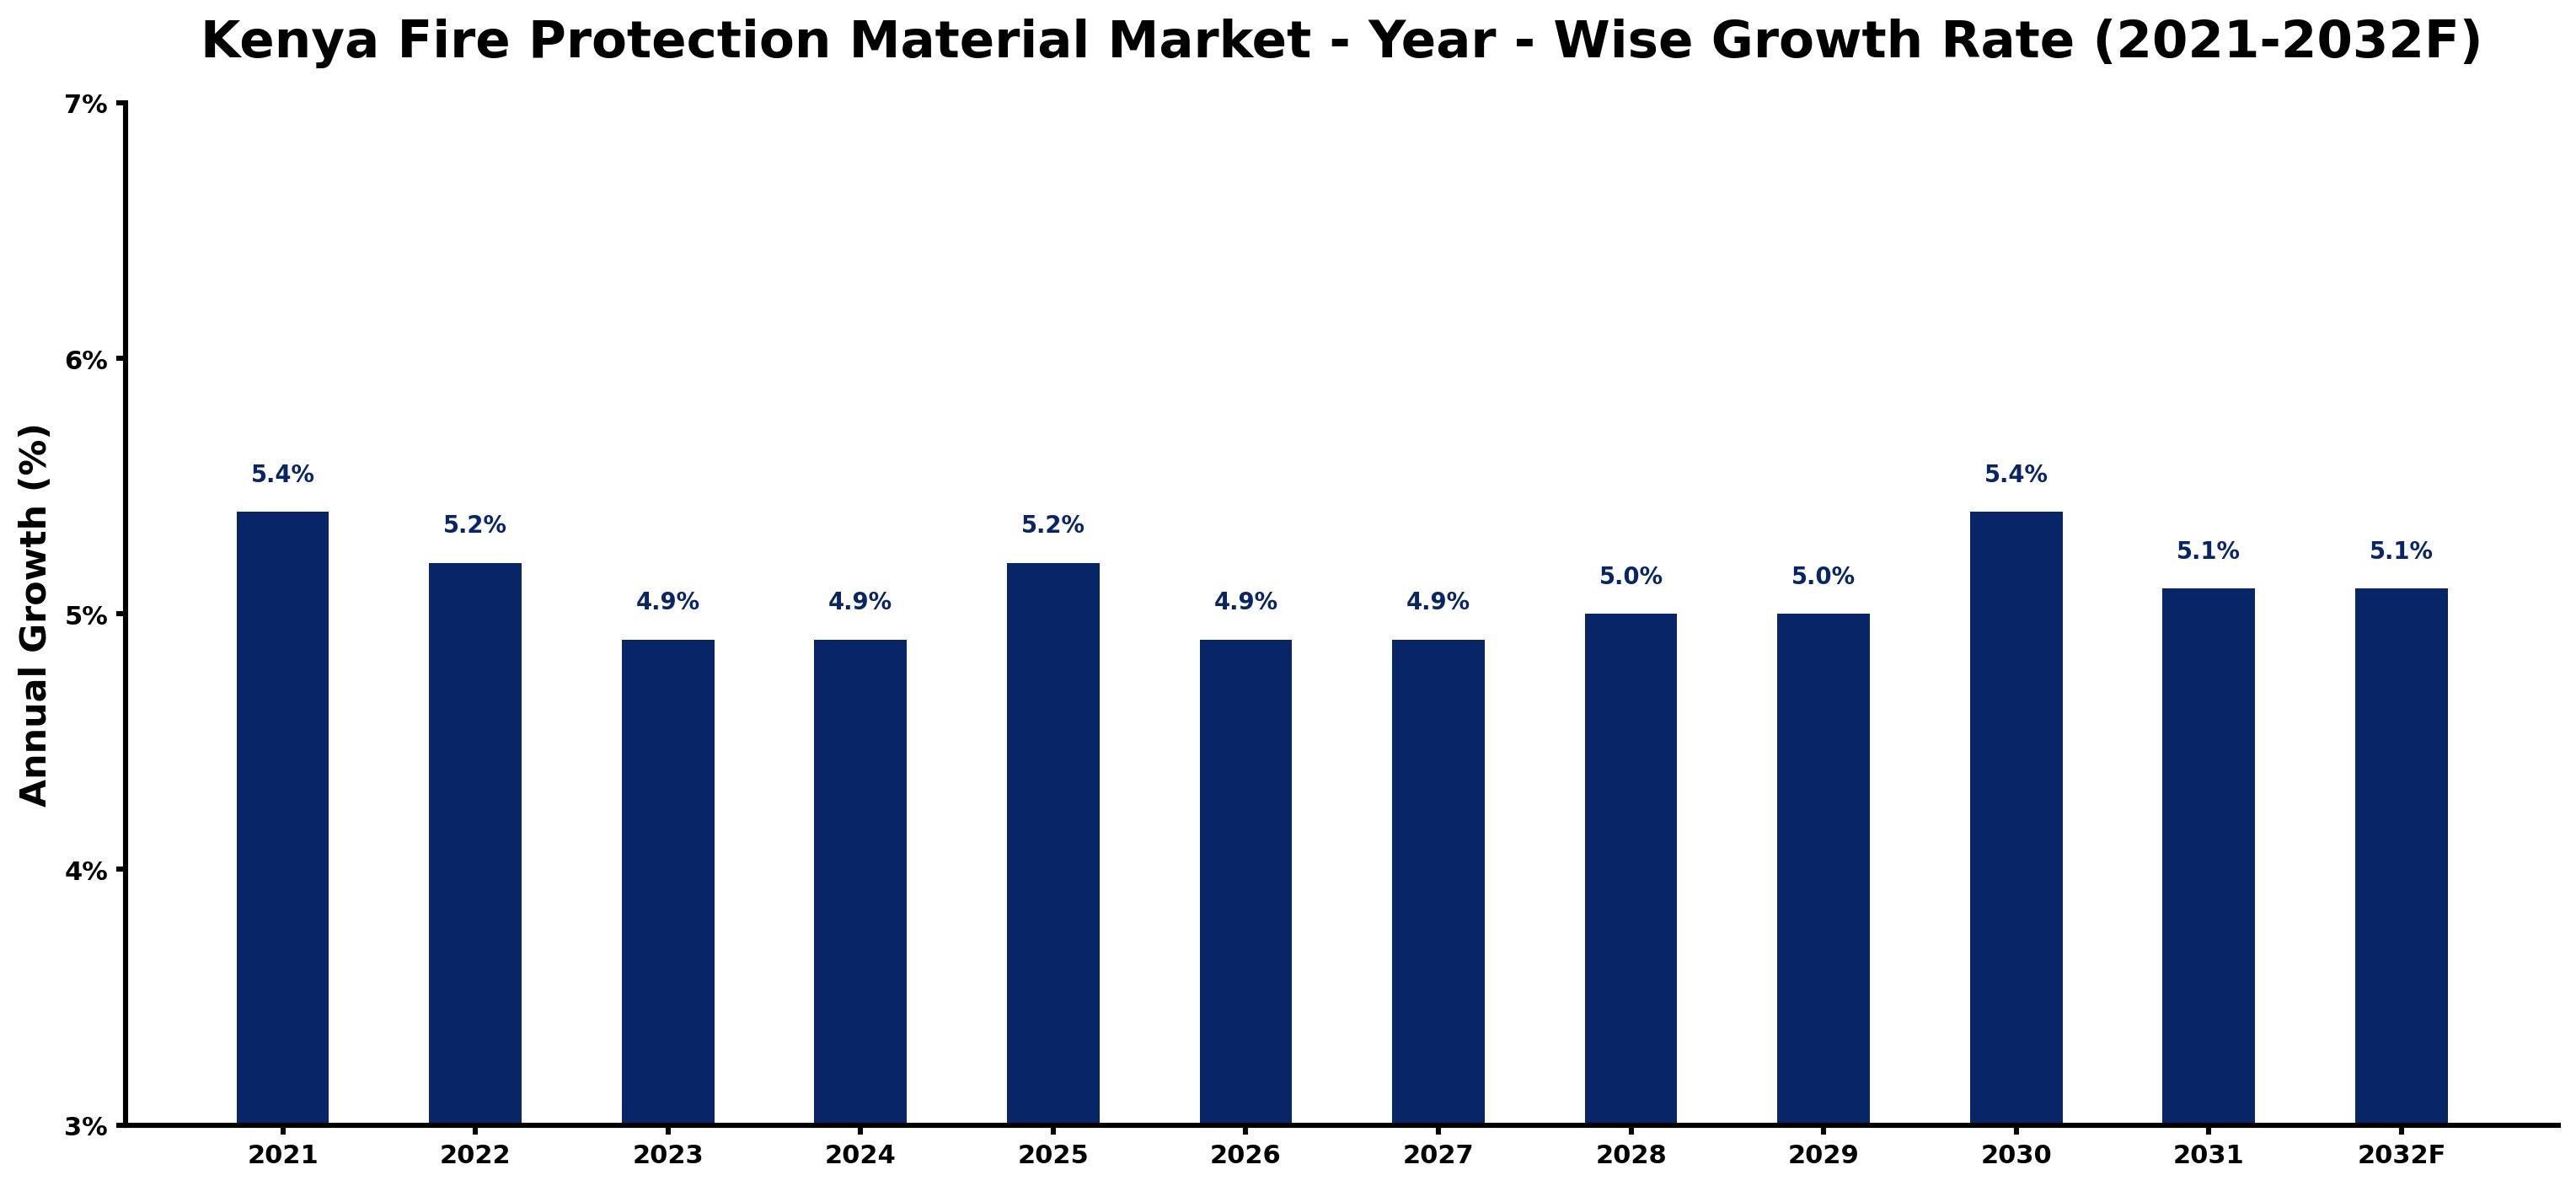
The table below presents the year wise growth rates along with the key drivers influencing the market
| Year | Growth Rate | Major Drivers |
| 2021 | 5.4% | Economic recovery post-pandemic encourages investments in fire safety infrastructure. |
| 2022 | 5.2% | Intensified awareness of fire hazards boosts demand for protective materials in construction. |
| 2023 | 4.9% | Increasing urbanization leads to more high-rise buildings, necessitating advanced fire protection solutions. |
| 2024 | 4.9% | Local manufacturers emphasize quality, creating competitive products for fire safety requirements. |
| 2025 | 5.2% | Insurance industry pressures businesses to adopt better fire prevention measures for compliance. |
| 2026 | 4.9% | Innovative fire-retardant materials emerge, enhancing performance and safety in various sectors. |
| 2027 | 4.9% | Public-private partnerships facilitate large-scale fire safety projects across urban areas. |
| 2028 | 5.0% | Technological integration in fire protection systems improves efficiency and reliability significantly. |
| 2029 | 5.0% | Climate change impacts necessitate adaptation in fire safety strategies for diverse environments. |
| 2030 | 5.4% | Education programs raise awareness, promoting proactive fire safety measures among communities. |
| 2031 | 5.1% | Increased construction activity fuels a corresponding rise in fire protection material usage. |
| 2032 | 5.1% | Market consolidation sees leading firms acquiring innovative startups for enhanced product offerings. |
Note - Market size estimations and growth projections presented in this report are based on 6Wresearch's advanced forecasting approach, validated with industry datasets as of June 2026.
Kenya Fire Protection Material Market Synopsis
The Kenya Fire Protection Material Market is projected to reach 4.9% and witness significant growth during the forecast period (2026-2032). This growth is primarily driven by increasing investments in safety systems across various sectors, including government, industrial, commercial, residential, healthcare, and educational institutions. The rising demand for effective fire protection materials is closely correlated with the expansion of construction activities throughout the country, creating substantial opportunities for market participants. As urbanization continues to rise, the need for sophisticated fire safety solutions becomes increasingly critical, reinforcing the market's trajectory.
Kenya Fire Protection Material Market Growth Drivers
The expansion of the Kenya Fire Protection Material Market is influenced by several key growth drivers:
- The rapid increase in construction activities is a significant factor, as new buildings require comprehensive fire safety measures, leading to heightened demand for fire protection materials.
- Government initiatives aimed at improving safety standards in both public and private infrastructures contribute to market growth, as regulations increasingly require robust fire protection solutions.
- Technological advancements in fire protection materials enhance their effectiveness and appeal, driving market adoption across various sectors.
- The rising awareness of fire hazards, particularly in densely populated areas, is encouraging businesses and households alike to invest in better fire protection systems.
- With the growth of the healthcare and educational sectors, the demand for specialized fire protection materials is expected to surge, given the unique safety requirements of these environments.
Kenya Fire Protection Material Market Challenges and Restraints
Despite its positive outlook, the Kenya Fire Protection Material Market faces several challenges:
- The high initial investment required for advanced fire protection systems may deter some stakeholders, particularly smaller enterprises and residential property owners.
- Inconsistent regulatory enforcement regarding fire safety standards can create uncertainty in market dynamics and impact overall compliance.
- Limited access to cutting-edge materials and technologies may hinder the market's ability to fully adopt innovative solutions.
- Market players may face logistical challenges in sourcing high-quality materials, especially in remote regions, potentially affecting supply chain efficiency.
- Economic fluctuations and variations in public spending can impact governmental and institutional investments in fire protection initiatives, posing a risk to market stability.
Kenya Fire Protection Material Market Investment Opportunities
The evolving landscape of the Kenya Fire Protection Material Market presents various investment opportunities:
- Investing in research and development can provide firms with the competitive edge necessary to innovate and create next-generation fire protection materials.
- Public-private partnerships may enhance resource mobilization for large-scale fire safety projects, particularly in under-resourced regions.
- The increasing focus on sustainability in construction opens avenues for eco-friendly fire protection materials, appealing to environmentally conscious consumers.
- Training and certification programs for fire safety professionals can foster a skilled workforce, thereby enhancing market capabilities.
- Expanding distribution networks to reach rural and underserved areas could significantly bolster market growth and accessibility.
Kenya Fire Protection Material Market Government Investment and Initiatives
The Kenyan government has been proactive in investing in fire safety initiatives to mitigate risks associated with fires. These investments are evident in various public policies and development plans aimed at improving overall safety standards:
- The government has launched national campaigns to raise awareness about fire safety, promoting the importance of fire protection systems in both residential and commercial buildings.
- Increased budget allocations for emergency services have improved the preparedness of local authorities to respond to fire hazards effectively.
- Development projects focusing on infrastructure enhancements often include fire safety assessments and upgrades, ensuring that new constructions meet stringent safety regulations.
- Incentives for businesses that invest in fire protection solutions are being considered as part of broader safety compliance strategies.
- National guidelines on fire safety practices are being enforced, creating a framework that encourages investments in high-quality fire protection materials.
Kenya Fire Protection Material Market Latest Developments (May 2025 - June 2026)
The Kenya Fire Protection Material Market has witnessed notable developments between May 2025 and June 2026. Key industry trends during this period include:
- Enhanced collaboration between governmental bodies and private sector players has led to the development of new fire safety regulations, promoting higher standards of fire protection across various industries.
- Innovative fire protection materials have been introduced to the market, focusing on improved performance and compliance with international fire safety standards.
- Training programs aimed at enhancing fire safety knowledge among professionals have gained traction, improving the overall competency in handling fire safety measures.
- Substantial investment in public infrastructure projects has incorporated comprehensive fire safety planning, further embedding fire protection in construction practices.
- The focus on sustainability has seen an uptick in the development of green fire protection materials, aligning with global trends toward eco-friendly practices.
Kenya Fire Protection Material Market - Key Attractiveness of the Report
- 10 Years of Market Numbers
- Historical Data Starting from 2022 to 2025
- Base Year: 2025
- Forecast Data until 2032
- Key Performance Indicators Impacting the Market
- Major Upcoming Developments and Projects
Key Highlights of the Report:
- Kenya Fire Protection Material Market Outlook
- Market Size of Kenya Fire Protection Material Market, 2025
- Forecast of Kenya Fire Protection Material Market, 2032F
- Historical Data and Forecast of Kenya Fire Protection Material Revenues & Volume for the Period 2022-2032F
- Kenya Fire Protection Material Market Trend Evolution
- Kenya Fire Protection Material Market Drivers and Challenges
- Kenya Fire Protection Material Price Trends
- Kenya Fire Protection Material Porter's Five Forces
- Kenya Fire Protection Material Industry Life Cycle
- Historical Data and Forecast of Kenya Fire Protection Material Market Revenues & Volume By Type for the Period 2022-2032F
- Historical Data and Forecast of Kenya Fire Protection Material Market Revenues & Volume By Sealants for the Period 2022-2032F
- Historical Data and Forecast of Kenya Fire Protection Material Market Revenues & Volume By Mortar for the Period 2022-2032F
- Historical Data and Forecast of Kenya Fire Protection Material Market Revenues & Volume By Putty for the Period 2022-2032F
- Historical Data and Forecast of Kenya Fire Protection Material Market Revenues & Volume By Spray for the Period 2022-2032F
- Historical Data and Forecast of Kenya Fire Protection Material Market Revenues & Volume By Sheets/Boards for the Period 2022-2032F
- Historical Data and Forecast of Kenya Fire Protection Material Market Revenues & Volume By Others for the Period 2022-2032F
- Historical Data and Forecast of Kenya Fire Protection Material Market Revenues & Volume By Application Type for the Period 2022-2032F
- Historical Data and Forecast of Kenya Fire Protection Material Market Revenues & Volume By Residential for the Period 2022-2032F
- Historical Data and Forecast of Kenya Fire Protection Material Market Revenues & Volume By Commercial for the Period 2022-2032F
- Historical Data and Forecast of Kenya Fire Protection Material Market Revenues & Volume By Industrial for the Period 2022-2032F
- Historical Data and Forecast of Kenya Fire Protection Material Market Revenues & Volume By Elevator Technology for the Period 2022-2032F
- Historical Data and Forecast of Kenya Fire Protection Material Market Revenues & Volume By Traction & Machine Room Less Traction for the Period 2022-2032F
- Historical Data and Forecast of Kenya Fire Protection Material Market Revenues & Volume By Hydraulic for the Period 2022-2032F
- Historical Data and Forecast of Kenya Fire Protection Material Market Revenues & Volume By End-User for the Period 2022-2032F
- Historical Data and Forecast of Kenya Fire Protection Material Market Revenues & Volume By Residential for the Period 2022-2032F
- Historical Data and Forecast of Kenya Fire Protection Material Market Revenues & Volume By Commercial for the Period 2022-2032F
- Historical Data and Forecast of Kenya Fire Protection Material Market Revenues & Volume By Institutional for the Period 2022-2032F
- Historical Data and Forecast of Kenya Fire Protection Material Market Revenues & Volume By Infrastructural for the Period 2022-2032F
- Historical Data and Forecast of Kenya Fire Protection Material Market Revenues & Volume By Others for the Period 2022-2032F
- Kenya Fire Protection Material Import Export Trade Statistics
- Market Opportunity Assessment By Type
- Market Opportunity Assessment By Application Type
- Market Opportunity Assessment By Elevator Technology
- Market Opportunity Assessment By End-User
- Kenya Fire Protection Material Top Companies Market Share
- Kenya Fire Protection Material Competitive Benchmarking By Technical and Operational Parameters
- Kenya Fire Protection Material Company Profiles
- Kenya Fire Protection Material Key Strategic Recommendations
Frequently Asked Questions About the Market Study (FAQs):
The growth is driven by increased investments in safety systems, construction activities, and a rising awareness of fire hazards among various sectors.
Challenges include high initial costs, inconsistent regulatory enforcement, and logistical difficulties in material sourcing.
By investing in research and development, public-private partnerships, and expanding distribution networks, businesses can enhance their market presence.
The government supports the market through fire safety initiatives, public spending on infrastructure, and the enforcement of regulatory standards.
6Wresearch actively monitors the Kenya Fire Protection Material Market and publishes its comprehensive annual report, highlighting emerging trends, growth drivers, revenue analysis, and forecast outlook. Our insights help businesses to make data-backed strategic decisions with ongoing market dynamics. Our analysts track relevent industries related to the Kenya Fire Protection Material Market, allowing our clients with actionable intelligence and reliable forecasts tailored to emerging regional needs.
Yes, we provide customisation as per your requirements. To learn more, feel free to contact us on sales@6wresearch.com
1 Executive Summary |
2 Introduction |
2.1 Key Highlights of the Report |
2.2 Report Description |
2.3 Market Scope & Segmentation |
2.4 Research Methodology |
2.5 Assumptions |
3 Kenya Fire Protection Material Market Overview |
3.1 Kenya Country Macro Economic Indicators |
3.2 Kenya Fire Protection Material Market Revenues & Volume, 2022 & 2032F |
3.3 Kenya Fire Protection Material Market - Industry Life Cycle |
3.4 Kenya Fire Protection Material Market - Porter's Five Forces |
3.5 Kenya Fire Protection Material Market Revenues & Volume Share, By Type, 2022 & 2032F |
3.6 Kenya Fire Protection Material Market Revenues & Volume Share, By Application Type, 2022 & 2032F |
3.7 Kenya Fire Protection Material Market Revenues & Volume Share, By Elevator Technology, 2022 & 2032F |
3.8 Kenya Fire Protection Material Market Revenues & Volume Share, By End-User, 2022 & 2032F |
4 Kenya Fire Protection Material Market Dynamics |
4.1 Impact Analysis |
4.2 Market Drivers |
4.3 Market Restraints |
5 Kenya Fire Protection Material Market Trends |
6 Kenya Fire Protection Material Market, By Types |
6.1 Kenya Fire Protection Material Market, By Type |
6.1.1 Overview and Analysis |
6.1.2 Kenya Fire Protection Material Market Revenues & Volume, By Type, 2022-2032F |
6.1.3 Kenya Fire Protection Material Market Revenues & Volume, By Sealants, 2022-2032F |
6.1.4 Kenya Fire Protection Material Market Revenues & Volume, By Mortar, 2022-2032F |
6.1.5 Kenya Fire Protection Material Market Revenues & Volume, By Putty, 2022-2032F |
6.1.6 Kenya Fire Protection Material Market Revenues & Volume, By Spray, 2022-2032F |
6.1.7 Kenya Fire Protection Material Market Revenues & Volume, By Sheets/Boards, 2022-2032F |
6.1.8 Kenya Fire Protection Material Market Revenues & Volume, By Others, 2022-2032F |
6.2 Kenya Fire Protection Material Market, By Application Type |
6.2.1 Overview and Analysis |
6.2.2 Kenya Fire Protection Material Market Revenues & Volume, By Residential, 2022-2032F |
6.2.3 Kenya Fire Protection Material Market Revenues & Volume, By Commercial, 2022-2032F |
6.2.4 Kenya Fire Protection Material Market Revenues & Volume, By Industrial, 2022-2032F |
6.3 Kenya Fire Protection Material Market, By Elevator Technology |
6.3.1 Overview and Analysis |
6.3.2 Kenya Fire Protection Material Market Revenues & Volume, By Traction & Machine Room Less Traction, 2022-2032F |
6.3.3 Kenya Fire Protection Material Market Revenues & Volume, By Hydraulic, 2022-2032F |
6.4 Kenya Fire Protection Material Market, By End-User |
6.4.1 Overview and Analysis |
6.4.2 Kenya Fire Protection Material Market Revenues & Volume, By Residential, 2022-2032F |
6.4.3 Kenya Fire Protection Material Market Revenues & Volume, By Commercial, 2022-2032F |
6.4.4 Kenya Fire Protection Material Market Revenues & Volume, By Institutional, 2022-2032F |
6.4.5 Kenya Fire Protection Material Market Revenues & Volume, By Infrastructural, 2022-2032F |
6.4.6 Kenya Fire Protection Material Market Revenues & Volume, By Others, 2022-2032F |
7 Kenya Fire Protection Material Market Import-Export Trade Statistics |
7.1 Kenya Fire Protection Material Market Export to Major Countries |
7.2 Kenya Fire Protection Material Market Imports from Major Countries |
8 Kenya Fire Protection Material Market Key Performance Indicators |
9 Kenya Fire Protection Material Market - Opportunity Assessment |
9.1 Kenya Fire Protection Material Market Opportunity Assessment, By Type, 2022 & 2032F |
9.2 Kenya Fire Protection Material Market Opportunity Assessment, By Application Type, 2022 & 2032F |
9.3 Kenya Fire Protection Material Market Opportunity Assessment, By Elevator Technology, 2022 & 2032F |
9.4 Kenya Fire Protection Material Market Opportunity Assessment, By End-User, 2022 & 2032F |
10 Kenya Fire Protection Material Market - Competitive Landscape |
10.1 Kenya Fire Protection Material Market Revenue Share, By Companies, 2025 |
10.2 Kenya Fire Protection Material Market Competitive Benchmarking, By Operating and Technical Parameters |
11 Company Profiles |
12 Recommendations |
13 Disclaimer |
Global Go To Market Strategy - 2030
Export potential enables firms to identify high-growth global markets with greater confidence by combining advanced trade intelligence with a structured quantitative methodology. The framework analyzes emerging demand trends and country-level import patterns while integrating macroeconomic and trade datasets such as GDP and population forecasts, bilateral import–export flows, tariff structures, elasticity differentials between developed and developing economies, geographic distance, and import demand projections. Using weighted trade values from 2020–2024 as the base period to project country-to-country export potential for 2030, these inputs are operationalized through calculated drivers such as gravity model parameters, tariff impact factors, and projected GDP per-capita growth. Through an analysis of hidden potentials, demand hotspots, and market conditions that are most favorable to success, this method enables firms to focus on target countries, maximize returns, and global expansion with data, backed by accuracy.
By factoring in the projected importer demand gap that is currently unmet and could be potential opportunity, it identifies the potential for the Exporter (Country) among 190 countries, against the general trade analysis, which identifies the biggest importer or exporter.
To discover high-growth global markets and optimize your business strategy:
Click Here
Pricing
- Single User License$ 1,995
- Department License$ 2,400
- Site License$ 3,120
- Global License$ 3,795

Leadership Perspectives from Industry Events
Search
Thought Leadership and Analyst Meet


Our Clients
6WResearch In News
- India Air Conditioner Market Set for Strong Rebound in 2026 After Weather-Led Correction and GST-Driven Recovery: 6Wresearch
- ADAS in India: How Automatic Emergency Braking, Blind Spot Detection & Driver Monitoring are Transforming Road Safety
- Doha a strategic location for EV manufacturing hub: IPA Qatar
- Demand for luxury TVs surging in the GCC, says Samsung
- Empowering Growth: The Thriving Journey of Bangladesh’s Cable Industry
- Demand for luxury TVs surging in the GCC, says Samsung
Latest Reports
- Nicaragua RPG Gaming Market (2026-2032)
- New Zealand RPG Gaming Market (2026-2032)
- Netherlands RPG Gaming Market (2026-2032)
- Nauru RPG Gaming Market (2026-2032)
- Namibia RPG Gaming Market (2026-2032)
- Mozambique RPG Gaming Market (2026-2032)
- Montenegro RPG Gaming Market (2026-2032)
- Mongolia RPG Gaming Market (2026-2032)
- Monaco RPG Gaming Market (2026-2032)
- Micronesia RPG Gaming Market (2026-2032)
Industry Events and Analyst Meet

EV India Expo 2026

HIMTEX 2026

India Refining Summit 2026

India EV Show 2026

EV tech India Expo 2026
Whitepaper
- Middle East & Africa Commercial Security Market Click here to view more.
- Middle East & Africa Fire Safety Systems & Equipment Market Click here to view more.
- GCC Drone Market Click here to view more.
- Middle East Lighting Fixture Market Click here to view more.
- GCC Physical & Perimeter Security Market Click here to view more.