Kenya Fish Processing Market (2026-2032) | Companies, Forecast, Outlook, Industry, Trends, Share, Value, Analysis, Revenue, Size & Growth
Market Forecast By Source (Marine, Inland, Freshwater), By Application (Food, Feed, Biomedical, Others), By Processing (Frozen, Preserved, Others), By Equipment (Gutting, Scaling, Filleting, Deboning, Skinning, Curing & Smoking, Others) And Competitive Landscape
| Product Code: ETC042630 | Publication Date: Jan 2021 | Updated Date: Jun 2026 | Product Type: Report | |
| Publisher: 6Wresearch | Author: Vasudha | No. of Pages: 70 | No. of Figures: 35 | No. of Tables: 5 |
Kenya Fish Processing Market Summary
The kenya fish processing market was estimated at USD 1255 Million in 2025 and is projected to reach USD 1822 Million by 2032, growing at a CAGR of 6.6% from 2026 to 2032.
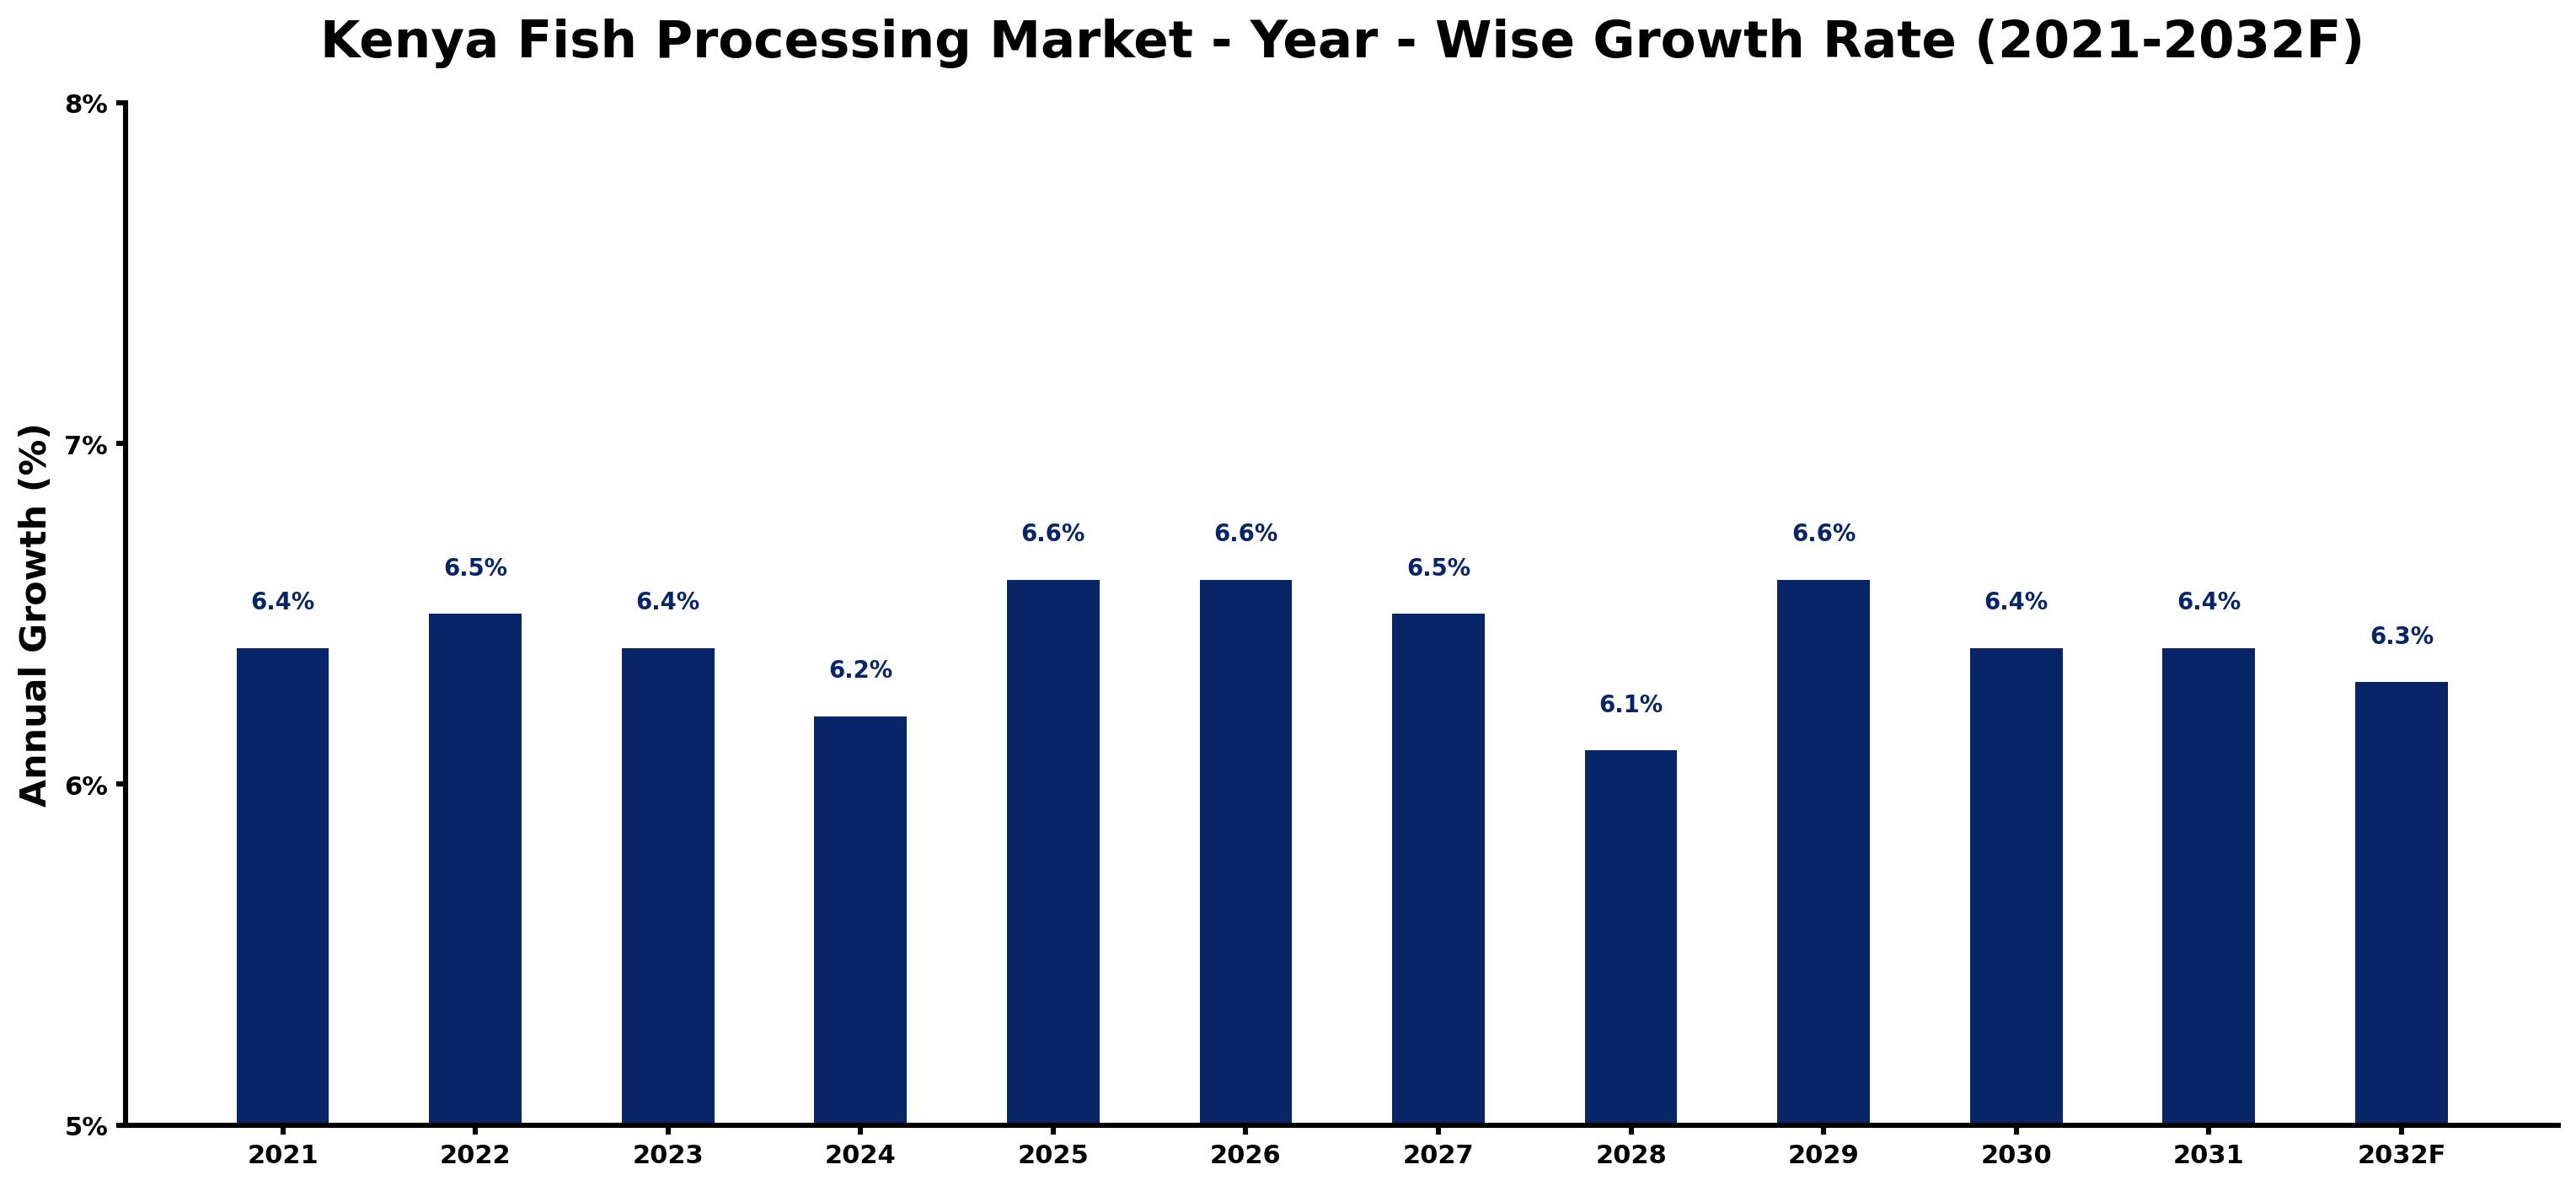
Kenya Fish Processing Market Growth Rate Analysis (2021-2032)
The Kenya fish processing market is exhibiting stable growth, with annual growth rates fluctuating around 6.4% to 6.6% from 2021 through 2032. This steady performance can be attributed to rising consumer demand for processed fish both domestically and in export markets. Investment in technology and infrastructure enhancements has also played a pivotal role, fostering more efficient processing operations. Notably, the growth rate dipped slightly to 6.2% in 2024, likely due to a temporary slowdown in raw material supply linked to environmental factors. However, subsequent years show recovery as adoption of sustainable practices and energy-efficient processing technologies gain momentum. Overall, the sector remains resilient, adapting to evolving consumer preferences while embracing digitalization in its operations.
Kenya Fish Processing Market Year-wise Growth Rate and Key Drivers
This graph highlights how the Kenya Fish Processing Market has steadily grown over the past five years, supported by major growth factors.
The table below presents the year wise growth rates along with the key drivers influencing the market
| Year | Growth Rate | Major Drivers |
| 2021 | 6.4% | Kenya's fish processing market sees a significant demand for sustainable seafood products. |
| 2022 | 6.5% | Investments in cold chain logistics enhance the distribution of processed fish to urban areas. |
| 2023 | 6.4% | Improved fishing techniques lead to higher quality raw materials for processors. |
| 2024 | 6.2% | Local communities increasingly recognize the economic benefits of fish processing ventures. |
| 2025 | 6.6% | Partnerships with international firms boost technology transfer for efficient processing methods. |
| 2026 | 6.6% | Emergence of private equity interest spurs innovation and modernization in processing facilities. |
| 2027 | 6.5% | Increased awareness of nutritional benefits promotes fish consumption among urban populations. |
| 2028 | 6.1% | Regulatory changes support sustainable fishing practices, enhancing market credibility and growth. |
| 2029 | 6.6% | Export opportunities expand as international seafood standards align with local practices. |
| 2030 | 6.4% | Urbanization creates a larger market base for convenient, ready-to-eat fish products. |
| 2031 | 6.4% | Consumer preferences shift towards organic and ethically sourced seafood alternatives. |
| 2032 | 6.3% | Integration of digital marketing strategies transforms market engagement and customer outreach. |
Note - Market size estimations and growth projections presented in this report are based on 6Wresearch's advanced forecasting approach, validated with industry datasets as of June 2026.
Kenya Fish Processing Market Synopsis
The Kenya Fish Processing Market is projected to reach 6.6% and witness significant growth during the forecast period (2026-2032). This growth is largely driven by increasing domestic and international demand for processed fish products. The sector encompasses various activities including fish filleting, smoking, canning, and freezing, supported by a growing recognition of the health benefits associated with fish consumption. Furthermore, the expansion of the tourism industry in Kenya contributes to a heightened demand for seafood, while governmental initiatives are establishing a conducive environment for the fish processing sector.
Kenya Fish Processing Market Growth Drivers
Key factors propelling the Kenya Fish Processing Market include:
- The increasing health consciousness among consumers is driving higher fish consumption, as fish is recognized for its nutritional benefits, including omega-3 fatty acids.
- Kenya's vibrant tourism sector enhances local demand for seafood, with both locals and tourists seeking diverse and high-quality fish products.
- Government initiatives aimed at bolstering the fish processing industry, including financial support and investment incentives, are crucial for market advancement.
- Technological innovations in processing techniques contribute to improved efficiency and quality, enabling producers to meet both national and international standards.
- Consumer preferences are shifting towards value-added products, such as ready-to-cook fish and gourmet seafood options, driving product diversification in the market.
Kenya Fish Processing Market Trends and Opportunities
The Kenya Fish Processing Market exhibits several emerging trends that present lucrative opportunities:
- There is a significant rise in demand for value-added fish products, including fillets, smoked fish, and fish cakes, driven by changing consumer preferences and rising disposable incomes.
- A strong emphasis on sustainable fishing practices is shaping the industry landscape, with processors increasingly adopting eco-friendly methods to appeal to environmentally conscious consumers.
- Technological advancements in processing equipment are enhancing operational efficiency, thereby enabling fish processors to achieve higher quality outputs and greater production volumes.
- The emergence of e-commerce platforms is expanding market reach, allowing fish processors to tap into wider customer bases by leveraging online sales channels.
- Investments in branding and marketing of local processed fish products are gaining traction, which can enhance consumer awareness and foster loyalty in both domestic and export markets.
Kenya Fish Processing Market Challenges and Restraints
Despite the positive outlook, the Kenya Fish Processing Market faces several challenges that could impede growth:
- Inadequate infrastructure, particularly in cold storage and transportation, poses a significant barrier to efficient processing and distribution, leading to product quality issues.
- High energy costs associated with processing operations can reduce profit margins, forcing companies to innovate or seek subsidies to remain competitive.
- The need for technology upgrades is critical, as many local processors currently do not meet international quality standards, which limits export potential.
- Regulatory inconsistencies and cumbersome licensing processes can delay market entry and discourage new investments in the processing sector.
- Environmental challenges, including overfishing and climate change, threaten the sustainability of fish stocks, further complicating supply chain dynamics.
Kenya Fish Processing Market Investment Opportunities
The investment landscape in the Kenya Fish Processing Market is promising, given the following opportunities:
- With a growing middle-class population, there is an escalating demand for modernized fish processing facilities equipped with advanced technology to enhance product quality.
- Investors can capitalize on the trend towards sustainability by focusing on environmentally-friendly fishing and processing practices to attract ethically-minded consumers.
- Establishing strong partnerships with local fishermen can ensure consistent supply chains, enabling processors to maintain product availability and freshness.
- There are opportunities for product diversification, where processors can develop new and innovative seafood products tailored to local tastes and preferences.
- Government incentives aimed at enhancing the fish processing industry provide an additional layer of support for new investments, fostering an attractive environment for potential investors.
Kenya Fish Processing Market Government Investment and Initiatives
The Kenyan government has proactively implemented various policies to support the growth of the Kenya Fish Processing Market. Key initiatives include:
- The Fisheries Management and Development Act, which regulates fishing activities to ensure sustainability and conservation of fish resources, ultimately benefiting the processing sector.
- Establishment of the Fish Inspection and Quality Control Division to enforce quality standards, thereby ensuring consumer safety and confidence in processed fish products.
- Financial incentives and support programs, such as the Aquaculture Business Development Program, aimed at fostering investments in modern fish processing infrastructures and technologies.
- Promotion of science-based management practices to enhance fish stock levels, thus securing future supply for the processing industry.
- Collaboration with stakeholders to develop a coherent strategy for the fisheries sector that emphasizes economic growth while protecting marine ecosystems.
Kenya Fish Processing Market Latest Developments (May 2025 - June 2026)
In the period from May 2025 to June 2026, the Kenya Fish Processing Market has seen several notable developments, reflecting the industry's dynamic nature. A growing emphasis on achieving international quality standards has led to increased investment in modern processing technologies. Additionally, initiatives promoting environmentally sustainable fishing practices have gained momentum, aligning with global market trends. The sector has also seen heightened collaboration between government bodies and private stakeholders aimed at addressing infrastructure challenges. Furthermore, the rise of e-commerce platforms has opened new avenues for market access and consumer engagement, prompting local processors to innovate and diversify their product offerings.
Kenya Fish Processing Market - Key Attractiveness of the Report
- 10 Years of Market Numbers
- Historical Data Starting from 2022 to 2025
- Base Year: 2025
- Forecast Data until 2032
- Key Performance Indicators Impacting the Market
- Major Upcoming Developments and Projects
Key Highlights of the Report:
- Kenya Fish Processing Market Outlook
- Market Size of Kenya Fish Processing Market, 2025
- Forecast of Kenya Fish Processing Market, 2032F
- Historical Data and Forecast of Kenya Fish Processing Revenues & Volume for the Period 2022-2032F
- Kenya Fish Processing Market Trend Evolution
- Kenya Fish Processing Market Drivers and Challenges
- Kenya Fish Processing Price Trends
- Kenya Fish Processing Porter's Five Forces
- Kenya Fish Processing Industry Life Cycle
- Historical Data and Forecast of Kenya Fish Processing Market Revenues & Volume By Source for the Period 2022-2032F
- Historical Data and Forecast of Kenya Fish Processing Market Revenues & Volume By Marine for the Period 2022-2032F
- Historical Data and Forecast of Kenya Fish Processing Market Revenues & Volume By Inland for the Period 2022-2032F
- Historical Data and Forecast of Kenya Fish Processing Market Revenues & Volume By Freshwater for the Period 2022-2032F
- Historical Data and Forecast of Kenya Fish Processing Market Revenues & Volume By Application for the Period 2022-2032F
- Historical Data and Forecast of Kenya Fish Processing Market Revenues & Volume By Food for the Period 2022-2032F
- Historical Data and Forecast of Kenya Fish Processing Market Revenues & Volume By Feed for the Period 2022-2032F
- Historical Data and Forecast of Kenya Fish Processing Market Revenues & Volume By Biomedical for the Period 2022-2032F
- Historical Data and Forecast of Kenya Fish Processing Market Revenues & Volume By Others for the Period 2022-2032F
- Historical Data and Forecast of Kenya Fish Processing Market Revenues & Volume By Processing for the Period 2022-2032F
- Historical Data and Forecast of Kenya Fish Processing Market Revenues & Volume By Frozen for the Period 2022-2032F
- Historical Data and Forecast of Kenya Fish Processing Market Revenues & Volume By Preserved for the Period 2022-2032F
- Historical Data and Forecast of Kenya Fish Processing Market Revenues & Volume By Others for the Period 2022-2032F
- Historical Data and Forecast of Kenya Fish Processing Market Revenues & Volume By Equipment for the Period 2022-2032F
- Historical Data and Forecast of Kenya Fish Processing Market Revenues & Volume By Gutting for the Period 2022-2032F
- Historical Data and Forecast of Kenya Fish Processing Market Revenues & Volume By Scaling for the Period 2022-2032F
- Historical Data and Forecast of Kenya Fish Processing Market Revenues & Volume By Filleting for the Period 2022-2032F
- Historical Data and Forecast of Kenya Fish Processing Market Revenues & Volume By Deboning for the Period 2022-2032F
- Historical Data and Forecast of Kenya Fish Processing Market Revenues & Volume By Skinning for the Period 2022-2032F
- Historical Data and Forecast of Kenya Fish Processing Market Revenues & Volume By Curing & Smoking for the Period 2022-2032F
- Historical Data and Forecast of Kenya Fish Processing Market Revenues & Volume By Others for the Period 2022-2032F
- Kenya Fish Processing Import Export Trade Statistics
- Market Opportunity Assessment By Source
- Market Opportunity Assessment By Application
- Market Opportunity Assessment By Processing
- Market Opportunity Assessment By Equipment
- Kenya Fish Processing Top Companies Market Share
- Kenya Fish Processing Competitive Benchmarking By Technical and Operational Parameters
- Kenya Fish Processing Company Profiles
- Kenya Fish Processing Key Strategic Recommendations
Frequently Asked Questions About the Market Study (FAQs):
Increasing demand for processed fish products, health awareness among consumers, and government support initiatives are key growth drivers in the Kenya Fish Processing Market.
The market faces challenges such as inadequate infrastructure, high energy costs, and the need for technology upgrades to meet international quality standards.
Opportunities include modernizing processing facilities, adopting sustainable practices, and diversifying product offerings to cater to changing consumer preferences.
The government supports the market through various policies, including financial incentives for investments, enforcement of quality standards, and regulations aimed at sustainable fish resource management.
6Wresearch actively monitors the Kenya Fish Processing Market and publishes its comprehensive annual report, highlighting emerging trends, growth drivers, revenue analysis, and forecast outlook. Our insights help businesses to make data-backed strategic decisions with ongoing market dynamics. Our analysts track relevent industries related to the Kenya Fish Processing Market, allowing our clients with actionable intelligence and reliable forecasts tailored to emerging regional needs.
Yes, we provide customisation as per your requirements. To learn more, feel free to contact us on sales@6wresearch.com
1 Executive Summary |
2 Introduction |
2.1 Key Highlights of the Report |
2.2 Report Description |
2.3 Market Scope & Segmentation |
2.4 Research Methodology |
2.5 Assumptions |
3 Kenya Fish Processing Market Overview |
3.1 Kenya Country Macro Economic Indicators |
3.2 Kenya Fish Processing Market Revenues & Volume, 2022 & 2032F |
3.3 Kenya Fish Processing Market - Industry Life Cycle |
3.4 Kenya Fish Processing Market - Porter's Five Forces |
3.5 Kenya Fish Processing Market Revenues & Volume Share, By Source, 2022 & 2032F |
3.6 Kenya Fish Processing Market Revenues & Volume Share, By Application, 2022 & 2032F |
3.7 Kenya Fish Processing Market Revenues & Volume Share, By Processing, 2022 & 2032F |
3.8 Kenya Fish Processing Market Revenues & Volume Share, By Equipment, 2022 & 2032F |
4 Kenya Fish Processing Market Dynamics |
4.1 Impact Analysis |
4.2 Market Drivers |
4.3 Market Restraints |
5 Kenya Fish Processing Market Trends |
6 Kenya Fish Processing Market, By Types |
6.1 Kenya Fish Processing Market, By Source |
6.1.1 Overview and Analysis |
6.1.2 Kenya Fish Processing Market Revenues & Volume, By Source, 2022-2032F |
6.1.3 Kenya Fish Processing Market Revenues & Volume, By Marine, 2022-2032F |
6.1.4 Kenya Fish Processing Market Revenues & Volume, By Inland, 2022-2032F |
6.1.5 Kenya Fish Processing Market Revenues & Volume, By Freshwater, 2022-2032F |
6.2 Kenya Fish Processing Market, By Application |
6.2.1 Overview and Analysis |
6.2.2 Kenya Fish Processing Market Revenues & Volume, By Food, 2022-2032F |
6.2.3 Kenya Fish Processing Market Revenues & Volume, By Feed, 2022-2032F |
6.2.4 Kenya Fish Processing Market Revenues & Volume, By Biomedical, 2022-2032F |
6.2.5 Kenya Fish Processing Market Revenues & Volume, By Others, 2022-2032F |
6.3 Kenya Fish Processing Market, By Processing |
6.3.1 Overview and Analysis |
6.3.2 Kenya Fish Processing Market Revenues & Volume, By Frozen, 2022-2032F |
6.3.3 Kenya Fish Processing Market Revenues & Volume, By Preserved, 2022-2032F |
6.3.4 Kenya Fish Processing Market Revenues & Volume, By Others, 2022-2032F |
6.4 Kenya Fish Processing Market, By Equipment |
6.4.1 Overview and Analysis |
6.4.2 Kenya Fish Processing Market Revenues & Volume, By Gutting, 2022-2032F |
6.4.3 Kenya Fish Processing Market Revenues & Volume, By Scaling, 2022-2032F |
6.4.4 Kenya Fish Processing Market Revenues & Volume, By Filleting, 2022-2032F |
6.4.5 Kenya Fish Processing Market Revenues & Volume, By Deboning, 2022-2032F |
6.4.6 Kenya Fish Processing Market Revenues & Volume, By Skinning, 2022-2032F |
6.4.7 Kenya Fish Processing Market Revenues & Volume, By Curing & Smoking, 2022-2032F |
7 Kenya Fish Processing Market Import-Export Trade Statistics |
7.1 Kenya Fish Processing Market Export to Major Countries |
7.2 Kenya Fish Processing Market Imports from Major Countries |
8 Kenya Fish Processing Market Key Performance Indicators |
9 Kenya Fish Processing Market - Opportunity Assessment |
9.1 Kenya Fish Processing Market Opportunity Assessment, By Source, 2022 & 2032F |
9.2 Kenya Fish Processing Market Opportunity Assessment, By Application, 2022 & 2032F |
9.3 Kenya Fish Processing Market Opportunity Assessment, By Processing, 2022 & 2032F |
9.4 Kenya Fish Processing Market Opportunity Assessment, By Equipment, 2022 & 2032F |
10 Kenya Fish Processing Market - Competitive Landscape |
10.1 Kenya Fish Processing Market Revenue Share, By Companies, 2025 |
10.2 Kenya Fish Processing Market Competitive Benchmarking, By Operating and Technical Parameters |
11 Company Profiles |
12 Recommendations |
13 Disclaimer |
Global Go To Market Strategy - 2030
Export potential enables firms to identify high-growth global markets with greater confidence by combining advanced trade intelligence with a structured quantitative methodology. The framework analyzes emerging demand trends and country-level import patterns while integrating macroeconomic and trade datasets such as GDP and population forecasts, bilateral import–export flows, tariff structures, elasticity differentials between developed and developing economies, geographic distance, and import demand projections. Using weighted trade values from 2020–2024 as the base period to project country-to-country export potential for 2030, these inputs are operationalized through calculated drivers such as gravity model parameters, tariff impact factors, and projected GDP per-capita growth. Through an analysis of hidden potentials, demand hotspots, and market conditions that are most favorable to success, this method enables firms to focus on target countries, maximize returns, and global expansion with data, backed by accuracy.
By factoring in the projected importer demand gap that is currently unmet and could be potential opportunity, it identifies the potential for the Exporter (Country) among 190 countries, against the general trade analysis, which identifies the biggest importer or exporter.
To discover high-growth global markets and optimize your business strategy:
Click Here
Pricing
- Single User License$ 1,995
- Department License$ 2,400
- Site License$ 3,120
- Global License$ 3,795

Leadership Perspectives from Industry Events
Search
Thought Leadership and Analyst Meet


Our Clients
6WResearch In News
- India Air Conditioner Market Set for Strong Rebound in 2026 After Weather-Led Correction and GST-Driven Recovery: 6Wresearch
- ADAS in India: How Automatic Emergency Braking, Blind Spot Detection & Driver Monitoring are Transforming Road Safety
- Doha a strategic location for EV manufacturing hub: IPA Qatar
- Demand for luxury TVs surging in the GCC, says Samsung
- Empowering Growth: The Thriving Journey of Bangladesh’s Cable Industry
- Demand for luxury TVs surging in the GCC, says Samsung
Latest Reports
- Nicaragua RPG Gaming Market (2026-2032)
- New Zealand RPG Gaming Market (2026-2032)
- Netherlands RPG Gaming Market (2026-2032)
- Nauru RPG Gaming Market (2026-2032)
- Namibia RPG Gaming Market (2026-2032)
- Mozambique RPG Gaming Market (2026-2032)
- Montenegro RPG Gaming Market (2026-2032)
- Mongolia RPG Gaming Market (2026-2032)
- Monaco RPG Gaming Market (2026-2032)
- Micronesia RPG Gaming Market (2026-2032)
Industry Events and Analyst Meet

HIMTEX 2026

India Refining Summit 2026

India EV Show 2026

EV tech India Expo 2026

Auto Tech Asia 2026
Whitepaper
- Middle East & Africa Commercial Security Market Click here to view more.
- Middle East & Africa Fire Safety Systems & Equipment Market Click here to view more.
- GCC Drone Market Click here to view more.
- Middle East Lighting Fixture Market Click here to view more.
- GCC Physical & Perimeter Security Market Click here to view more.