Kenya Food Packaging Market (2026-2032) | Forecast, Companies, Industry, Growth, Analysis, Trends, Share, Revenue, Outlook, Size & Value
Market Forecast By Material Types (Paper & board, Plastic, Metal, Glass, Others), By Product Types (Rigid, Semi-Rigid, Flexible), By Applications (Bakery & Confectionary, Dairy Products, Fruits & Vegetables, Meat, Poultry, & Seafood, Sauces & Dressings, Others) And Competitive Landscape
| Product Code: ETC006790 | Publication Date: Sep 2020 | Updated Date: Jun 2026 | Product Type: Report | |
| Publisher: 6Wresearch | Author: Shubham Padhi | No. of Pages: 70 | No. of Figures: 35 | No. of Tables: 5 |
Kenya Food Packaging Market Summary
The kenya food packaging market was estimated at USD 467 Million in 2025 and is projected to reach USD 651 Million by 2032, growing at a CAGR of 6.0% from 2026 to 2032.
Kenya Food Packaging Market Year-wise Growth Rate and Key Drivers
This graph highlights how the Kenya Food Packaging Market has steadily grown over the years, supported by major growth factors.
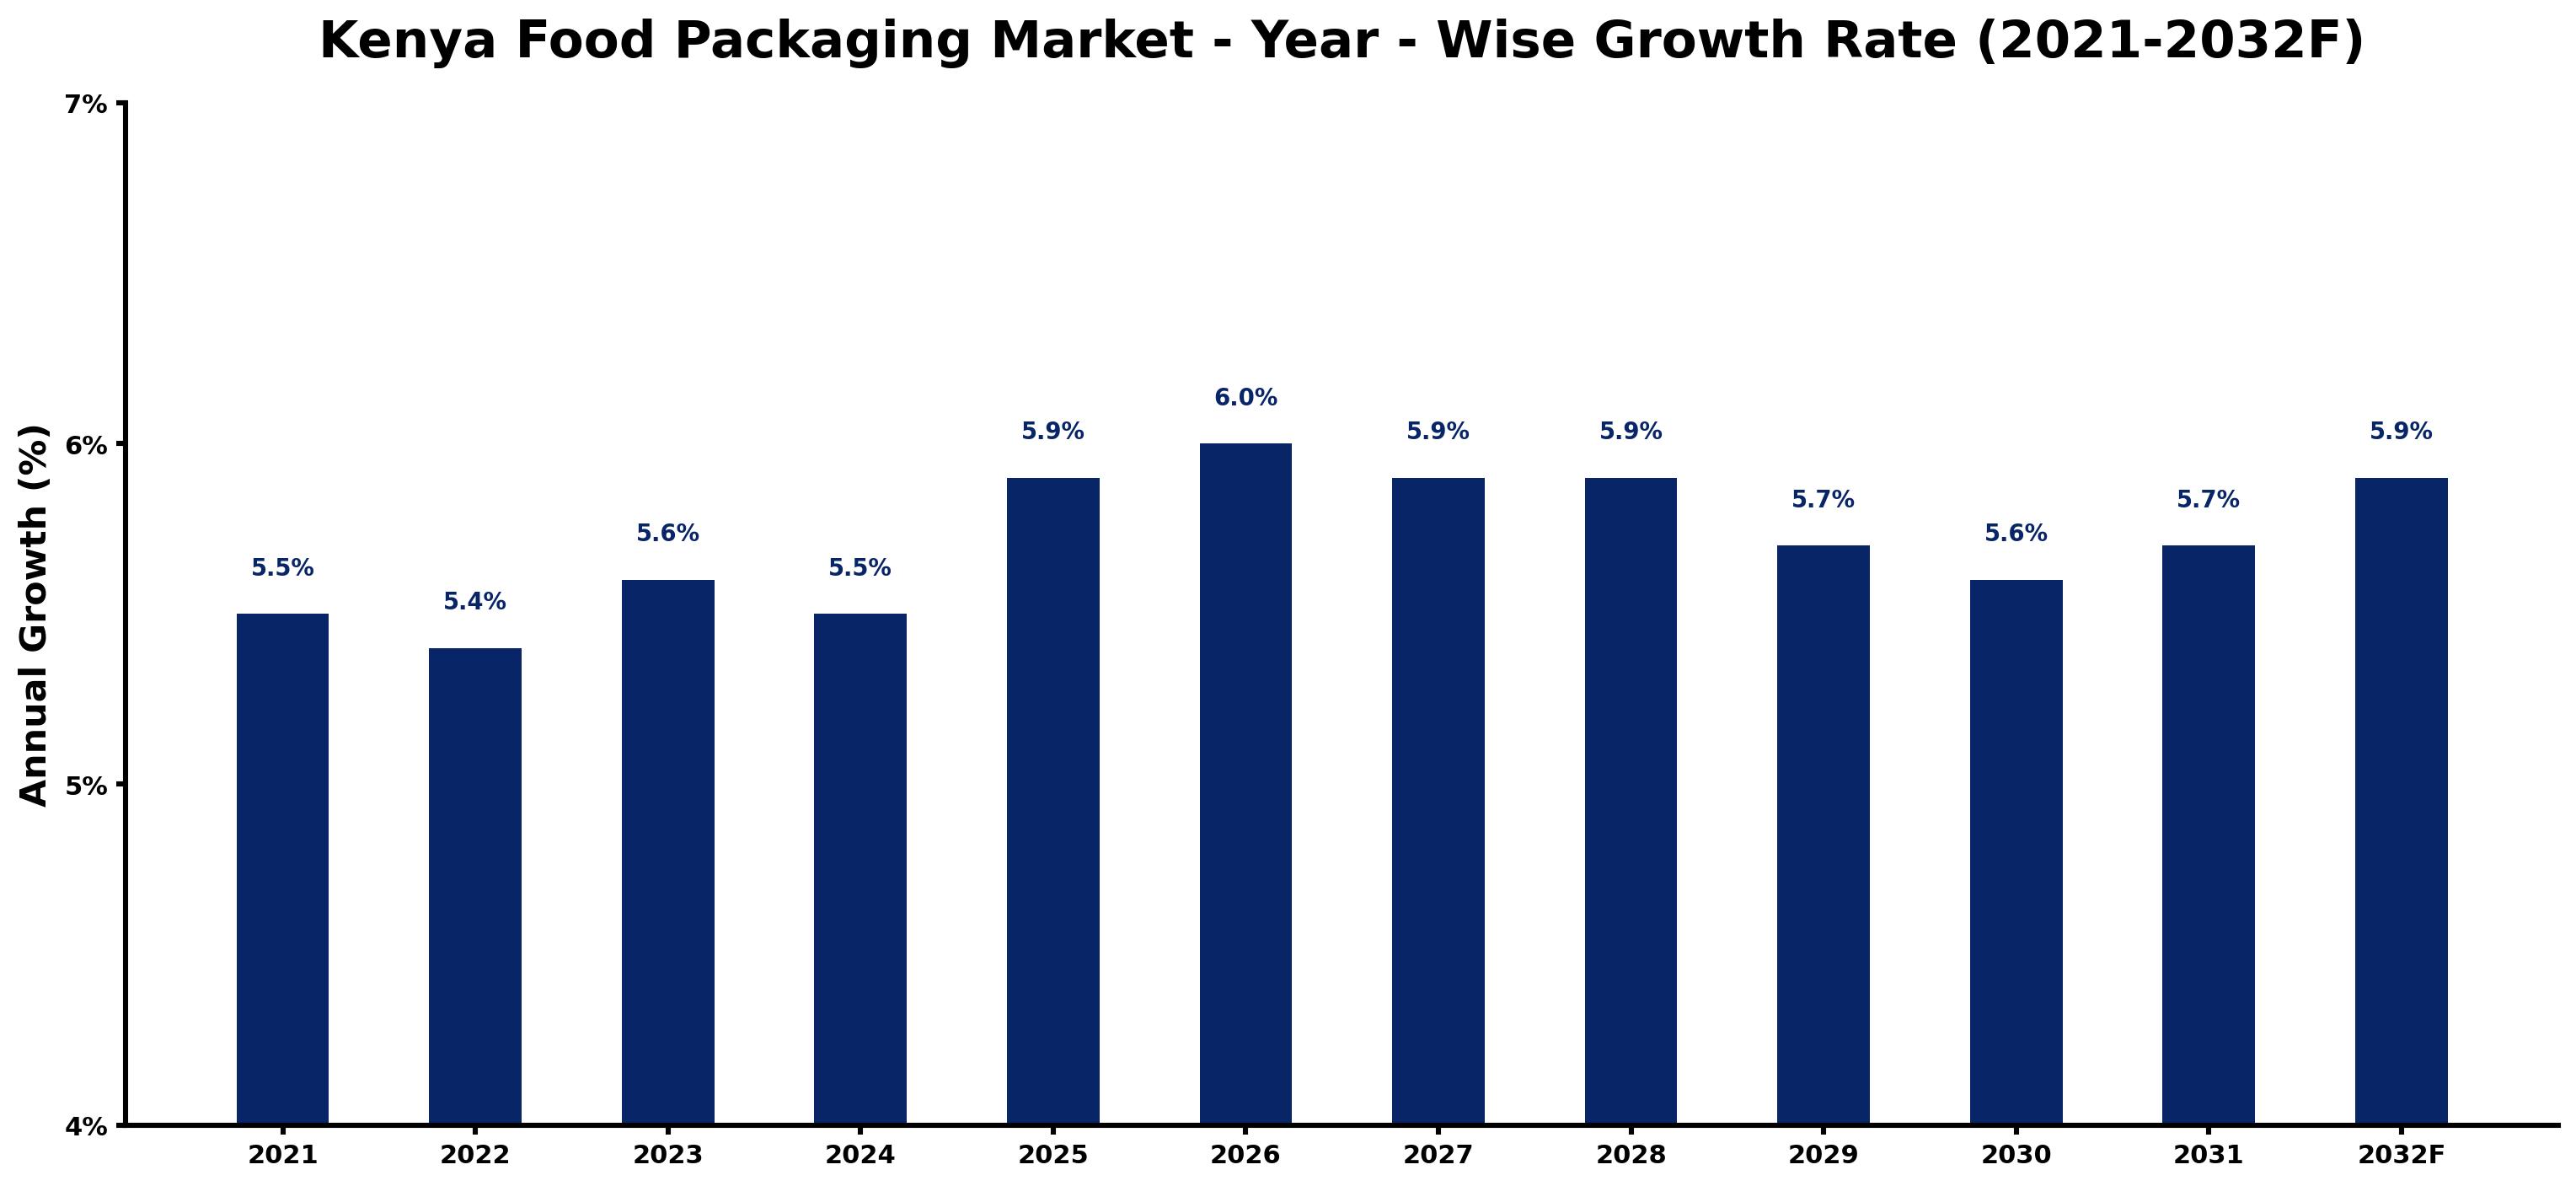
The table below presents the year wise growth rates along with the key drivers influencing the market
| Year | Growth Rate | Major Drivers |
| 2021 | 5.5% | Shifts in consumer preferences highlight sustainability as a crucial packaging consideration. |
| 2022 | 5.4% | Local manufacturing capabilities enhance efficiency, reducing costs for food packaging solutions. |
| 2023 | 5.6% | E-commerce expansion demands innovative packaging solutions for safe product delivery. |
| 2024 | 5.5% | Increased urbanization in Kenya creates a rising need for convenient food packaging options. |
| 2025 | 5.9% | Technological advancements in materials boost recycling rates and consumer appeal. |
| 2026 | 6.0% | Investment in agro-processing industries supports growth in food packaging demand. |
| 2027 | 5.9% | Collaboration between local producers and packaging firms fosters innovation in product design. |
| 2028 | 5.9% | Health and safety standards exert pressure on food packaging quality and durability. |
| 2029 | 5.7% | Digital marketing campaigns drive awareness of eco-friendly packaging benefits to consumers. |
| 2030 | 5.6% | Emerging trends in plant-based packaging materials attract environmentally conscious consumers. |
| 2031 | 5.7% | Sustainability certifications become essential for brands aiming to compete in the market. |
| 2032 | 5.9% | The integration of smart packaging technologies offers enhanced consumer engagement opportunities. |
Note - Market size estimations and growth projections presented in this report are based on 6Wresearch's advanced forecasting approach, validated with industry datasets as of June 2026.
Kenya Food Packaging Market Synopsis
The Kenya Food Packaging Market is projected to reach 6.0% and witness significant growth during the forecast period (2026-2032). This robust expansion is attributed to the increasing demands from the food and beverage sector, shifting consumer preferences towards convenience products, and heightened awareness around food safety and hygiene. The market encompasses a variety of packaging materials, including plastics, paper, board, metal, and glass, with flexible packaging emerging as a dominant segment due to its cost-efficiency, convenience, and sustainability advantages.
Kenya Food Packaging Market Growth Drivers
The growth of the Kenya Food Packaging Market is driven by several factors that reflect the evolving landscape of the food industry. Key drivers include:
- The rapid expansion of the food and beverage sector, which significantly increases the demand for diverse packaging solutions to accommodate various product types.
- Growing consumer trends towards on-the-go and convenience products, prompting manufacturers to adopt innovative packaging formats that enhance usability and portability.
- A rising emphasis on food safety and hygiene, necessitating advancements in packaging technologies to prevent contamination and extend shelf life.
- Increased awareness and demand for eco-friendly packaging options, as consumers become more conscientious about environmental impacts and sustainability.
- Technological advancements in packaging design and materials, leading to improved product visibility, branding opportunities, and overall consumer engagement.
Kenya Food Packaging Market Trends and Opportunities
The Kenya Food Packaging Market is characterized by notable trends and emerging opportunities driven by changing consumer preferences and innovation. Key trends include:
- The rising demand for sustainable and recyclable packaging materials, as both consumers and businesses aim to minimize environmental footprints.
- A growing inclination towards convenience packaging options, such as single-serve and resealable formats, catering to the busy lifestyles of urban consumers.
- Advancements in active and intelligent packaging technologies, which provide functionalities like freshness indicators and modified atmosphere packaging to ensure food safety.
- An increasing focus on health and wellness trends, leading to packaging that not only preserves food quality but also communicates health-related information effectively.
- Opportunities for local manufacturers to innovate and offer tailored packaging solutions that reflect regional tastes and cultural preferences.
Kenya Food Packaging Market Challenges and Restraints
Despite significant growth potential, the Kenya Food Packaging Market faces various challenges that need to be addressed for sustainable development. These include:
- Inadequate infrastructure for the production of packaging materials, which can hinder the efficiency and scalability of local manufacturers.
- Limited access to advanced packaging technologies, resulting in a reliance on outdated practices that may not meet modern consumer expectations.
- High costs associated with importing sophisticated packaging materials, putting pressure on profit margins for local businesses.
- Concerns over the environmental impact of certain packaging choices, driving a demand for sustainable alternatives that are not yet widely available.
- Issues related to inconsistent quality standards and a skilled workforce in the packaging sector, potentially affecting product reliability and market competitiveness.
Kenya Food Packaging Market Government Investment and Initiatives
The Kenyan government is actively engaged in fostering the food packaging sector through a variety of policies and initiatives aimed at enhancing consumer safety, promoting sustainable practices, and supporting industry growth. Key governmental actions include:
- Introduction of regulations focused on labeling requirements and quality standards to prevent food contamination and ensure consumer awareness.
- Initiatives designed to promote the use of eco-friendly packaging materials, aligning with global environmental sustainability goals.
- Support programs aimed at local manufacturers, providing incentives for adopting advanced packaging technologies and practices.
- Investment in infrastructure development to enhance manufacturing capabilities and improve access to essential resources for packaging production.
- Collaborative efforts with international organizations to enhance knowledge sharing and capacity building within the local packaging industry.
Kenya Food Packaging Market Latest Developments (May 2025 - June 2026)
From May 2025 to June 2026, the Kenya Food Packaging Market has seen notable developments indicating a shift towards sustainability and innovation. Significant advancements include an increased number of manufacturers transitioning towards eco-friendly materials in response to consumer pressure for environmentally responsible products. Additionally, there has been a notable rise in collaboration between local producers and technology providers aimed at enhancing packaging efficiency and food safety standards through innovative solutions. The introduction of new regulations governing packaging materials has encouraged companies to innovate, further aligning with the global push for sustainable practices. Moreover, public awareness campaigns have promoted the benefits of responsible packaging choices, helping to shift consumer preferences towards products that prioritize sustainability. Overall, these developments underscore a transformative period for the Kenya Food Packaging Market as it adapts to evolving demands and regulatory frameworks.
Kenya Food Packaging Market - Key Attractiveness of the Report
- 10 Years of Market Numbers
- Historical Data Starting from 2022 to 2025
- Base Year: 2025
- Forecast Data until 2032
- Key Performance Indicators Impacting the Market
- Major Upcoming Developments and Projects
Key Highlights of the Report:
- Kenya Food Packaging Market Outlook
- Market Size of Kenya Food Packaging Market, 2025
- Forecast of Kenya Food Packaging Market, 2032F
- Historical Data and Forecast of Kenya Food Packaging Revenues & Volume for the Period 2022-2032F
- Kenya Food Packaging Market Trend Evolution
- Kenya Food Packaging Market Drivers and Challenges
- Kenya Food Packaging Price Trends
- Kenya Food Packaging Porter's Five Forces
- Kenya Food Packaging Industry Life Cycle
- Historical Data and Forecast of Kenya Food Packaging Market Revenues & Volume By Material Types for the Period 2022-2032F
- Historical Data and Forecast of Kenya Food Packaging Market Revenues & Volume By Paper & board for the Period 2022-2032F
- Historical Data and Forecast of Kenya Food Packaging Market Revenues & Volume By Plastic for the Period 2022-2032F
- Historical Data and Forecast of Kenya Food Packaging Market Revenues & Volume By Metal for the Period 2022-2032F
- Historical Data and Forecast of Kenya Food Packaging Market Revenues & Volume By Glass for the Period 2022-2032F
- Historical Data and Forecast of Kenya Food Packaging Market Revenues & Volume By Others for the Period 2022-2032F
- Historical Data and Forecast of Kenya Food Packaging Market Revenues & Volume By Product Types for the Period 2022-2032F
- Historical Data and Forecast of Kenya Food Packaging Market Revenues & Volume By Rigid for the Period 2022-2032F
- Historical Data and Forecast of Kenya Food Packaging Market Revenues & Volume By Semi-Rigid for the Period 2022-2032F
- Historical Data and Forecast of Kenya Food Packaging Market Revenues & Volume By Flexible for the Period 2022-2032F
- Historical Data and Forecast of Kenya Food Packaging Market Revenues & Volume By Applications for the Period 2022-2032F
- Historical Data and Forecast of Kenya Food Packaging Market Revenues & Volume By Bakery & Confectionary for the Period 2022-2032F
- Historical Data and Forecast of Kenya Food Packaging Market Revenues & Volume By Dairy Products for the Period 2022-2032F
- Historical Data and Forecast of Kenya Food Packaging Market Revenues & Volume By Fruits & Vegetables for the Period 2022-2032F
- Historical Data and Forecast of Kenya Food Packaging Market Revenues & Volume By Meat, Poultry, & Seafood for the Period 2022-2032F
- Historical Data and Forecast of Kenya Food Packaging Market Revenues & Volume By Sauces & Dressings for the Period 2022-2032F
- Historical Data and Forecast of Kenya Food Packaging Market Revenues & Volume By Others for the Period 2022-2032F
- Kenya Food Packaging Import Export Trade Statistics
- Market Opportunity Assessment By Material Types
- Market Opportunity Assessment By Product Types
- Market Opportunity Assessment By Applications
- Kenya Food Packaging Top Companies Market Share
- Kenya Food Packaging Competitive Benchmarking By Technical and Operational Parameters
- Kenya Food Packaging Company Profiles
- Kenya Food Packaging Key Strategic Recommendations
Frequently Asked Questions About the Market Study (FAQs):
Flexible packaging, along with plastics, paper, and glass, comprise the dominant materials in the Kenya Food Packaging Market.
There is an increasing consumer preference for eco-friendly and sustainable packaging solutions, alongside convenience features such as resealable options.
Challenges include inadequate infrastructure, limited access to advanced technologies, and high costs associated with importing packaging materials.
The government implements regulations and initiatives aimed at ensuring consumer safety, promoting sustainability, and supporting local manufacturers in the food packaging industry.
6Wresearch actively monitors the Kenya Food Packaging Market and publishes its comprehensive annual report, highlighting emerging trends, growth drivers, revenue analysis, and forecast outlook. Our insights help businesses to make data-backed strategic decisions with ongoing market dynamics. Our analysts track relevent industries related to the Kenya Food Packaging Market, allowing our clients with actionable intelligence and reliable forecasts tailored to emerging regional needs.
Yes, we provide customisation as per your requirements. To learn more, feel free to contact us on sales@6wresearch.com
1 Executive Summary |
2 Introduction |
2.1 Key Highlights of the Report |
2.2 Report Description |
2.3 Market Scope & Segmentation |
2.4 Research Methodology |
2.5 Assumptions |
3 Kenya Food Packaging Market Overview |
3.1 Kenya Country Macro Economic Indicators |
3.2 Kenya Food Packaging Market Revenues & Volume, 2022 & 2032F |
3.3 Kenya Food Packaging Market - Industry Life Cycle |
3.4 Kenya Food Packaging Market - Porter's Five Forces |
3.5 Kenya Food Packaging Market Revenues & Volume Share, By Material Types, 2022 & 2032F |
3.6 Kenya Food Packaging Market Revenues & Volume Share, By Product Types, 2022 & 2032F |
3.7 Kenya Food Packaging Market Revenues & Volume Share, By Applications, 2022 & 2032F |
4 Kenya Food Packaging Market Dynamics |
4.1 Impact Analysis |
4.2 Market Drivers |
4.3 Market Restraints |
5 Kenya Food Packaging Market Trends |
6 Kenya Food Packaging Market, By Types |
6.1 Kenya Food Packaging Market, By Material Types |
6.1.1 Overview and Analysis |
6.1.2 Kenya Food Packaging Market Revenues & Volume, By Material Types, 2022-2032F |
6.1.3 Kenya Food Packaging Market Revenues & Volume, By Paper & board, 2022-2032F |
6.1.4 Kenya Food Packaging Market Revenues & Volume, By Plastic, 2022-2032F |
6.1.5 Kenya Food Packaging Market Revenues & Volume, By Metal, 2022-2032F |
6.1.6 Kenya Food Packaging Market Revenues & Volume, By Glass, 2022-2032F |
6.1.7 Kenya Food Packaging Market Revenues & Volume, By Others, 2022-2032F |
6.2 Kenya Food Packaging Market, By Product Types |
6.2.1 Overview and Analysis |
6.2.2 Kenya Food Packaging Market Revenues & Volume, By Rigid, 2022-2032F |
6.2.3 Kenya Food Packaging Market Revenues & Volume, By Semi-Rigid, 2022-2032F |
6.2.4 Kenya Food Packaging Market Revenues & Volume, By Flexible, 2022-2032F |
6.3 Kenya Food Packaging Market, By Applications |
6.3.1 Overview and Analysis |
6.3.2 Kenya Food Packaging Market Revenues & Volume, By Bakery & Confectionary, 2022-2032F |
6.3.3 Kenya Food Packaging Market Revenues & Volume, By Dairy Products, 2022-2032F |
6.3.4 Kenya Food Packaging Market Revenues & Volume, By Fruits & Vegetables, 2022-2032F |
6.3.5 Kenya Food Packaging Market Revenues & Volume, By Meat, Poultry, & Seafood, 2022-2032F |
6.3.6 Kenya Food Packaging Market Revenues & Volume, By Sauces & Dressings, 2022-2032F |
6.3.7 Kenya Food Packaging Market Revenues & Volume, By Others, 2022-2032F |
7 Kenya Food Packaging Market Import-Export Trade Statistics |
7.1 Kenya Food Packaging Market Export to Major Countries |
7.2 Kenya Food Packaging Market Imports from Major Countries |
8 Kenya Food Packaging Market Key Performance Indicators |
9 Kenya Food Packaging Market - Opportunity Assessment |
9.1 Kenya Food Packaging Market Opportunity Assessment, By Material Types, 2022 & 2032F |
9.2 Kenya Food Packaging Market Opportunity Assessment, By Product Types, 2022 & 2032F |
9.3 Kenya Food Packaging Market Opportunity Assessment, By Applications, 2022 & 2032F |
10 Kenya Food Packaging Market - Competitive Landscape |
10.1 Kenya Food Packaging Market Revenue Share, By Companies, 2025 |
10.2 Kenya Food Packaging Market Competitive Benchmarking, By Operating and Technical Parameters |
11 Company Profiles |
12 Recommendations |
13 Disclaimer |
Global Go To Market Strategy - 2030
Export potential enables firms to identify high-growth global markets with greater confidence by combining advanced trade intelligence with a structured quantitative methodology. The framework analyzes emerging demand trends and country-level import patterns while integrating macroeconomic and trade datasets such as GDP and population forecasts, bilateral import–export flows, tariff structures, elasticity differentials between developed and developing economies, geographic distance, and import demand projections. Using weighted trade values from 2020–2024 as the base period to project country-to-country export potential for 2030, these inputs are operationalized through calculated drivers such as gravity model parameters, tariff impact factors, and projected GDP per-capita growth. Through an analysis of hidden potentials, demand hotspots, and market conditions that are most favorable to success, this method enables firms to focus on target countries, maximize returns, and global expansion with data, backed by accuracy.
By factoring in the projected importer demand gap that is currently unmet and could be potential opportunity, it identifies the potential for the Exporter (Country) among 190 countries, against the general trade analysis, which identifies the biggest importer or exporter.
To discover high-growth global markets and optimize your business strategy:
Click Here
Pricing
- Single User License$ 1,995
- Department License$ 2,400
- Site License$ 3,120
- Global License$ 3,795

Leadership Perspectives from Industry Events
Search
Thought Leadership and Analyst Meet


Our Clients
6WResearch In News
- India Air Conditioner Market Set for Strong Rebound in 2026 After Weather-Led Correction and GST-Driven Recovery: 6Wresearch
- ADAS in India: How Automatic Emergency Braking, Blind Spot Detection & Driver Monitoring are Transforming Road Safety
- Doha a strategic location for EV manufacturing hub: IPA Qatar
- Demand for luxury TVs surging in the GCC, says Samsung
- Empowering Growth: The Thriving Journey of Bangladesh’s Cable Industry
- Demand for luxury TVs surging in the GCC, says Samsung
Latest Reports
- Nicaragua RPG Gaming Market (2026-2032)
- New Zealand RPG Gaming Market (2026-2032)
- Netherlands RPG Gaming Market (2026-2032)
- Nauru RPG Gaming Market (2026-2032)
- Namibia RPG Gaming Market (2026-2032)
- Mozambique RPG Gaming Market (2026-2032)
- Montenegro RPG Gaming Market (2026-2032)
- Mongolia RPG Gaming Market (2026-2032)
- Monaco RPG Gaming Market (2026-2032)
- Micronesia RPG Gaming Market (2026-2032)
Industry Events and Analyst Meet

EV India Expo 2026

HIMTEX 2026

India Refining Summit 2026

India EV Show 2026

EV tech India Expo 2026
Whitepaper
- Middle East & Africa Commercial Security Market Click here to view more.
- Middle East & Africa Fire Safety Systems & Equipment Market Click here to view more.
- GCC Drone Market Click here to view more.
- Middle East Lighting Fixture Market Click here to view more.
- GCC Physical & Perimeter Security Market Click here to view more.