Kenya Glass Packaging Market (2026-2032) Outlook | Forecast, Size, Revenue, Growth, Analysis, Industry, Trends, Share, Companies & Value
Market Forecast By Glass Type (Type I, Type II, Type III, Others), By Jar Size (20-50 Ml, 51-100 Ml, 101-250 Ml, 251-500 Ml, 500 Ml), By Raw Material (Cullet, Selenium, Cobalt Oxide, Limestone, Dolomite, Coloring Material, Others), By Application (Alcoholic Beverage, Non-alcoholic Beverage, Food, Pharmaceuticals, Personal Care, Beauty Products, Others) And Competitive Landscape
| Product Code: ETC423886 | Publication Date: Oct 2022 | Updated Date: Jul 2026 | Product Type: Market Research Report | |
| Publisher: 6Wresearch | Author: Ravi Bhandari | No. of Pages: 75 | No. of Figures: 35 | No. of Tables: 20 |
Kenya Glass Packaging Market Size, Share & Growth Rate
The Kenya Glass Packaging Market was estimated at USD 374 Million in 2025 and is projected to reach USD 523 Million by 2032, growing at a CAGR of 4.9% from 2026 to 2032. This growth trajectory is largely fueled by the rising demand for sustainable packaging solutions, especially from industries like beverages and food, which are increasingly adopting glass containers for their inherent benefits of preserving product integrity and enhancing brand image. Furthermore, consumer preferences are shifting toward eco-friendly products, creating fertile ground for the glass packaging segment to flourish in Kenya.
Kenya Glass Packaging Market Year-wise Growth Rate and Key Drivers
This graph highlights how the Kenya Glass Packaging Market has steadily grown over the years, supported by major growth factors.
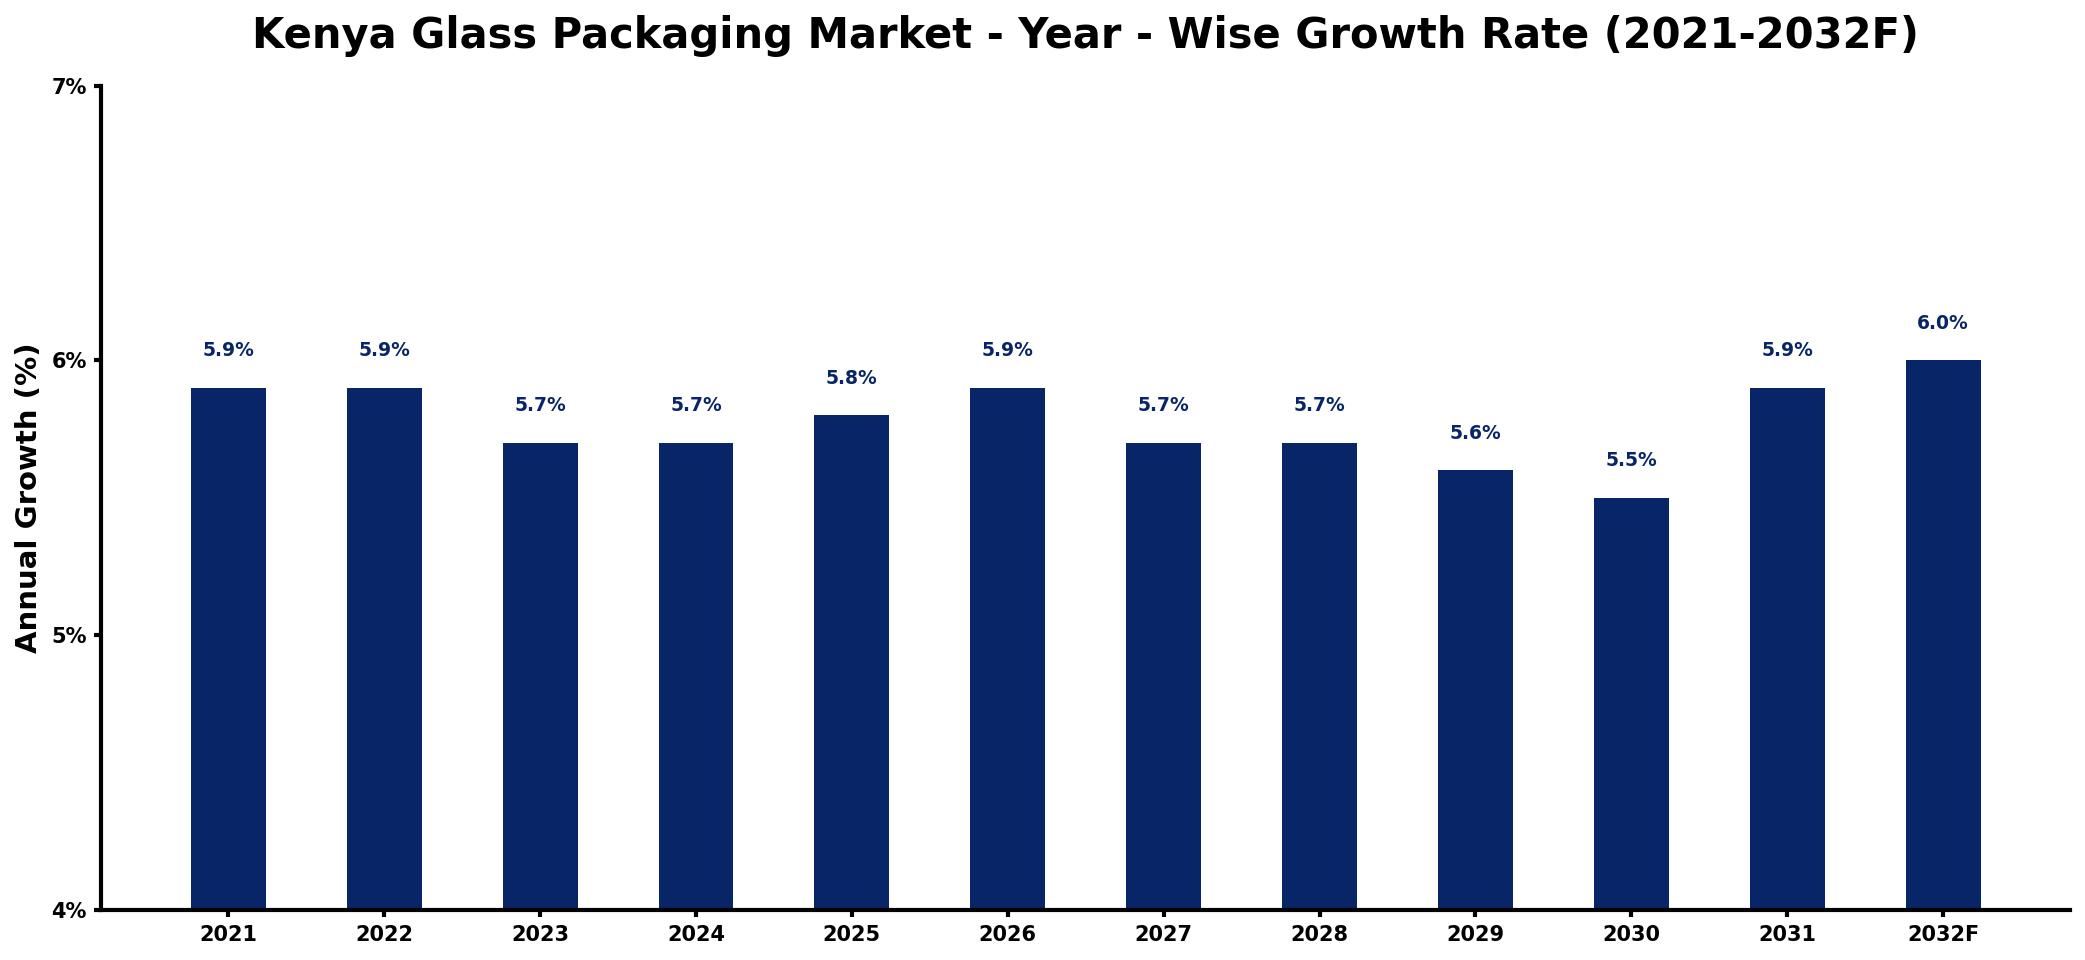
The table below presents the year‑wise growth rates along with the key drivers influencing the market
| Year | Growth Rate | Major Drivers |
| 2021 | 5.9% | Rising demand for sustainable solutions |
| 2022 | 5.9% | Increased investments in production capacity |
| 2023 | 5.7% | Expansion of beverage industry consumption |
| 2024 | 5.7% | Growth in hospitality sector requirements |
| 2025 | 5.8% | Emergence of new consumer trends |
| 2026 | 5.9% | increased domestic production output |
| 2027 | 5.7% | Technological advancements in manufacturing |
| 2028 | 5.7% | Surge in e-commerce delivery services |
| 2029 | 5.6% | Increased focus on recycling initiatives |
| 2030 | 5.5% | increased production capacity utilization |
| 2031 | 5.9% | Rising popularity of premium products |
| 2032 | 6.0% | strengthening underlying market demand |
Note: Market size estimations and growth projections presented in this report are based on 6Wresearch's proprietary forecasting methodology, utilizing the latest available industry data, government publications, and primary research inputs.
Kenya Glass Packaging Market Synopsis
The strongest force shaping the Kenya Glass Packaging Market right now is the growing emphasis on sustainability across various sectors. As companies recognize the importance of environmental responsibility, the adoption of glass packaging solutions is becoming increasingly prevalent, driven by the material's recyclability and ability to preserve product quality.
Moreover, the aesthetics associated with glass packaging offer an added layer of appeal, influencing consumer purchasing decisions. This trend is particularly relevant in the beverage and cosmetic industries, where premium packaging can differentiate products in a crowded marketplace.
Kenya Glass Packaging Market Key Takeaways
- The market is poised for significant growth, driven by a shift toward sustainable packaging practices.
- Glass packaging is favored for its impermeability and recyclability, ensuring product integrity.
- Government policies increasingly promote the adoption and development of glass recycling infrastructure.
- Rising consumer demand for eco-friendly products is influencing packaging choices across industries.
- Challenges related to design innovation and market demand variability continue to impact the sector.
Evaluation of Restraints in Kenya Glass Packaging Market
Despite the promising growth outlook, the Kenya Glass Packaging Market faces a series of constraints. Chief among these is the need for innovation in packaging design, as consumer preferences evolve rapidly. Companies must balance traditional practices with fresh, innovative approaches that align with modern aesthetics and functionalities. Additionally, the environmental impact of glass production and the associated carbon footprint necessitate a careful examination of manufacturing processes to ensure sustainability. Fluctuations in market demand also pose risks, making it essential for businesses to remain agile and responsive to changing consumer behaviors.
Kenya Glass Packaging Market Trends
Current trends in the Kenya Glass Packaging Market indicate a robust movement toward sustainability and circular economy practices. As consumers become more environmentally conscious, brands are increasingly opting for glass packaging as a symbol of quality and eco-friendliness. Furthermore, technological advancements in glass manufacturing are leading to innovative designs and functionalities that cater to diverse consumer needs, thereby enhancing market appeal.
Another notable trend is the increasing collaboration between manufacturers and recyclers, which aims to bolster recycling rates and reduce waste. This synergy not only supports environmental goals but also enhances the overall efficiency of the supply chain.
Kenya Glass Packaging Market Opportunities
The Kenya Glass Packaging Market is rife with opportunities for growth and investment. As the demand for sustainable packaging solutions continues to rise, companies can leverage their expertise in glass manufacturing to create innovative products that cater to environmentally-conscious consumers. The food and beverage sectors, in particular, present lucrative avenues, as brands seek to differentiate themselves through premium glass packaging. Moreover, investments in recycling infrastructure and technology can enhance product lifecycle management, making it possible for companies to capitalize on the growing circular economy.
Government Initiatives in the Kenya Glass Packaging Market
Government policies in Kenya are increasingly supportive of sustainable practices within the glass packaging sector. Regulatory authorities are working to develop comprehensive recycling infrastructure, coupled with initiatives designed to encourage the use of recyclable materials. Public spending is also focused on promoting consumer safety and awareness of the benefits of glass packaging, fostering a more sustainable market environment that aligns with global sustainability goals.
Future Insights of the Kenya Glass Packaging Market
Looking ahead to 2026-2032, the Kenya Glass Packaging Market is set to evolve significantly. The focus on sustainability will intensify, with heightened expectations from consumers regarding eco-friendly packaging. This shift will encourage manufacturers to innovate and implement more efficient production methods that reduce environmental impact. The integration of smart technologies into packaging designs is also expected to emerge, enhancing functionality and consumer engagement. Overall, the market will likely witness a fusion of innovation and sustainability, driving its growth trajectory.
Kenya Glass Packaging Market Latest Developments (2025 - 2026)
In the recent months, the Kenya Glass Packaging Market has seen a notable shift towards innovative packaging solutions that cater to evolving consumer preferences. Industry players are increasingly focusing on developing lightweight glass products to enhance convenience without compromising on quality. Additionally, partnerships between local manufacturers and international firms are emerging, aimed at enhancing technological capabilities and expanding the product range offered in the local market. These developments reflect a dynamic response to consumer demand for high-quality, sustainable packaging.
Kenya Glass Packaging Market - Key Attractiveness of the Report
- 10 Years of Market Numbers
- Historical Data Starting from 2022 to 2025
- Base Year: 2025
- Forecast Data until 2032
- Key Performance Indicators Impacting the Market
- Major Upcoming Developments and Projects
Key Highlights of the Report:
- Kenya Glass Packaging Market Outlook
- Market Size of Kenya Glass Packaging Market, 2025
- Forecast of Kenya Glass Packaging Market, 2032
- Historical Data and Forecast of Kenya Glass Packaging Revenues & Volume for the Period 2022-2032F
- Kenya Glass Packaging Market Trend Evolution
- Kenya Glass Packaging Market Drivers and Challenges
- Kenya Glass Packaging Price Trends
- Kenya Glass Packaging Porter's Five Forces
- Kenya Glass Packaging Industry Life Cycle
- Historical Data and Forecast of Kenya Glass Packaging Market Revenues & Volume By Glass Type for the Period 2022-2032F
- Historical Data and Forecast of Kenya Glass Packaging Market Revenues & Volume By Type I for the Period 2022-2032F
- Historical Data and Forecast of Kenya Glass Packaging Market Revenues & Volume By Type II for the Period 2022-2032F
- Historical Data and Forecast of Kenya Glass Packaging Market Revenues & Volume By Type III for the Period 2022-2032F
- Historical Data and Forecast of Kenya Glass Packaging Market Revenues & Volume By Others for the Period 2022-2032F
- Historical Data and Forecast of Kenya Glass Packaging Market Revenues & Volume By Jar Size for the Period 2022-2032F
- Historical Data and Forecast of Kenya Glass Packaging Market Revenues & Volume By 20-50 Ml for the Period 2022-2032F
- Historical Data and Forecast of Kenya Glass Packaging Market Revenues & Volume By 51-100 Ml for the Period 2022-2032F
- Historical Data and Forecast of Kenya Glass Packaging Market Revenues & Volume By 101-250 Ml for the Period 2022-2032F
- Historical Data and Forecast of Kenya Glass Packaging Market Revenues & Volume By 251-500 Ml for the Period 2022-2032F
- Historical Data and Forecast of Kenya Glass Packaging Market Revenues & Volume By 500 Ml for the Period 2022-2032F
- Historical Data and Forecast of Kenya Glass Packaging Market Revenues & Volume By Raw Material for the Period 2022-2032F
- Historical Data and Forecast of Kenya Glass Packaging Market Revenues & Volume By Cullet for the Period 2022-2032F
- Historical Data and Forecast of Kenya Glass Packaging Market Revenues & Volume By Selenium for the Period 2022-2032F
- Historical Data and Forecast of Kenya Glass Packaging Market Revenues & Volume By Cobalt Oxide for the Period 2022-2032F
- Historical Data and Forecast of Kenya Glass Packaging Market Revenues & Volume By Limestone for the Period 2022-2032F
- Historical Data and Forecast of Kenya Glass Packaging Market Revenues & Volume By Dolomite for the Period 2022-2032F
- Historical Data and Forecast of Kenya Glass Packaging Market Revenues & Volume By Coloring Material for the Period 2022-2032F
- Historical Data and Forecast of Kenya Glass Packaging Market Revenues & Volume By Others for the Period 2022-2032F
- Historical Data and Forecast of Kenya Glass Packaging Market Revenues & Volume By Application for the Period 2022-2032F
- Historical Data and Forecast of Kenya Glass Packaging Market Revenues & Volume By Alcoholic Beverage for the Period 2022-2032F
- Historical Data and Forecast of Kenya Glass Packaging Market Revenues & Volume By Non-alcoholic Beverage for the Period 2022-2032F
- Historical Data and Forecast of Kenya Glass Packaging Market Revenues & Volume By Food for the Period 2022-2032F
- Historical Data and Forecast of Kenya Glass Packaging Market Revenues & Volume By Pharmaceuticals for the Period 2022-2032F
- Historical Data and Forecast of Kenya Glass Packaging Market Revenues & Volume By Personal Care for the Period 2022-2032F
- Historical Data and Forecast of Kenya Glass Packaging Market Revenues & Volume By Beauty Products for the Period 2022-2032F
- Historical Data and Forecast of Kenya Glass Packaging Market Revenues & Volume By Others for the Period 2022-2032F
- Kenya Glass Packaging Import Export Trade Statistics
- Market Opportunity Assessment By Glass Type
- Market Opportunity Assessment By Jar Size
- Market Opportunity Assessment By Raw Material
- Market Opportunity Assessment By Application
- Kenya Glass Packaging Top Companies Market Share
- Kenya Glass Packaging Competitive Benchmarking By Technical and Operational Parameters
- Kenya Glass Packaging Company Profiles
- Kenya Glass Packaging Key Strategic Recommendations
Frequently Asked Questions About the Market Study (FAQs):
The market's growth is significantly driven by the rising demand for sustainable packaging solutions across various industries, notably beverages and food. Increasing consumer awareness about the environmental benefits of glass packaging, coupled with its advantages in preserving product quality, continues to propel its adoption.
The Kenya Glass Packaging Market was estimated at USD 374 Million in 2025 and is projected to reach USD 523 Million by 2032, growing at a CAGR of 4.9% from 2026 to 2032. This growth underscores the increasing reliance on glass packaging as a sustainable alternative.
Government policies are aimed at promoting recyclability and sustainable practices within the glass packaging sector. Initiatives include the development of recycling infrastructure and regulations that encourage the use of recyclable materials, ultimately fostering a more responsible industry landscape.
The market faces challenges related to design innovation and market demand variability. As consumer preferences shift rapidly, companies must continually innovate to remain relevant while addressing the environmental impacts of glass production.
A strong trend in the market is the movement toward sustainability, with an increasing number of brands opting for glass packaging to appeal to eco-conscious consumers. Technological advancements in manufacturing processes are also paving the way for innovative packaging solutions.
6Wresearch actively monitors the Kenya Glass Packaging Market and publishes its comprehensive annual report, highlighting emerging trends, growth drivers, revenue analysis, and forecast outlook. Our insights help businesses to make data-backed strategic decisions with ongoing market dynamics. Our analysts track relevent industries related to the Kenya Glass Packaging Market, allowing our clients with actionable intelligence and reliable forecasts tailored to emerging regional needs.
Yes, we provide customisation as per your requirements. To learn more, feel free to contact us on sales@6wresearch.com
1 Executive Summary |
2 Introduction |
2.1 Key Highlights of the Report |
2.2 Report Description |
2.3 Market Scope & Segmentation |
2.4 Research Methodology |
2.5 Assumptions |
3 Kenya Glass Packaging Market Overview |
3.1 Kenya Country Macro Economic Indicators |
3.2 Kenya Glass Packaging Market Revenues & Volume, 2022 & 2032F |
3.3 Kenya Glass Packaging Market - Industry Life Cycle |
3.4 Kenya Glass Packaging Market - Porter's Five Forces |
3.5 Kenya Glass Packaging Market Revenues & Volume Share, By Glass Type, 2022 & 2032F |
3.6 Kenya Glass Packaging Market Revenues & Volume Share, By Jar Size, 2022 & 2032F |
3.7 Kenya Glass Packaging Market Revenues & Volume Share, By Raw Material, 2022 & 2032F |
3.8 Kenya Glass Packaging Market Revenues & Volume Share, By Application, 2022 & 2032F |
4 Kenya Glass Packaging Market Dynamics |
4.1 Impact Analysis |
4.2 Market Drivers |
4.2.1 Increasing demand for sustainable packaging solutions |
4.2.2 Growth of the food and beverage industry in Kenya |
4.2.3 Rising awareness about the benefits of glass packaging over plastic |
4.3 Market Restraints |
4.3.1 High production costs associated with glass packaging |
4.3.2 Competition from alternative packaging materials |
4.3.3 Limited availability of raw materials for glass production in Kenya |
5 Kenya Glass Packaging Market Trends |
6 Kenya Glass Packaging Market, By Types |
6.1 Kenya Glass Packaging Market, By Glass Type |
6.1.1 Overview and Analysis |
6.1.2 Kenya Glass Packaging Market Revenues & Volume, By Glass Type, 2022-2032F |
6.1.3 Kenya Glass Packaging Market Revenues & Volume, By Type I, 2022-2032F |
6.1.4 Kenya Glass Packaging Market Revenues & Volume, By Type II, 2022-2032F |
6.1.5 Kenya Glass Packaging Market Revenues & Volume, By Type III, 2022-2032F |
6.1.6 Kenya Glass Packaging Market Revenues & Volume, By Others, 2022-2032F |
6.2 Kenya Glass Packaging Market, By Jar Size |
6.2.1 Overview and Analysis |
6.2.2 Kenya Glass Packaging Market Revenues & Volume, By 20-50 Ml, 2022-2032F |
6.2.3 Kenya Glass Packaging Market Revenues & Volume, By 51-100 Ml, 2022-2032F |
6.2.4 Kenya Glass Packaging Market Revenues & Volume, By 101-250 Ml, 2022-2032F |
6.2.5 Kenya Glass Packaging Market Revenues & Volume, By 251-500 Ml, 2022-2032F |
6.2.6 Kenya Glass Packaging Market Revenues & Volume, By 500 Ml, 2022-2032F |
6.3 Kenya Glass Packaging Market, By Raw Material |
6.3.1 Overview and Analysis |
6.3.2 Kenya Glass Packaging Market Revenues & Volume, By Cullet, 2022-2032F |
6.3.3 Kenya Glass Packaging Market Revenues & Volume, By Selenium, 2022-2032F |
6.3.4 Kenya Glass Packaging Market Revenues & Volume, By Cobalt Oxide, 2022-2032F |
6.3.5 Kenya Glass Packaging Market Revenues & Volume, By Limestone, 2022-2032F |
6.3.6 Kenya Glass Packaging Market Revenues & Volume, By Dolomite, 2022-2032F |
6.3.7 Kenya Glass Packaging Market Revenues & Volume, By Coloring Material, 2022-2032F |
6.4 Kenya Glass Packaging Market, By Application |
6.4.1 Overview and Analysis |
6.4.2 Kenya Glass Packaging Market Revenues & Volume, By Alcoholic Beverage, 2022-2032F |
6.4.3 Kenya Glass Packaging Market Revenues & Volume, By Non-alcoholic Beverage, 2022-2032F |
6.4.4 Kenya Glass Packaging Market Revenues & Volume, By Food, 2022-2032F |
6.4.5 Kenya Glass Packaging Market Revenues & Volume, By Pharmaceuticals, 2022-2032F |
6.4.6 Kenya Glass Packaging Market Revenues & Volume, By Personal Care, 2022-2032F |
6.4.7 Kenya Glass Packaging Market Revenues & Volume, By Beauty Products, 2022-2032F |
7 Kenya Glass Packaging Market Import-Export Trade Statistics |
7.1 Kenya Glass Packaging Market Export to Major Countries |
7.2 Kenya Glass Packaging Market Imports from Major Countries |
8 Kenya Glass Packaging Market Key Performance Indicators |
8.1 Percentage of glass packaging recycling rate in Kenya |
8.2 Adoption rate of glass packaging by major industries in Kenya |
8.3 Investment in glass packaging infrastructure and technology in the country |
9 Kenya Glass Packaging Market - Opportunity Assessment |
9.1 Kenya Glass Packaging Market Opportunity Assessment, By Glass Type, 2022 & 2032F |
9.2 Kenya Glass Packaging Market Opportunity Assessment, By Jar Size, 2022 & 2032F |
9.3 Kenya Glass Packaging Market Opportunity Assessment, By Raw Material, 2022 & 2032F |
9.4 Kenya Glass Packaging Market Opportunity Assessment, By Application, 2022 & 2032F |
10 Kenya Glass Packaging Market - Competitive Landscape |
10.1 Kenya Glass Packaging Market Revenue Share, By Companies, 2025 |
10.2 Kenya Glass Packaging Market Competitive Benchmarking, By Operating and Technical Parameters |
11 Company Profiles |
12 Recommendations |
13 Disclaimer |
Global Go To Market Strategy - 2030
Export potential enables firms to identify high-growth global markets with greater confidence by combining advanced trade intelligence with a structured quantitative methodology. The framework analyzes emerging demand trends and country-level import patterns while integrating macroeconomic and trade datasets such as GDP and population forecasts, bilateral import–export flows, tariff structures, elasticity differentials between developed and developing economies, geographic distance, and import demand projections. Using weighted trade values from 2020–2024 as the base period to project country-to-country export potential for 2030, these inputs are operationalized through calculated drivers such as gravity model parameters, tariff impact factors, and projected GDP per-capita growth. Through an analysis of hidden potentials, demand hotspots, and market conditions that are most favorable to success, this method enables firms to focus on target countries, maximize returns, and global expansion with data, backed by accuracy.
By factoring in the projected importer demand gap that is currently unmet and could be potential opportunity, it identifies the potential for the Exporter (Country) among 190 countries, against the general trade analysis, which identifies the biggest importer or exporter.
To discover high-growth global markets and optimize your business strategy:
Click Here
Pricing
- Single User License$ 1,995
- Department License$ 2,400
- Site License$ 3,120
- Global License$ 3,795

Leadership Perspectives from Industry Events
Search
Thought Leadership and Analyst Meet


Our Clients
6WResearch In News
- India Air Conditioner Market Set for Strong Rebound in 2026 After Weather-Led Correction and GST-Driven Recovery: 6Wresearch
- ADAS in India: How Automatic Emergency Braking, Blind Spot Detection & Driver Monitoring are Transforming Road Safety
- Doha a strategic location for EV manufacturing hub: IPA Qatar
- Demand for luxury TVs surging in the GCC, says Samsung
- Empowering Growth: The Thriving Journey of Bangladesh’s Cable Industry
- Demand for luxury TVs surging in the GCC, says Samsung
Latest Reports
- Nicaragua RPG Gaming Market (2026-2032)
- New Zealand RPG Gaming Market (2026-2032)
- Netherlands RPG Gaming Market (2026-2032)
- Nauru RPG Gaming Market (2026-2032)
- Namibia RPG Gaming Market (2026-2032)
- Mozambique RPG Gaming Market (2026-2032)
- Montenegro RPG Gaming Market (2026-2032)
- Mongolia RPG Gaming Market (2026-2032)
- Monaco RPG Gaming Market (2026-2032)
- Micronesia RPG Gaming Market (2026-2032)
Industry Events and Analyst Meet

EV India Expo 2026

HIMTEX 2026

India Refining Summit 2026

India EV Show 2026

EV tech India Expo 2026
Whitepaper
- Middle East & Africa Commercial Security Market Click here to view more.
- Middle East & Africa Fire Safety Systems & Equipment Market Click here to view more.
- GCC Drone Market Click here to view more.
- Middle East Lighting Fixture Market Click here to view more.
- GCC Physical & Perimeter Security Market Click here to view more.