Kenya Gold Potassium Cyanide Market (2026-2032) Outlook | Trends, Industry, Value, Companies, Revenue, Share, Forecast, Size, Analysis & Growth
Market Forecast By Type (Low Purity, High Purity), By Applications (Electroplating of Metals, Decorative Costume Jewellery, Electronic Devices, Watches, Others) And Competitive Landscape
| Product Code: ETC196202 | Publication Date: May 2022 | Updated Date: Jun 2026 | Product Type: Market Research Report | |
| Publisher: 6Wresearch | Author: Shubham Deep | No. of Pages: 60 | No. of Figures: 40 | No. of Tables: 7 |
Kenya Gold Potassium Cyanide Market Size, Share & Growth Rate
The Kenya Gold Potassium Cyanide Market was estimated at USD 1172 Million in 2025 and is projected to reach USD 1698 Million by 2032, growing at a CAGR of 5.4% from 2026 to 2032. This growth trajectory is primarily fueled by the burgeoning gold mining sector in Kenya, which is recognized as one of the most significant contributors to the nation’s economy. As gold extraction methods evolve, the demand for Gold Potassium Cyanide, an essential reagent in the gold processing industry, continues to rise.
Kenya Gold Potassium Cyanide Market Year-wise Growth Rate and Key Drivers
This graph highlights how the Kenya Gold Potassium Cyanide Market has steadily grown over the years, supported by major growth factors.
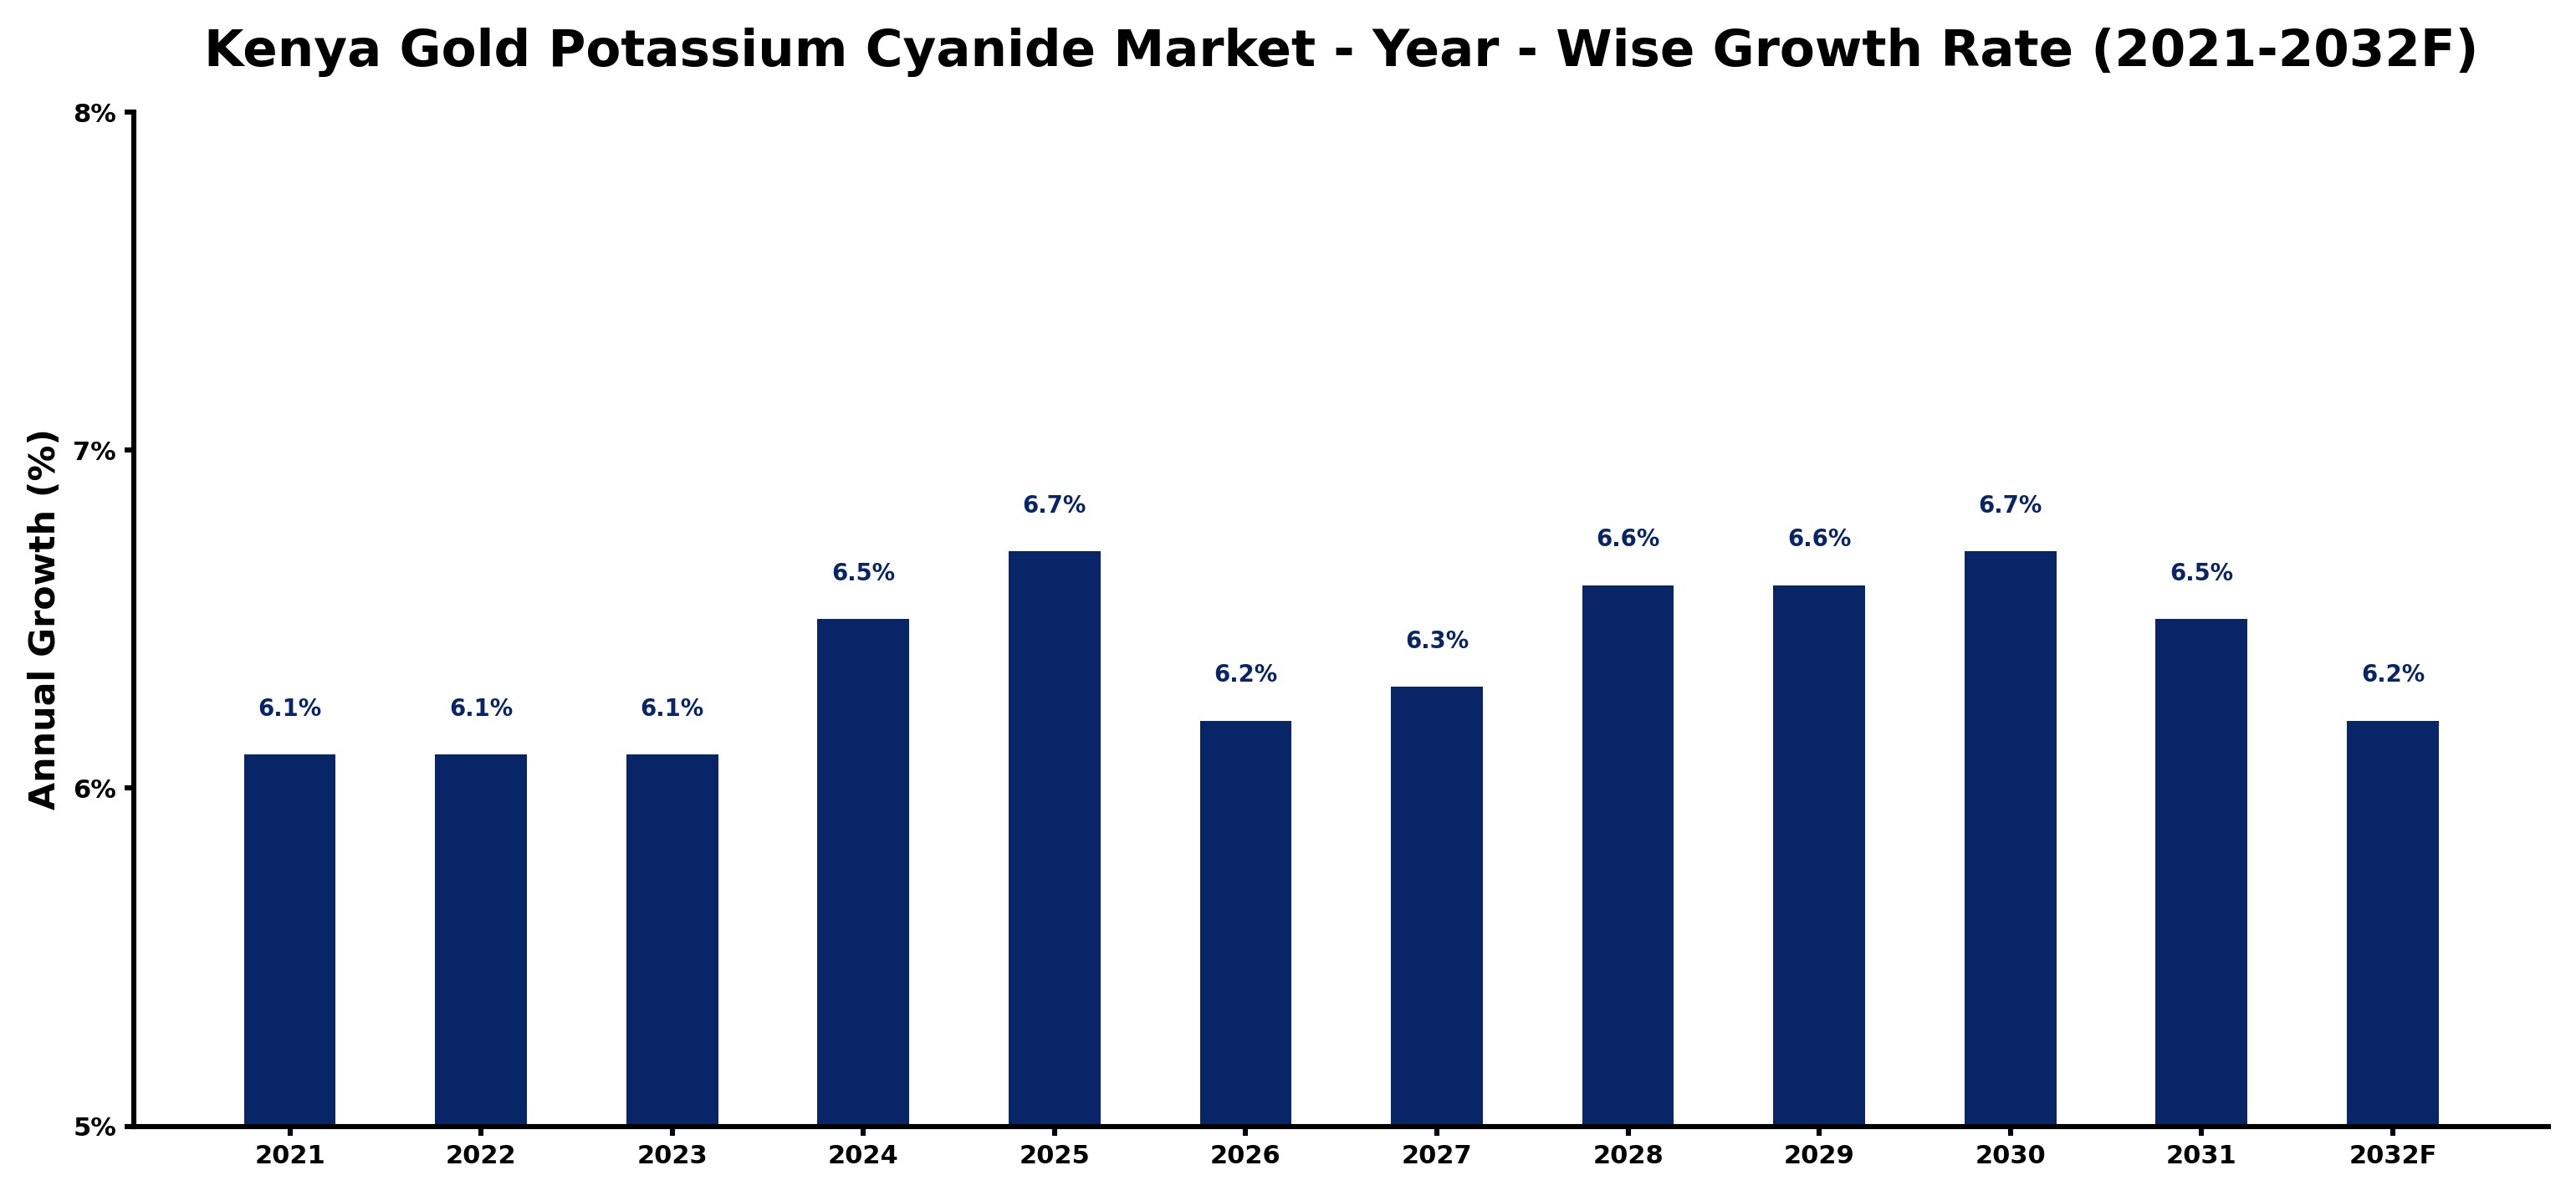
The table below presents the year‑wise growth rates along with the key drivers influencing the market
| Year | Growth Rate | Major Drivers |
| 2021 | 6.1% | Mining sector recovery stimulated demand |
| 2022 | 6.1% | Increased gold production drove usage |
| 2023 | 6.1% | Regulatory support enhanced market growth |
| 2024 | 6.5% | Technological advancements improved efficiency |
| 2025 | 6.7% | Rising gold prices attracted investments |
| 2026 | 6.2% | Sustainability initiatives gained traction |
| 2027 | 6.3% | Export opportunities expanded significantly |
| 2028 | 6.6% | Local production capabilities strengthened |
| 2029 | 6.6% | Partnerships with miners increased supply |
| 2030 | 6.7% | Market education raised awareness levels |
| 2031 | 6.5% | Infrastructure improvements facilitated distribution |
| 2032 | 6.2% | Global market trends influenced growth |
Note - Market size estimations and growth projections presented in this report are based on 6Wresearch’s advanced forecasting approach, validated with industry datasets as of June 2026.
Kenya Gold Potassium Cyanide Market Synopsis
The key force shaping the Kenya Gold Potassium Cyanide market is the expansion of the gold mining industry, which is rapidly becoming a cornerstone of Kenya's economic framework. Increased exploration and investment in mining activities have heightened the demand for Gold Potassium Cyanide, enhancing its role in efficient gold recovery processes.
Additionally, the growing awareness among stakeholders regarding the efficacy of Gold Potassium Cyanide as a critical component for higher yield in gold extraction has spurred significant interest. The market's dynamics are further influenced by regulatory frameworks that promote sustainable practices in mining.
Kenya Gold Potassium Cyanide Market Key Takeaways
- The market is driven by the robust expansion of the gold mining sector in Kenya.
- Investment in mining technology and sustainable practices is increasing.
- Government policies are focused on ensuring environmental compliance.
- Fluctuating global gold prices can influence demand for potassium cyanide.
- The market is adapting to stringent safety and regulatory requirements.
Evaluation of Restraints in Kenya Gold Potassium Cyanide Market
The Kenya Gold Potassium Cyanide market is navigating several restraints that could temper its potential growth. Regulatory restrictions surrounding the use and handling of potassium cyanide stem from its toxic nature, resulting in heightened scrutiny of mining operations. Additionally, environmental concerns regarding the disposal of cyanide pose significant challenges. Companies must adhere to stringent safety measures, which may increase operational costs. Moreover, the volatility of global gold prices can lead to fluctuations in demand, complicating the market's overall landscape.
Kenya Gold Potassium Cyanide Market Trends
Current trends within the Kenya Gold Potassium Cyanide market reflect a shift towards more sustainable mining practices. Increasing investment in advanced extraction technologies is driving demand for Gold Potassium Cyanide, as miners seek higher efficiency and lower environmental impact. Furthermore, there’s a growing recognition of the need for eco-friendly alternatives in mining, leading to innovations in cyanide management and usage.
Kenya Gold Potassium Cyanide Market Opportunities
The Kenya Gold Potassium Cyanide market presents various investment opportunities, particularly as the local gold mining industry continues to flourish. Potential areas for growth include establishing local production facilities to reduce dependency on imports, as well as supplying Gold Potassium Cyanide to emerging mining projects. Furthermore, investments in R&D could enhance the safety and efficiency of cyanide production, creating long-term benefits and competitive advantages.
Government Initiatives in the Kenya Gold Potassium Cyanide Market
In Kenya, the Gold Potassium Cyanide market operates under the Mining Act of 2016, which outlines stringent regulations for the extraction and processing of minerals, including gold. The government is actively promoting responsible mining practices through environmental safeguards and community engagement initiatives. Fiscal measures, including taxes and royalties imposed by the Kenya Revenue Authority, further underpin the government's commitment to sustainable growth in the mining sector.
Future Insights of the Kenya Gold Potassium Cyanide Market
Looking ahead to the period from 2026 to 2032, the Kenya Gold Potassium Cyanide market is set to experience robust growth driven by rising global gold demand. Industries such as jewelry and electronics will continue to fuel this need. As mining technologies advance and awareness of safe practices increases, the market is likely to see a more substantial integration of Gold Potassium Cyanide in gold processing, fostering an environment conducive to innovation and efficiency.
Kenya Gold Potassium Cyanide Market Latest Developments (May 2025 - June 2026)
Recent developments in the Kenya Gold Potassium Cyanide market indicate a growing commitment to sustainable mining practices. Companies are increasingly investing in technologies that minimize environmental impact while enhancing extraction efficiency. Additionally, there are ongoing discussions among stakeholders to refine regulatory frameworks governing cyanide use, aimed at improving safety protocols within the mining sector.
Kenya Gold Potassium Cyanide Market - Key Attractiveness of the Report
- 10 Years of Market Numbers
- Historical Data Starting from 2022 to 2025
- Base Year: 2025
- Forecast Data until 2032
- Key Performance Indicators Impacting the Market
- Major Upcoming Developments and Projects
Key Highlights of the Report:
- Kenya Gold Potassium Cyanide Market Outlook
- Market Size of Kenya Gold Potassium Cyanide Market, 2025
- Forecast of Kenya Gold Potassium Cyanide Market, 2032
- Historical Data and Forecast of Kenya Gold Potassium Cyanide Revenues & Volume for the Period 2022-2032F
- Kenya Gold Potassium Cyanide Market Trend Evolution
- Kenya Gold Potassium Cyanide Market Drivers and Challenges
- Kenya Gold Potassium Cyanide Price Trends
- Kenya Gold Potassium Cyanide Porter's Five Forces
- Kenya Gold Potassium Cyanide Industry Life Cycle
- Historical Data and Forecast of Kenya Gold Potassium Cyanide Market Revenues & Volume By Type for the Period 2022-2032F
- Historical Data and Forecast of Kenya Gold Potassium Cyanide Market Revenues & Volume By Low Purity for the Period 2022-2032F
- Historical Data and Forecast of Kenya Gold Potassium Cyanide Market Revenues & Volume By High Purity for the Period 2022-2032F
- Historical Data and Forecast of Kenya Gold Potassium Cyanide Market Revenues & Volume By Applications for the Period 2022-2032F
- Historical Data and Forecast of Kenya Gold Potassium Cyanide Market Revenues & Volume By Electroplating of Metals for the Period 2022-2032F
- Historical Data and Forecast of Kenya Gold Potassium Cyanide Market Revenues & Volume By Decorative Costume Jewellery for the Period 2022-2032F
- Historical Data and Forecast of Kenya Gold Potassium Cyanide Market Revenues & Volume By Electronic Devices for the Period 2022-2032F
- Historical Data and Forecast of Kenya Gold Potassium Cyanide Market Revenues & Volume By Watches for the Period 2022-2032F
- Historical Data and Forecast of Kenya Gold Potassium Cyanide Market Revenues & Volume By Others for the Period 2022-2032F
- Kenya Gold Potassium Cyanide Import Export Trade Statistics
- Market Opportunity Assessment By Type
- Market Opportunity Assessment By Applications
- Kenya Gold Potassium Cyanide Top Companies Market Share
- Kenya Gold Potassium Cyanide Competitive Benchmarking By Technical and Operational Parameters
- Kenya Gold Potassium Cyanide Company Profiles
- Kenya Gold Potassium Cyanide Key Strategic Recommendations
Kenya Gold Potassium Cyanide Market - Frequently Asked Questions
The growth of the market is primarily driven by the expansion of the gold mining industry in Kenya, coupled with increasing investments in mining projects and technology. Awareness about the effectiveness of Gold Potassium Cyanide for gold extraction is also a significant factor.
The market was estimated at USD 1172 Million in 2025 and is expected to reach USD 1698 Million by 2032, with a CAGR of 5.4% from 2026 to 2032.
Government policies, particularly the Mining Act of 2016, establish guidelines for safe and responsible mining practices. These regulations are crucial for ensuring that the environmental and safety standards are upheld in the use of potassium cyanide.
The market faces challenges, including regulatory restrictions on potassium cyanide's use, environmental concerns related to disposal, and the necessity for strict safety measures throughout the supply chain.
The market is increasingly adopting sustainable mining practices by investing in technologies that improve extraction efficiency while minimizing environmental impact, reflecting a shift towards eco-friendly solutions.
6Wresearch actively monitors the Kenya Gold Potassium Cyanide Market and publishes its comprehensive annual report, highlighting emerging trends, growth drivers, revenue analysis, and forecast outlook. Our insights help businesses to make data-backed strategic decisions with ongoing market dynamics. Our analysts track relevent industries related to the Kenya Gold Potassium Cyanide Market, allowing our clients with actionable intelligence and reliable forecasts tailored to emerging regional needs.
Yes, we provide customisation as per your requirements. To learn more, feel free to contact us on sales@6wresearch.com
1 Executive Summary |
2 Introduction |
2.1 Key Highlights of the Report |
2.2 Report Description |
2.3 Market Scope & Segmentation |
2.4 Research Methodology |
2.5 Assumptions |
3 Kenya Gold Potassium Cyanide Market Overview |
3.1 Kenya Country Macro Economic Indicators |
3.2 Kenya Gold Potassium Cyanide Market Revenues & Volume, 2022 & 2032F |
3.3 Kenya Gold Potassium Cyanide Market - Industry Life Cycle |
3.4 Kenya Gold Potassium Cyanide Market - Porter's Five Forces |
3.5 Kenya Gold Potassium Cyanide Market Revenues & Volume Share, By Type, 2022 & 2032F |
3.6 Kenya Gold Potassium Cyanide Market Revenues & Volume Share, By Applications, 2022 & 2032F |
4 Kenya Gold Potassium Cyanide Market Dynamics |
4.1 Impact Analysis |
4.2 Market Drivers |
4.2.1 Increasing demand for gold potassium cyanide in the jewelry industry |
4.2.2 Growth in the mining sector in Kenya |
4.2.3 Rising investments in the chemical industry |
4.3 Market Restraints |
4.3.1 Stringent regulations regarding the use of cyanide compounds |
4.3.2 Volatility in gold prices affecting demand for gold potassium cyanide |
5 Kenya Gold Potassium Cyanide Market Trends |
6 Kenya Gold Potassium Cyanide Market, By Types |
6.1 Kenya Gold Potassium Cyanide Market, By Type |
6.1.1 Overview and Analysis |
6.1.2 Kenya Gold Potassium Cyanide Market Revenues & Volume, By Type, 2022-2032F |
6.1.3 Kenya Gold Potassium Cyanide Market Revenues & Volume, By Low Purity, 2022-2032F |
6.1.4 Kenya Gold Potassium Cyanide Market Revenues & Volume, By High Purity, 2022-2032F |
6.2 Kenya Gold Potassium Cyanide Market, By Applications |
6.2.1 Overview and Analysis |
6.2.2 Kenya Gold Potassium Cyanide Market Revenues & Volume, By Electroplating of Metals, 2022-2032F |
6.2.3 Kenya Gold Potassium Cyanide Market Revenues & Volume, By Decorative Costume Jewellery, 2022-2032F |
6.2.4 Kenya Gold Potassium Cyanide Market Revenues & Volume, By Electronic Devices, 2022-2032F |
6.2.5 Kenya Gold Potassium Cyanide Market Revenues & Volume, By Watches, 2022-2032F |
6.2.6 Kenya Gold Potassium Cyanide Market Revenues & Volume, By Others, 2022-2032F |
7 Kenya Gold Potassium Cyanide Market Import-Export Trade Statistics |
7.1 Kenya Gold Potassium Cyanide Market Export to Major Countries |
7.2 Kenya Gold Potassium Cyanide Market Imports from Major Countries |
8 Kenya Gold Potassium Cyanide Market Key Performance Indicators |
8.1 Number of new mining projects in Kenya |
8.2 Export volume of gold potassium cyanide from Kenya |
8.3 Adoption rate of eco-friendly cyanide alternatives in the market |
9 Kenya Gold Potassium Cyanide Market - Opportunity Assessment |
9.1 Kenya Gold Potassium Cyanide Market Opportunity Assessment, By Type, 2022 & 2032F |
9.2 Kenya Gold Potassium Cyanide Market Opportunity Assessment, By Applications, 2022 & 2032F |
10 Kenya Gold Potassium Cyanide Market - Competitive Landscape |
10.1 Kenya Gold Potassium Cyanide Market Revenue Share, By Companies, 2025 |
10.2 Kenya Gold Potassium Cyanide Market Competitive Benchmarking, By Operating and Technical Parameters |
11 Company Profiles |
12 Recommendations |
13 Disclaimer |
Global Go To Market Strategy - 2030
Export potential enables firms to identify high-growth global markets with greater confidence by combining advanced trade intelligence with a structured quantitative methodology. The framework analyzes emerging demand trends and country-level import patterns while integrating macroeconomic and trade datasets such as GDP and population forecasts, bilateral import–export flows, tariff structures, elasticity differentials between developed and developing economies, geographic distance, and import demand projections. Using weighted trade values from 2020–2024 as the base period to project country-to-country export potential for 2030, these inputs are operationalized through calculated drivers such as gravity model parameters, tariff impact factors, and projected GDP per-capita growth. Through an analysis of hidden potentials, demand hotspots, and market conditions that are most favorable to success, this method enables firms to focus on target countries, maximize returns, and global expansion with data, backed by accuracy.
By factoring in the projected importer demand gap that is currently unmet and could be potential opportunity, it identifies the potential for the Exporter (Country) among 190 countries, against the general trade analysis, which identifies the biggest importer or exporter.
To discover high-growth global markets and optimize your business strategy:
Click Here
Pricing
- Single User License$ 1,995
- Department License$ 2,400
- Site License$ 3,120
- Global License$ 3,795

Leadership Perspectives from Industry Events
Search
Thought Leadership and Analyst Meet


Our Clients
6WResearch In News
- India Air Conditioner Market Set for Strong Rebound in 2026 After Weather-Led Correction and GST-Driven Recovery: 6Wresearch
- ADAS in India: How Automatic Emergency Braking, Blind Spot Detection & Driver Monitoring are Transforming Road Safety
- Doha a strategic location for EV manufacturing hub: IPA Qatar
- Demand for luxury TVs surging in the GCC, says Samsung
- Empowering Growth: The Thriving Journey of Bangladesh’s Cable Industry
- Demand for luxury TVs surging in the GCC, says Samsung
Latest Reports
- Nicaragua RPG Gaming Market (2026-2032)
- New Zealand RPG Gaming Market (2026-2032)
- Netherlands RPG Gaming Market (2026-2032)
- Nauru RPG Gaming Market (2026-2032)
- Namibia RPG Gaming Market (2026-2032)
- Mozambique RPG Gaming Market (2026-2032)
- Montenegro RPG Gaming Market (2026-2032)
- Mongolia RPG Gaming Market (2026-2032)
- Monaco RPG Gaming Market (2026-2032)
- Micronesia RPG Gaming Market (2026-2032)
Industry Events and Analyst Meet

EV India Expo 2026

HIMTEX 2026

India Refining Summit 2026

India EV Show 2026

EV tech India Expo 2026
Whitepaper
- Middle East & Africa Commercial Security Market Click here to view more.
- Middle East & Africa Fire Safety Systems & Equipment Market Click here to view more.
- GCC Drone Market Click here to view more.
- Middle East Lighting Fixture Market Click here to view more.
- GCC Physical & Perimeter Security Market Click here to view more.