Kenya Hollow Glassware Market (2026-2032) | Trends, Size, Revenue, Analysis, Growth, Companies, Forecast, Industry, Outlook, Share & Value
Market Forecast By Type (Medium Borosilicate, High Borosilicate), By Application (Solar Energy Tubes, Laboratory Apparatus, Heat Glassware, Chemical Tubes, Pharmaceutical Packaging, Others) And Competitive Landscape
| Product Code: ETC043050 | Publication Date: Jan 2021 | Updated Date: Jun 2026 | Product Type: Report | |
| Publisher: 6Wresearch | Author: Ravi Bhandari | No. of Pages: 70 | No. of Figures: 35 | No. of Tables: 5 |
Kenya Hollow Glassware Market Summary
The kenya hollow glassware market was estimated at USD 253 Million in 2025 and is projected to reach USD 343 Million by 2032, growing at a CAGR of 5.1% from 2026 to 2032.
Kenya Hollow Glassware Market Growth Rate Analysis (2021-2032)
The Kenyan hollow glassware market has exhibited steady growth, with annual increases ranging from 5.1% to 5.4% from 2021 through 2032. In 2022, a sharp rise to 5.3% highlighted burgeoning consumer demand supported by a growing middle class and increased spending on home décor. The growth momentum continued into 2024 with a 5.4% increase, driven by investments in local manufacturing and improvements in distribution infrastructure. However, slight fluctuations, such as the 5.0% growth forecasted for 2029, may arise from external economic factors and changing consumer preferences. Overall, the market's stability reflects Kenya's commitment to enhancing manufacturing capabilities and adapting to evolving trends in sustainability and design.
Kenya Hollow Glassware Market Year-wise Growth Rate and Key Drivers
This graph highlights how the Kenya Hollow Glassware Market has steadily grown over the past five years, supported by major growth factors.
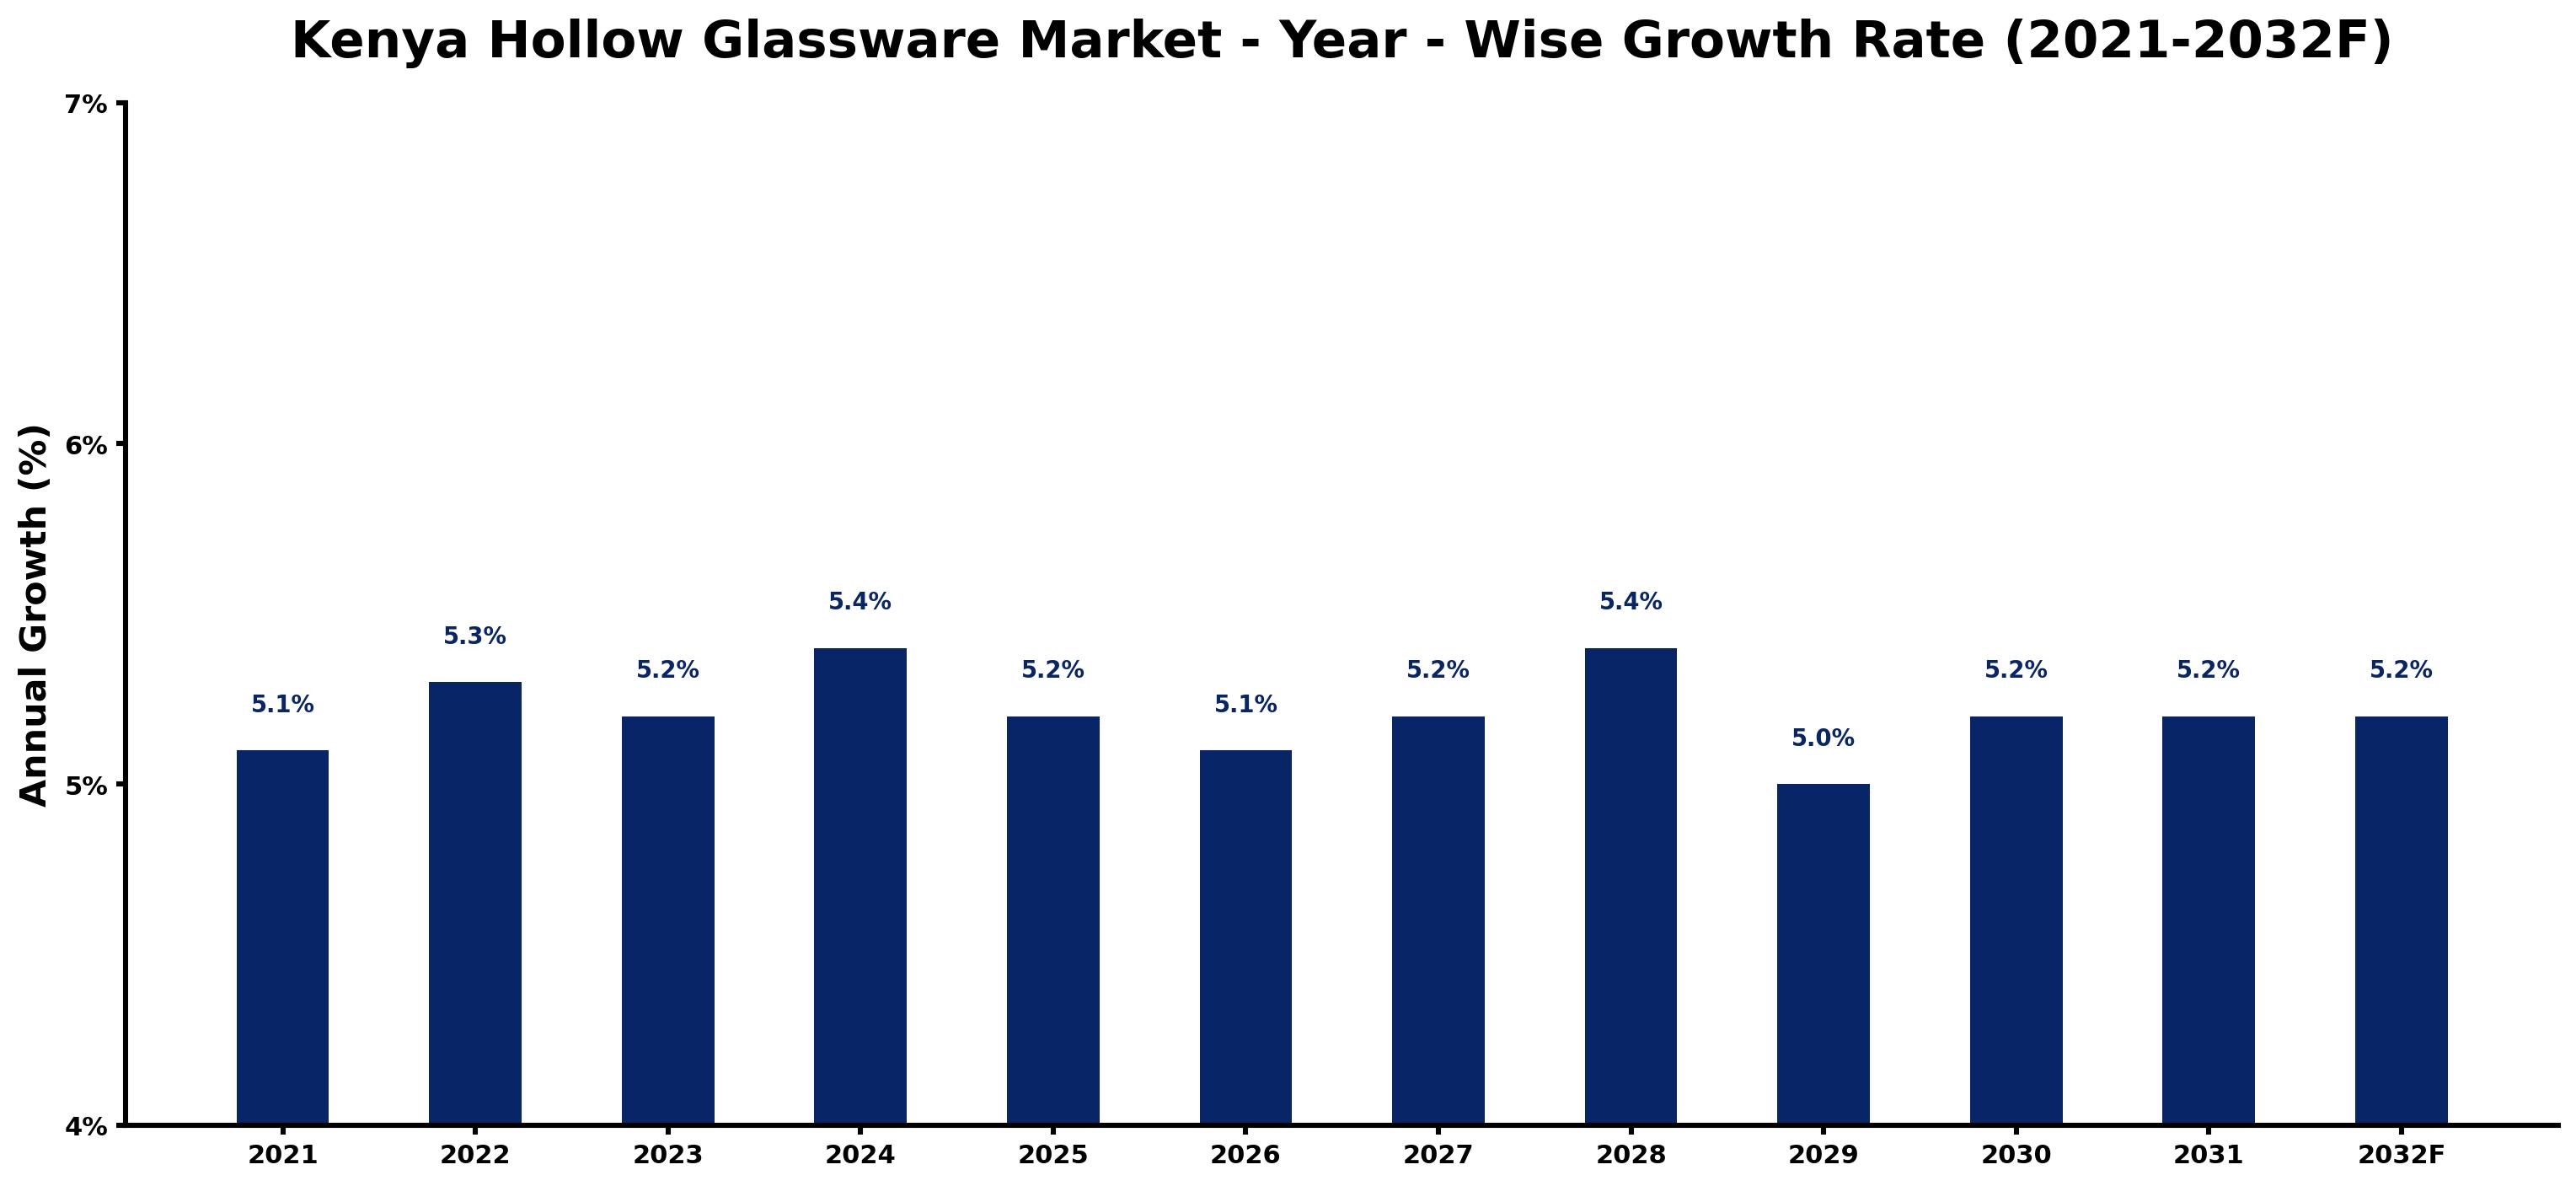
The table below presents the year wise growth rates along with the key drivers influencing the market
| Year | Growth Rate | Major Drivers |
| 2021 | 5.1% | The pandemic shifted consumer focus toward home entertainment and dining experiences. |
| 2022 | 5.3% | Local artisans began offering more unique, handcrafted glassware options to consumers. |
| 2023 | 5.2% | Expanding urbanization trends fueled demand for stylish and functional home décor items. |
| 2024 | 5.4% | Increasing disposable incomes saw consumers investing in premium glassware brands. |
| 2025 | 5.2% | E-commerce platforms provided greater access to diverse glassware collections nationwide. |
| 2026 | 5.1% | Social media influencers began showcasing glassware in lifestyle and dining content. |
| 2027 | 5.2% | Sustainability became a priority, with eco-friendly glassware gaining popularity among consumers. |
| 2028 | 5.4% | The hospitality sector's recovery boosted demand for bulk glassware purchases. |
| 2029 | 5.0% | Cultural events and celebrations drove increased sales during peak seasonal periods. |
| 2030 | 5.2% | Brands started collaborating with local artists to enhance product designs and appeal. |
| 2031 | 5.2% | Innovative glass manufacturing techniques improved product quality and durability significantly. |
| 2032 | 5.2% | Consumer preferences shifted towards multifunctional glassware catering to various occasions. |
Note - Market size estimations and growth projections presented in this report are based on 6Wresearch's advanced forecasting approach, validated with industry datasets as of June 2026.
Kenya Hollow Glassware Market Synopsis
The Kenya Hollow Glassware Market is projected to reach 5.1% and witness significant growth during the forecast period (2026-2032). Driven by an increasing demand for aesthetically appealing and functional glass products in various sectors, the market is experiencing a transformation fueled by evolving consumer preferences and rising disposable incomes. The hollow glassware segment, renowned for its lightweight construction and intricate designs, is making significant inroads into households as well as the hospitality industry.
Kenya Hollow Glassware Market Growth Drivers
The expansion of the Kenya Hollow Glassware Market can be attributed to several key drivers that are reshaping consumer consumption patterns:
- The hospitality sector's growth has led to an increased demand for decorative and functional hollow glass products, which are utilized in dining and event settings.
- Consumer preferences are shifting towards unique and visually appealing glassware, enhancing its desirability in both retail and home décor markets.
- Experience-driven dining trends are encouraging establishments to invest in visually attractive glassware to enhance the customer experience.
- The rise in disposable income among Kenyan consumers allows for greater expenditure on premium household items, including specialized glassware.
- Social gatherings and events are becoming more frequent, further driving demand for intricate glass pieces that can double as both decorative items and functional serving ware.
Kenya Hollow Glassware Market Challenges and Restraints
Despite its potential, the Kenya Hollow Glassware Market faces several challenges that may inhibit growth:
- The integrity of hollow glassware during manufacturing and transport is a critical concern; ensuring quality is necessary to prevent breakage and defects.
- Compliance with local safety standards is mandatory, and manufacturers must navigate these regulations to ensure consumer safety and product acceptance.
- Consumer trends are continuously evolving, requiring manufacturers to be agile and responsive to changes in preferences, which can complicate production planning.
- Environmental sustainability is becoming increasingly important, pushing manufacturers to develop eco-friendly products and packaging solutions.
- The market is subject to fluctuations in raw material prices, affecting production costs and ultimately impacting pricing strategies.
Kenya Hollow Glassware Market Trends and Opportunities
Emerging trends in the Kenya Hollow Glassware Market present opportunities for innovation and growth:
- There is a growing trend towards customized and artisanal glassware, appealing to consumers seeking unique products that reflect personal tastes.
- Innovations in glass manufacturing processes and materials are paving the way for new product lines that are lighter, more durable, and energy-efficient.
- The rise of e-commerce is providing an effective platform for glassware retailers to reach broader consumer bases, enhancing accessibility and visibility.
- Collaborations with local artisans can enhance product offerings and create a narrative around the local craftsmanship of hollow glassware.
- Increased interest in hosting and entertaining at home can stimulate demand for high-quality glassware that elevates the dining experience.
Kenya Hollow Glassware Market Government Investment and Initiatives
The Kenyan government's policies significantly impact the hollow glassware market, particularly in relation to food safety and environmental regulations:
- Government initiatives aimed at promoting food safety standards are pushing manufacturers to ensure that their products meet stringent safety guidelines.
- Policies encouraging sustainable practices in manufacturing are prompting glassware producers to adopt environmentally friendly production methods.
- Investment in local manufacturing capabilities is a focus, as the government seeks to boost local industries and reduce reliance on imports.
- Recycling initiatives supported by the government can enhance the circular economy of glass products, promoting sustainability in glassware disposal and reuse.
- Public spending on infrastructure development is expected to improve distribution channels for glassware, facilitating greater market reach for manufacturers.
Kenya Hollow Glassware Market Latest Developments (May 2025 - June 2026)
Recent developments in the Kenya Hollow Glassware Market indicate a robust evolution of the industry:
- Manufacturers are increasingly investing in automation and advanced technologies to enhance production efficiency and reduce operational costs.
- Trade shows and exhibitions have provided platforms for stakeholders to showcase innovative hollow glassware designs and foster business relationships.
- Several local artisans have begun to collaborate with manufacturers, resulting in exclusive product launches that celebrate Kenyan craftsmanship.
- Consumers are becoming more environmentally conscious, leading to an uptick in demand for eco-friendly glass products, prompting companies to adapt their strategies accordingly.
- Emerging trends in home dining and aesthetic decor continue to bolster the market, as more consumers seek products that serve both functional and decorative purposes.
Kenya Hollow Glassware Market - Key Attractiveness of the Report
- 10 Years of Market Numbers
- Historical Data Starting from 2022 to 2025
- Base Year: 2025
- Forecast Data until 2032
- Key Performance Indicators Impacting the Market
- Major Upcoming Developments and Projects
Key Highlights of the Report:
- Kenya Hollow Glassware Market Outlook
- Market Size of Kenya Hollow Glassware Market, 2025
- Forecast of Kenya Hollow Glassware Market, 2032
- Historical Data and Forecast of Kenya Hollow Glassware Revenues & Volume for the Period 2022-2032F
- Kenya Hollow Glassware Market Trend Evolution
- Kenya Hollow Glassware Market Drivers and Challenges
- Kenya Hollow Glassware Price Trends
- Kenya Hollow Glassware Porter's Five Forces
- Kenya Hollow Glassware Industry Life Cycle
- Historical Data and Forecast of Kenya Hollow Glassware Market Revenues & Volume By Type for the Period 2022-2032F
- Historical Data and Forecast of Kenya Hollow Glassware Market Revenues & Volume By Medium Borosilicate for the Period 2022-2032F
- Historical Data and Forecast of Kenya Hollow Glassware Market Revenues & Volume By High Borosilicate for the Period 2022-2032F
- Historical Data and Forecast of Kenya Hollow Glassware Market Revenues & Volume By Application for the Period 2022-2032F
- Historical Data and Forecast of Kenya Hollow Glassware Market Revenues & Volume By Solar Energy Tubes for the Period 2022-2032F
- Historical Data and Forecast of Kenya Hollow Glassware Market Revenues & Volume By Laboratory Apparatus for the Period 2022-2032F
- Historical Data and Forecast of Kenya Hollow Glassware Market Revenues & Volume By Heat Glassware for the Period 2022-2032F
- Historical Data and Forecast of Kenya Hollow Glassware Market Revenues & Volume By Chemical Tubes for the Period 2022-2032F
- Historical Data and Forecast of Kenya Hollow Glassware Market Revenues & Volume By Pharmaceutical Packaging for the Period 2022-2032F
- Historical Data and Forecast of Kenya Hollow Glassware Market Revenues & Volume By Others for the Period 2022-2032F
- Kenya Hollow Glassware Import Export Trade Statistics
- Market Opportunity Assessment By Type
- Market Opportunity Assessment By Application
- Kenya Hollow Glassware Top Companies Market Share
- Kenya Hollow Glassware Competitive Benchmarking By Technical and Operational Parameters
- Kenya Hollow Glassware Company Profiles
- Kenya Hollow Glassware Key Strategic Recommendations
Frequently Asked Questions About the Market Study (FAQs):
The market growth is driven by rising disposable incomes, increasing demand in the hospitality sector, and changing consumer preferences towards aesthetically appealing products.
Key challenges include maintaining product quality, complying with safety standards, and addressing the need for sustainable practices in manufacturing.
Government policies promote food safety and sustainable practices, influencing manufacturing processes and market dynamics.
Emerging trends include customization, eco-friendly products, and the impact of e-commerce on market accessibility.
6Wresearch actively monitors the Kenya Hollow Glassware Market and publishes its comprehensive annual report, highlighting emerging trends, growth drivers, revenue analysis, and forecast outlook. Our insights help businesses to make data-backed strategic decisions with ongoing market dynamics. Our analysts track relevent industries related to the Kenya Hollow Glassware Market, allowing our clients with actionable intelligence and reliable forecasts tailored to emerging regional needs.
Yes, we provide customisation as per your requirements. To learn more, feel free to contact us on sales@6wresearch.com
1 Executive Summary |
2 Introduction |
2.1 Key Highlights of the Report |
2.2 Report Description |
2.3 Market Scope & Segmentation |
2.4 Research Methodology |
2.5 Assumptions |
3 Kenya Hollow Glassware Market Overview |
3.1 Kenya Country Macro Economic Indicators |
3.2 Kenya Hollow Glassware Market Revenues & Volume, 2022 & 2032F |
3.3 Kenya Hollow Glassware Market - Industry Life Cycle |
3.4 Kenya Hollow Glassware Market - Porter's Five Forces |
3.5 Kenya Hollow Glassware Market Revenues & Volume Share, By Type, 2022 & 2032F |
3.6 Kenya Hollow Glassware Market Revenues & Volume Share, By Application, 2022 & 2032F |
4 Kenya Hollow Glassware Market Dynamics |
4.1 Impact Analysis |
4.2 Market Drivers |
4.3 Market Restraints |
5 Kenya Hollow Glassware Market Trends |
6 Kenya Hollow Glassware Market, By Types |
6.1 Kenya Hollow Glassware Market, By Type |
6.1.1 Overview and Analysis |
6.1.2 Kenya Hollow Glassware Market Revenues & Volume, By Type, 2022-2032F |
6.1.3 Kenya Hollow Glassware Market Revenues & Volume, By Medium Borosilicate, 2022-2032F |
6.1.4 Kenya Hollow Glassware Market Revenues & Volume, By High Borosilicate, 2022-2032F |
6.2 Kenya Hollow Glassware Market, By Application |
6.2.1 Overview and Analysis |
6.2.2 Kenya Hollow Glassware Market Revenues & Volume, By Solar Energy Tubes, 2022-2032F |
6.2.3 Kenya Hollow Glassware Market Revenues & Volume, By Laboratory Apparatus, 2022-2032F |
6.2.4 Kenya Hollow Glassware Market Revenues & Volume, By Heat Glassware, 2022-2032F |
6.2.5 Kenya Hollow Glassware Market Revenues & Volume, By Chemical Tubes, 2022-2032F |
6.2.6 Kenya Hollow Glassware Market Revenues & Volume, By Pharmaceutical Packaging, 2022-2032F |
6.2.7 Kenya Hollow Glassware Market Revenues & Volume, By Others, 2022-2032F |
7 Kenya Hollow Glassware Market Import-Export Trade Statistics |
7.1 Kenya Hollow Glassware Market Export to Major Countries |
7.2 Kenya Hollow Glassware Market Imports from Major Countries |
8 Kenya Hollow Glassware Market Key Performance Indicators |
9 Kenya Hollow Glassware Market - Opportunity Assessment |
9.1 Kenya Hollow Glassware Market Opportunity Assessment, By Type, 2022 & 2032F |
9.2 Kenya Hollow Glassware Market Opportunity Assessment, By Application, 2022 & 2032F |
10 Kenya Hollow Glassware Market - Competitive Landscape |
10.1 Kenya Hollow Glassware Market Revenue Share, By Companies, 2025 |
10.2 Kenya Hollow Glassware Market Competitive Benchmarking, By Operating and Technical Parameters |
11 Company Profiles |
12 Recommendations |
13 Disclaimer |
Global Go To Market Strategy - 2030
Export potential enables firms to identify high-growth global markets with greater confidence by combining advanced trade intelligence with a structured quantitative methodology. The framework analyzes emerging demand trends and country-level import patterns while integrating macroeconomic and trade datasets such as GDP and population forecasts, bilateral import–export flows, tariff structures, elasticity differentials between developed and developing economies, geographic distance, and import demand projections. Using weighted trade values from 2020–2024 as the base period to project country-to-country export potential for 2030, these inputs are operationalized through calculated drivers such as gravity model parameters, tariff impact factors, and projected GDP per-capita growth. Through an analysis of hidden potentials, demand hotspots, and market conditions that are most favorable to success, this method enables firms to focus on target countries, maximize returns, and global expansion with data, backed by accuracy.
By factoring in the projected importer demand gap that is currently unmet and could be potential opportunity, it identifies the potential for the Exporter (Country) among 190 countries, against the general trade analysis, which identifies the biggest importer or exporter.
To discover high-growth global markets and optimize your business strategy:
Click Here
Pricing
- Single User License$ 1,995
- Department License$ 2,400
- Site License$ 3,120
- Global License$ 3,795

Leadership Perspectives from Industry Events
Search
Thought Leadership and Analyst Meet


Our Clients
6WResearch In News
- India Air Conditioner Market Set for Strong Rebound in 2026 After Weather-Led Correction and GST-Driven Recovery: 6Wresearch
- ADAS in India: How Automatic Emergency Braking, Blind Spot Detection & Driver Monitoring are Transforming Road Safety
- Doha a strategic location for EV manufacturing hub: IPA Qatar
- Demand for luxury TVs surging in the GCC, says Samsung
- Empowering Growth: The Thriving Journey of Bangladesh’s Cable Industry
- Demand for luxury TVs surging in the GCC, says Samsung
Latest Reports
- Nicaragua RPG Gaming Market (2026-2032)
- New Zealand RPG Gaming Market (2026-2032)
- Netherlands RPG Gaming Market (2026-2032)
- Nauru RPG Gaming Market (2026-2032)
- Namibia RPG Gaming Market (2026-2032)
- Mozambique RPG Gaming Market (2026-2032)
- Montenegro RPG Gaming Market (2026-2032)
- Mongolia RPG Gaming Market (2026-2032)
- Monaco RPG Gaming Market (2026-2032)
- Micronesia RPG Gaming Market (2026-2032)
Industry Events and Analyst Meet

HIMTEX 2026

India Refining Summit 2026

India EV Show 2026

EV tech India Expo 2026

Auto Tech Asia 2026
Whitepaper
- Middle East & Africa Commercial Security Market Click here to view more.
- Middle East & Africa Fire Safety Systems & Equipment Market Click here to view more.
- GCC Drone Market Click here to view more.
- Middle East Lighting Fixture Market Click here to view more.
- GCC Physical & Perimeter Security Market Click here to view more.