Kenya Insulated Glass Market (2026-2032) Outlook | Growth, Value, Analysis, Forecast, Share, Revenue, Industry, Companies, Trends, Size
Market Forecast By Type (Heated Insulating Glass, Tempering Insulating Glass, Custom Insulated Glass, Other Glasses), By Application (Doors & Partitions, Kitchen Appliances & Cabinets, Floors & Ceilings, Furniture & Curtain Walls, Railings & Bolted Structures, Automotive Glasses), By End User (Residential Buildings, Commercial & Institutional Buildings, Industrial Users) And Competitive Landscape
| Product Code: ETC423946 | Publication Date: Oct 2022 | Updated Date: Jul 2026 | Product Type: Market Research Report | |
| Publisher: 6Wresearch | Author: Summon Dutta | No. of Pages: 75 | No. of Figures: 35 | No. of Tables: 20 |
Kenya Insulated Glass Market Size, Share & Growth Rate
The Kenya Insulated Glass Market was estimated at USD 257 Million in 2025 and is projected to reach USD 353 Million by 2032, growing at a CAGR of 4.6% from 2026 to 2032. This growth trajectory is primarily fueled by the burgeoning construction sector in urban hubs, where energy efficiency and sustainability are no longer optional but essential components of building design. As developers increasingly seek to enhance thermal insulation and soundproofing in their projects, the demand for insulated glass solutions is steadily climbing.
Kenya Insulated Glass Market Year-wise Growth Rate and Key Drivers
This graph highlights how the Kenya Insulated Glass Market has steadily grown over the years, supported by major growth factors.
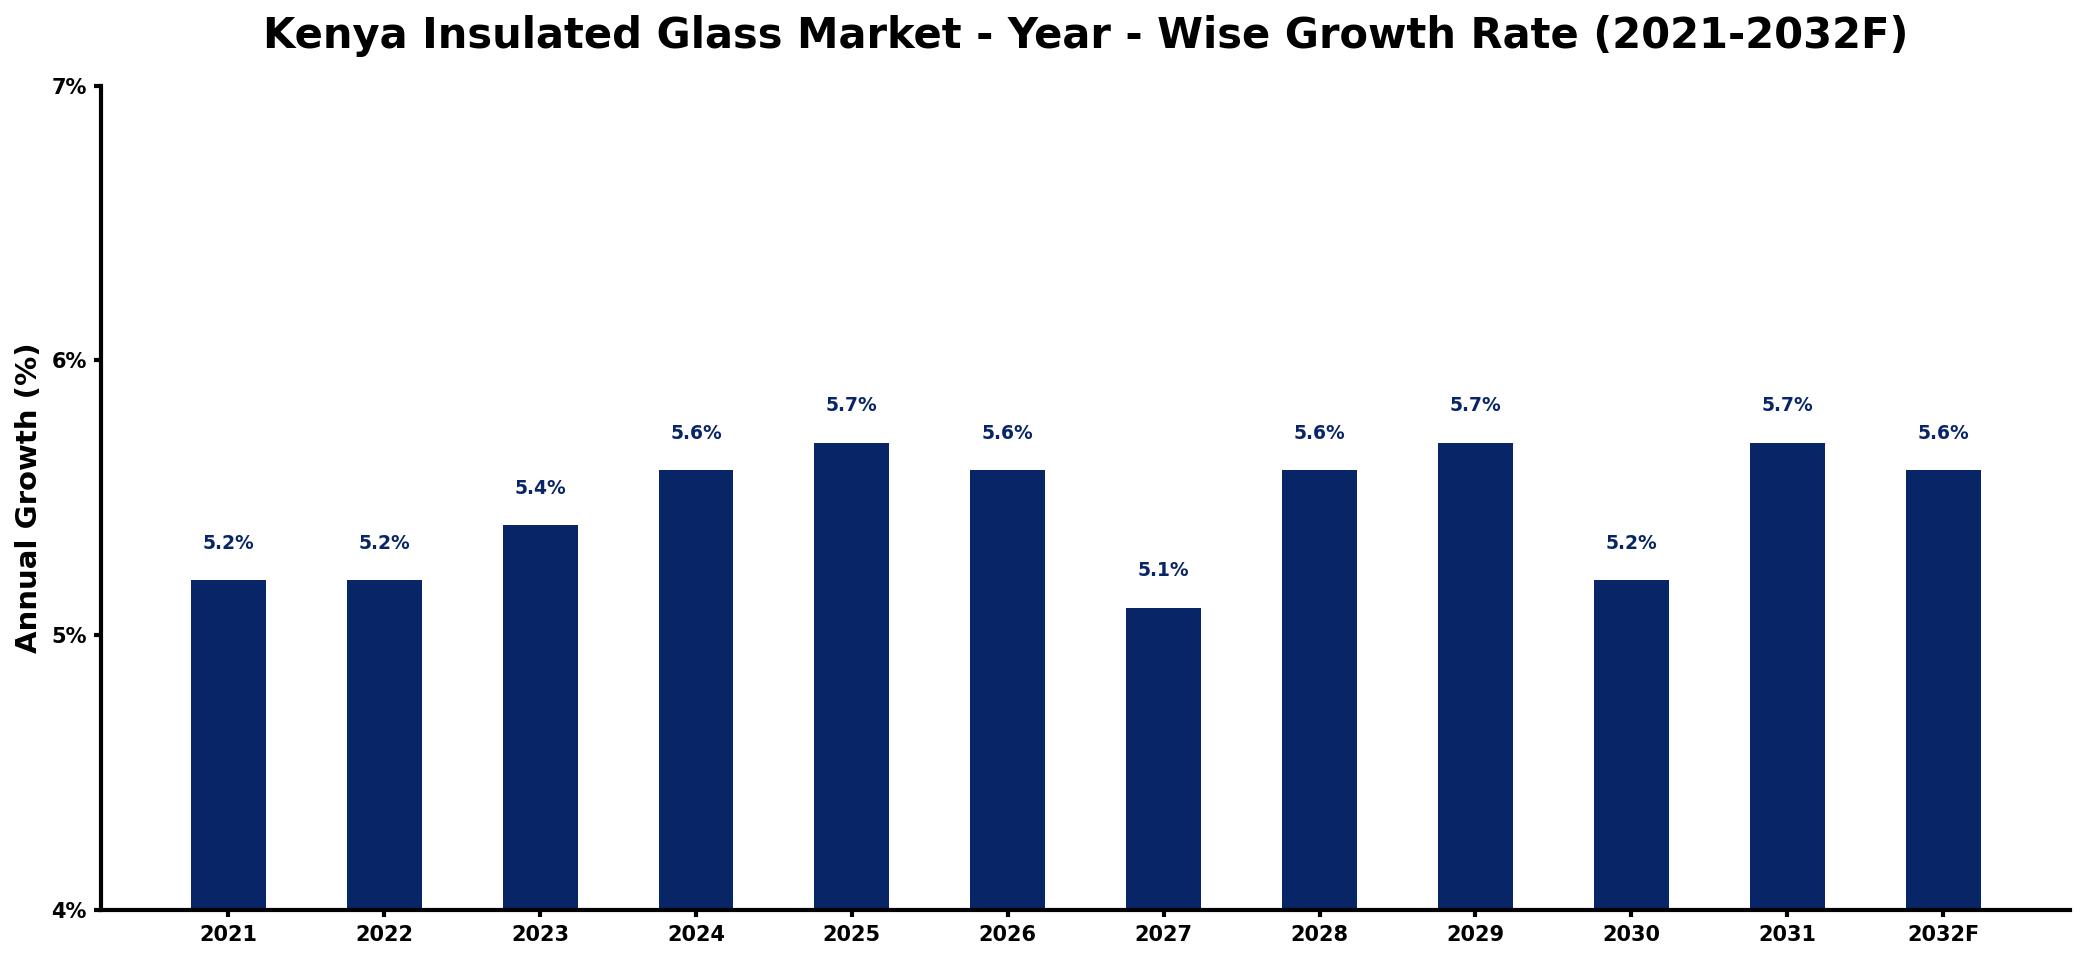
The table below presents the year‑wise growth rates along with the key drivers influencing the market
| Year | Growth Rate | Major Drivers |
| 2021 | 5.2% | Rising construction sector investments |
| 2022 | 5.2% | Growing demand from hospitality industry |
| 2023 | 5.4% | Increased focus on energy efficiency |
| 2024 | 5.6% | Expansion of commercial real estate |
| 2025 | 5.7% | Emerging residential construction projects |
| 2026 | 5.6% | Government incentives for energy efficiency |
| 2027 | 5.1% | Surge in renovation activities nationwide |
| 2028 | 5.6% | Technological advancements in building materials |
| 2029 | 5.7% | Growing interest in sustainable architecture |
| 2030 | 5.2% | Increased urbanization and population growth |
| 2031 | 5.7% | Rising consumer awareness on insulation |
| 2032 | 5.6% | Strengthening infrastructure development initiatives |
Note: Market size estimations and growth projections presented in this report are based on 6Wresearch's proprietary forecasting methodology, utilizing the latest available industry data, government publications, and primary research inputs.
Kenya Insulated Glass Market Synopsis
In recent years, the Kenya insulated glass market has seen a notable increase in interest due to a shift toward energy-efficient building practices. Insulated glass units, known for their dual or multi-pane designs filled with insulating gas, are becoming a staple in modern construction, offering superior thermal performance compared to traditional glass.
This market transformation is particularly evident in major cities like Nairobi, where real estate developers and homeowners alike are prioritizing sustainability. Awareness of insulated glass benefits, such as reduced energy costs and increased comfort, is encouraging consumers to invest in these advanced solutions.
Kenya Insulated Glass Market Key Takeaways
- The market is driven by increasing construction activities, especially in urban areas.
- Growing consumer awareness regarding energy-efficient solutions propels demand for insulated glass.
- Technological advancements have led to the emergence of innovative products, including self-cleaning and smart glass.
- Government regulations supporting sustainability are creating favorable market conditions.
- Investment opportunities are abundant, particularly in manufacturing and distribution sectors.
Evaluation of Restraints in Kenya Insulated Glass Market
Despite the positive growth outlook, the Kenya insulated glass market faces several constraints. A significant challenge is the competition posed by lower-cost alternatives, such as traditional single-pane glass, which can hinder consumer adoption of insulated solutions. Additionally, limited public awareness regarding the long-term benefits of insulated glass creates barriers to market penetration. Furthermore, fluctuations in raw material costs and import duties can complicate pricing strategies for manufacturers, affecting overall market competitiveness.
Kenya Insulated Glass Market Trends
The drive for energy-efficient buildings is reshaping the landscape of the Kenya insulated glass market. Current trends indicate a strong preference for double-glazing solutions that provide thermal insulation and soundproofing. Moreover, technological advancements are paving the way for innovative products tailored to specific consumer needs, such as energy management systems integrated into insulated glass. As the construction sector evolves, so too does the demand for multifunctional glass products that blend aesthetics with performance.
Kenya Insulated Glass Market Opportunities
With the ongoing urbanization and infrastructure development in Kenya, the insulated glass market is poised for lucrative investment opportunities. Stakeholders can benefit by focusing on the manufacturing and distribution of energy-efficient solutions tailored for residential, commercial, and industrial projects. Collaborations with architects and developers can further enhance market penetration, as these partnerships facilitate the integration of insulated glass in upcoming building designs. Additionally, raising consumer awareness about the cost benefits associated with energy-efficient solutions will likely yield significant market growth.
Government Initiatives in the Kenya Insulated Glass Market
Government policies in Kenya increasingly favor sustainable construction practices, which directly impact the insulated glass market. Regulations promoting energy efficiency, such as the Energy (Solar Water Heating) Regulations 2012 and the Energy Act of 2019, provide a supportive framework for the adoption of energy-efficient materials. These initiatives create a conducive environment for insulated glass manufacturers and encourage investments in sustainable technologies.
Future Insights of the Kenya Insulated Glass Market
Looking ahead, the Kenya insulated glass market is set for robust growth as construction activities escalate and the push for energy-efficient solutions intensifies. Expectations of increased infrastructure development, along with greater public awareness of sustainability issues, are likely to bolster demand for insulated glass products. Furthermore, continuous advancements in technology, such as smart glass applications, will pave the way for innovative solutions that meet modern building demands.
Kenya Insulated Glass Market Latest Developments (2025 - 2026)
Recent trends in the Kenya insulated glass market indicate a shift towards integrating smart technology into glass products, enabling functionalities like automated climate control and energy monitoring. As local manufacturers ramp up production capabilities, they are increasingly focusing on quality enhancement to compete with international standards. Notably, public awareness campaigns regarding the benefits of insulated glass are being amplified, significantly aiding market penetration.
Kenya Insulated Glass Market - Key Attractiveness of the Report
- 10 Years of Market Numbers
- Historical Data Starting from 2022 to 2025
- Base Year: 2025
- Forecast Data until 2032
- Key Performance Indicators Impacting the Market
- Major Upcoming Developments and Projects
Key Highlights of the Report:
- Kenya Insulated Glass Market Outlook
- Market Size of Kenya Insulated Glass Market, 2025
- Forecast of Kenya Insulated Glass Market, 2032
- Historical Data and Forecast of Kenya Insulated Glass Revenues & Volume for the Period 2022-2032F
- Kenya Insulated Glass Market Trend Evolution
- Kenya Insulated Glass Market Drivers and Challenges
- Kenya Insulated Glass Price Trends
- Kenya Insulated Glass Porter's Five Forces
- Kenya Insulated Glass Industry Life Cycle
- Historical Data and Forecast of Kenya Insulated Glass Market Revenues & Volume By Type for the Period 2022-2032F
- Historical Data and Forecast of Kenya Insulated Glass Market Revenues & Volume By Heated Insulating Glass for the Period 2022-2032F
- Historical Data and Forecast of Kenya Insulated Glass Market Revenues & Volume By Tempering Insulating Glass for the Period 2022-2032F
- Historical Data and Forecast of Kenya Insulated Glass Market Revenues & Volume By Custom Insulated Glass for the Period 2022-2032F
- Historical Data and Forecast of Kenya Insulated Glass Market Revenues & Volume By Other Glasses for the Period 2022-2032F
- Historical Data and Forecast of Kenya Insulated Glass Market Revenues & Volume By Application for the Period 2022-2032F
- Historical Data and Forecast of Kenya Insulated Glass Market Revenues & Volume By Doors & Partitions for the Period 2022-2032F
- Historical Data and Forecast of Kenya Insulated Glass Market Revenues & Volume By Kitchen Appliances & Cabinets for the Period 2022-2032F
- Historical Data and Forecast of Kenya Insulated Glass Market Revenues & Volume By Floors & Ceilings for the Period 2022-2032F
- Historical Data and Forecast of Kenya Insulated Glass Market Revenues & Volume By Furniture & Curtain Walls for the Period 2022-2032F
- Historical Data and Forecast of Kenya Insulated Glass Market Revenues & Volume By Railings & Bolted Structures for the Period 2022-2032F
- Historical Data and Forecast of Kenya Insulated Glass Market Revenues & Volume By Automotive Glasses for the Period 2022-2032F
- Historical Data and Forecast of Kenya Insulated Glass Market Revenues & Volume By End User for the Period 2022-2032F
- Historical Data and Forecast of Kenya Insulated Glass Market Revenues & Volume By Residential Buildings for the Period 2022-2032F
- Historical Data and Forecast of Kenya Insulated Glass Market Revenues & Volume By Commercial & Institutional Buildings for the Period 2022-2032F
- Historical Data and Forecast of Kenya Insulated Glass Market Revenues & Volume By Industrial Users for the Period 2022-2032F
- Kenya Insulated Glass Import Export Trade Statistics
- Market Opportunity Assessment By Type
- Market Opportunity Assessment By Application
- Market Opportunity Assessment By End User
- Kenya Insulated Glass Top Companies Market Share
- Kenya Insulated Glass Competitive Benchmarking By Technical and Operational Parameters
- Kenya Insulated Glass Company Profiles
- Kenya Insulated Glass Key Strategic Recommendations
Frequently Asked Questions About the Market Study (FAQs):
The growth is primarily driven by the increasing demand for energy-efficient building materials, especially in urban areas, alongside consumer awareness of the benefits of insulated glass in reducing energy costs.
The Kenya Insulated Glass Market is projected to reach USD 353 Million by 2032, indicating a strong upward trend as demand for sustainable construction materials rises.
Key challenges include competition from cheaper alternatives like single-pane glass, and limited consumer awareness about insulated glass benefits, which hinders market growth.
Both the residential and commercial sectors are increasingly adopting insulated glass solutions, driven by a demand for energy efficiency and improved building aesthetics.
Government initiatives focused on promoting energy efficiency and sustainable practices are significantly boosting the demand for insulated glass products, creating a more favorable market landscape.
6Wresearch actively monitors the Kenya Insulated Glass Market and publishes its comprehensive annual report, highlighting emerging trends, growth drivers, revenue analysis, and forecast outlook. Our insights help businesses to make data-backed strategic decisions with ongoing market dynamics. Our analysts track relevent industries related to the Kenya Insulated Glass Market, allowing our clients with actionable intelligence and reliable forecasts tailored to emerging regional needs.
Yes, we provide customisation as per your requirements. To learn more, feel free to contact us on sales@6wresearch.com
1 Executive Summary |
2 Introduction |
2.1 Key Highlights of the Report |
2.2 Report Description |
2.3 Market Scope & Segmentation |
2.4 Research Methodology |
2.5 Assumptions |
3 Kenya Insulated Glass Market Overview |
3.1 Kenya Country Macro Economic Indicators |
3.2 Kenya Insulated Glass Market Revenues & Volume, 2022 & 2032F |
3.3 Kenya Insulated Glass Market - Industry Life Cycle |
3.4 Kenya Insulated Glass Market - Porter's Five Forces |
3.5 Kenya Insulated Glass Market Revenues & Volume Share, By Type, 2022 & 2032F |
3.6 Kenya Insulated Glass Market Revenues & Volume Share, By Application, 2022 & 2032F |
3.7 Kenya Insulated Glass Market Revenues & Volume Share, By End User, 2022 & 2032F |
4 Kenya Insulated Glass Market Dynamics |
4.1 Impact Analysis |
4.2 Market Drivers |
4.2.1 Increasing demand for energy-efficient solutions in the construction sector |
4.2.2 Growing government initiatives promoting sustainable building practices |
4.2.3 Rise in urbanization and infrastructure development projects in Kenya |
4.3 Market Restraints |
4.3.1 High initial cost of insulated glass compared to traditional glass solutions |
4.3.2 Lack of awareness among consumers about the benefits of insulated glass |
4.3.3 Limited availability of skilled labor for installation and maintenance of insulated glass |
5 Kenya Insulated Glass Market Trends |
6 Kenya Insulated Glass Market, By Types |
6.1 Kenya Insulated Glass Market, By Type |
6.1.1 Overview and Analysis |
6.1.2 Kenya Insulated Glass Market Revenues & Volume, By Type, 2022-2032F |
6.1.3 Kenya Insulated Glass Market Revenues & Volume, By Heated Insulating Glass, 2022-2032F |
6.1.4 Kenya Insulated Glass Market Revenues & Volume, By Tempering Insulating Glass, 2022-2032F |
6.1.5 Kenya Insulated Glass Market Revenues & Volume, By Custom Insulated Glass, 2022-2032F |
6.1.6 Kenya Insulated Glass Market Revenues & Volume, By Other Glasses, 2022-2032F |
6.2 Kenya Insulated Glass Market, By Application |
6.2.1 Overview and Analysis |
6.2.2 Kenya Insulated Glass Market Revenues & Volume, By Doors & Partitions, 2022-2032F |
6.2.3 Kenya Insulated Glass Market Revenues & Volume, By Kitchen Appliances & Cabinets, 2022-2032F |
6.2.4 Kenya Insulated Glass Market Revenues & Volume, By Floors & Ceilings, 2022-2032F |
6.2.5 Kenya Insulated Glass Market Revenues & Volume, By Furniture & Curtain Walls, 2022-2032F |
6.2.6 Kenya Insulated Glass Market Revenues & Volume, By Railings & Bolted Structures, 2022-2032F |
6.2.7 Kenya Insulated Glass Market Revenues & Volume, By Automotive Glasses, 2022-2032F |
6.3 Kenya Insulated Glass Market, By End User |
6.3.1 Overview and Analysis |
6.3.2 Kenya Insulated Glass Market Revenues & Volume, By Residential Buildings, 2022-2032F |
6.3.3 Kenya Insulated Glass Market Revenues & Volume, By Commercial & Institutional Buildings, 2022-2032F |
6.3.4 Kenya Insulated Glass Market Revenues & Volume, By Industrial Users, 2022-2032F |
7 Kenya Insulated Glass Market Import-Export Trade Statistics |
7.1 Kenya Insulated Glass Market Export to Major Countries |
7.2 Kenya Insulated Glass Market Imports from Major Countries |
8 Kenya Insulated Glass Market Key Performance Indicators |
8.1 Energy efficiency ratings of buildings using insulated glass |
8.2 Number of green building certifications that require the use of insulated glass |
8.3 Percentage increase in the adoption of insulated glass in new construction projects |
8.4 Average lifespan of insulated glass installations |
8.5 Number of manufacturers offering insulated glass solutions in the Kenyan market |
9 Kenya Insulated Glass Market - Opportunity Assessment |
9.1 Kenya Insulated Glass Market Opportunity Assessment, By Type, 2022 & 2032F |
9.2 Kenya Insulated Glass Market Opportunity Assessment, By Application, 2022 & 2032F |
9.3 Kenya Insulated Glass Market Opportunity Assessment, By End User, 2022 & 2032F |
10 Kenya Insulated Glass Market - Competitive Landscape |
10.1 Kenya Insulated Glass Market Revenue Share, By Companies, 2025 |
10.2 Kenya Insulated Glass Market Competitive Benchmarking, By Operating and Technical Parameters |
11 Company Profiles |
12 Recommendations |
13 Disclaimer |
Global Go To Market Strategy - 2030
Export potential enables firms to identify high-growth global markets with greater confidence by combining advanced trade intelligence with a structured quantitative methodology. The framework analyzes emerging demand trends and country-level import patterns while integrating macroeconomic and trade datasets such as GDP and population forecasts, bilateral import–export flows, tariff structures, elasticity differentials between developed and developing economies, geographic distance, and import demand projections. Using weighted trade values from 2020–2024 as the base period to project country-to-country export potential for 2030, these inputs are operationalized through calculated drivers such as gravity model parameters, tariff impact factors, and projected GDP per-capita growth. Through an analysis of hidden potentials, demand hotspots, and market conditions that are most favorable to success, this method enables firms to focus on target countries, maximize returns, and global expansion with data, backed by accuracy.
By factoring in the projected importer demand gap that is currently unmet and could be potential opportunity, it identifies the potential for the Exporter (Country) among 190 countries, against the general trade analysis, which identifies the biggest importer or exporter.
To discover high-growth global markets and optimize your business strategy:
Click Here
Pricing
- Single User License$ 1,995
- Department License$ 2,400
- Site License$ 3,120
- Global License$ 3,795

Leadership Perspectives from Industry Events
Search
Thought Leadership and Analyst Meet


Our Clients
6WResearch In News
- India Air Conditioner Market Set for Strong Rebound in 2026 After Weather-Led Correction and GST-Driven Recovery: 6Wresearch
- ADAS in India: How Automatic Emergency Braking, Blind Spot Detection & Driver Monitoring are Transforming Road Safety
- Doha a strategic location for EV manufacturing hub: IPA Qatar
- Demand for luxury TVs surging in the GCC, says Samsung
- Empowering Growth: The Thriving Journey of Bangladesh’s Cable Industry
- Demand for luxury TVs surging in the GCC, says Samsung
Latest Reports
- Nicaragua RPG Gaming Market (2026-2032)
- New Zealand RPG Gaming Market (2026-2032)
- Netherlands RPG Gaming Market (2026-2032)
- Nauru RPG Gaming Market (2026-2032)
- Namibia RPG Gaming Market (2026-2032)
- Mozambique RPG Gaming Market (2026-2032)
- Montenegro RPG Gaming Market (2026-2032)
- Mongolia RPG Gaming Market (2026-2032)
- Monaco RPG Gaming Market (2026-2032)
- Micronesia RPG Gaming Market (2026-2032)
Industry Events and Analyst Meet

EV India Expo 2026

HIMTEX 2026

India Refining Summit 2026

India EV Show 2026

EV tech India Expo 2026
Whitepaper
- Middle East & Africa Commercial Security Market Click here to view more.
- Middle East & Africa Fire Safety Systems & Equipment Market Click here to view more.
- GCC Drone Market Click here to view more.
- Middle East Lighting Fixture Market Click here to view more.
- GCC Physical & Perimeter Security Market Click here to view more.