Kenya Laboratory Glassware Market (2020-2026) | Trends, Share, Industry, Value, Size, Growth, Revenue, Forecast, COVID-19 IMPACT, Analysis, Outlook & Companies
Market Forecast By Product Type (Pipettes and Pipette Tips, Burettes, Storage Containers, Beakers, Flasks, Petri Dishes, Others), By End-users (Research and Academic Institutes, Hospitals and Diagnostic Centers, Pharmaceutical and Biotechnology Industries, Contract Research Organizations, Food and Beverage Industry, Othe) And Competitive Landscape
| Product Code: ETC029290 | Publication Date: Oct 2020 | Updated Date: Apr 2025 | Product Type: Report | |
| Publisher: 6Wresearch | Author: Ravi Bhandari | No. of Pages: 70 | No. of Figures: 35 | No. of Tables: 5 |
Kenya Laboratory Glassware Market Growth Rate Analysis (2021-2031)
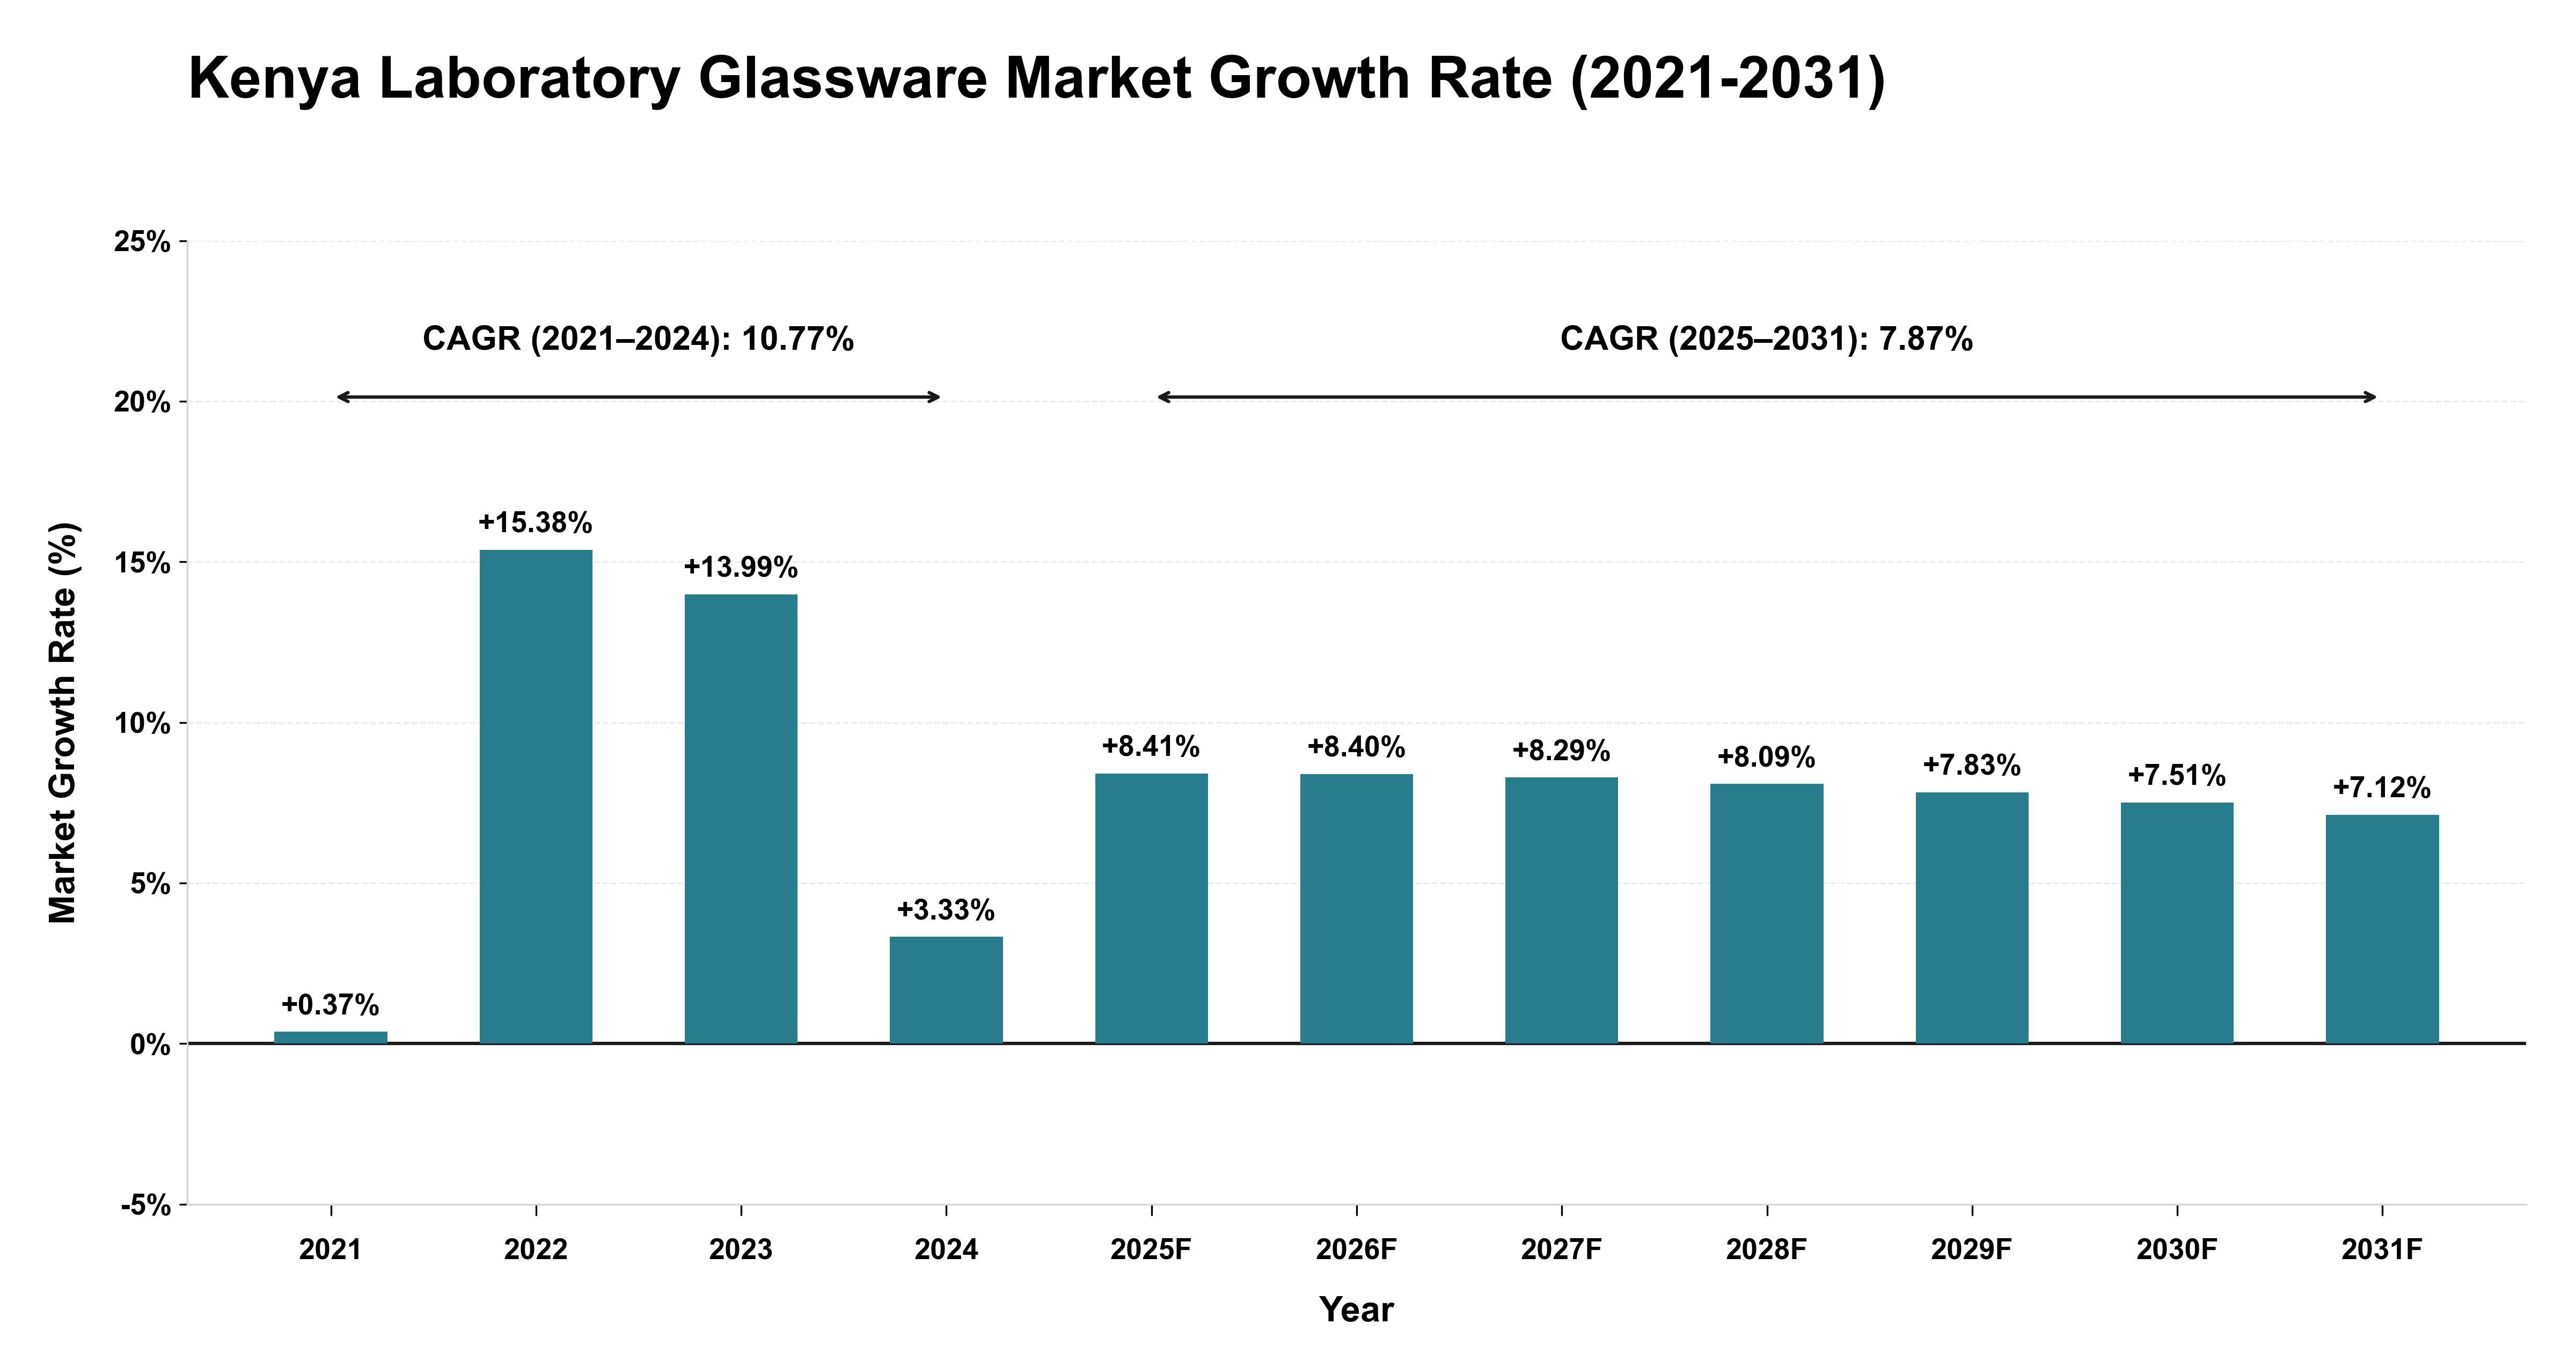
The Kenya Laboratory Glassware Market exhibited a robust historical performance with a CAGR of 10.77% from 2021 to 2024, driven by steady demand and technological advancements. The market saw slight growth in 2021 at 0.37%, followed by significant surges in 2022 and 2023 at 15.38% and 13.99%, respectively, indicating increasing adoption and investment in laboratory equipment. However, in 2024, growth moderated to 3.33%, signaling potential market saturation or stabilization post the rapid expansion phase. Looking ahead to the forecast period from 2025 to 2031, the market is expected to maintain a positive trajectory with a CAGR of 7.87%. This signifies a phase of stabilizing expansion, where the market is likely to experience more moderate but sustainable growth rates compared to the previous years, reflecting a matured and balanced ecosystem for laboratory glassware in Kenya.
Kenya Laboratory Glassware Market Overview
The Kenya laboratory glassware market is witnessing steady demand from research laboratories, educational institutions, and healthcare facilities. Laboratory glassware such as beakers, flasks, and test tubes are essential tools for conducting experiments, handling chemicals, and storing samples in laboratory settings. With ongoing investments in scientific research and education, the demand for laboratory glassware is expected to remain robust in Kenya.
Drivers of the market
The Kenya Laboratory Glassware market is witnessing growth propelled by the expanding healthcare, pharmaceutical, and research sectors in the country. Laboratory glassware encompasses a wide range of equipment such as beakers, flasks, test tubes, and pipettes used for handling and measuring liquids and chemicals in laboratory experiments and analyses. Additionally, the increasing adoption of advanced glassware materials and designs further drives market growth in Kenya.
Challenges of the market
Challenges in the laboratory glassware market of Kenya include breakage risks, quality control, and supply chain management. Ensuring durability and precision while meeting diverse laboratory requirements presents significant challenges for manufacturers and suppliers.
Government Policy of the market
In the laboratory glassware market, government policies prioritize product safety and quality assurance. Regulations specify material standards, manufacturing processes, and labeling requirements for laboratory glassware to ensure compatibility with scientific experiments and procedures.
Key Highlights of the Report:
- Kenya Laboratory Glassware Market Outlook
- Market Size of Kenya Laboratory Glassware Market, 2019
- Forecast of Kenya Laboratory Glassware Market, 2026
- Historical Data and Forecast of Kenya Laboratory Glassware Revenues & Volume for the Period 2016 - 2026
- Kenya Laboratory Glassware Market Trend Evolution
- Kenya Laboratory Glassware Market Drivers and Challenges
- Kenya Laboratory Glassware Price Trends
- Kenya Laboratory Glassware Porter's Five Forces
- Kenya Laboratory Glassware Industry Life Cycle
- Historical Data and Forecast of Kenya Laboratory Glassware Market Revenues & Volume By Product Type for the Period 2016 - 2026
- Historical Data and Forecast of Kenya Laboratory Glassware Market Revenues & Volume By Pipettes and Pipette Tips for the Period 2016 - 2026
- Historical Data and Forecast of Kenya Laboratory Glassware Market Revenues & Volume By Burettes for the Period 2016 - 2026
- Historical Data and Forecast of Kenya Laboratory Glassware Market Revenues & Volume By Storage Containers for the Period 2016 - 2026
- Historical Data and Forecast of Kenya Laboratory Glassware Market Revenues & Volume By Beakers for the Period 2016 - 2026
- Historical Data and Forecast of Kenya Laboratory Glassware Market Revenues & Volume By Flasks for the Period 2016 - 2026
- Historical Data and Forecast of Kenya Laboratory Glassware Market Revenues & Volume By Petri Dishes for the Period 2016 - 2026
- Historical Data and Forecast of Kenya Laboratory Glassware Market Revenues & Volume By Others for the Period 2016 - 2026
- Historical Data and Forecast of Kenya Laboratory Glassware Market Revenues & Volume By End-users for the Period 2016 - 2026
- Historical Data and Forecast of Kenya Laboratory Glassware Market Revenues & Volume By Research and Academic Institutes for the Period 2016 - 2026
- Historical Data and Forecast of Kenya Laboratory Glassware Market Revenues & Volume By Hospitals and Diagnostic Centers for the Period 2016 - 2026
- Historical Data and Forecast of Kenya Laboratory Glassware Market Revenues & Volume By Pharmaceutical and Biotechnology Industries for the Period 2016 - 2026
- Historical Data and Forecast of Kenya Laboratory Glassware Market Revenues & Volume By Contract Research Organizations for the Period 2016 - 2026
- Historical Data and Forecast of Kenya Laboratory Glassware Market Revenues & Volume By Food and Beverage Industry for the Period 2016 - 2026
- Historical Data and Forecast of Kenya Laboratory Glassware Market Revenues & Volume By Othe for the Period 2016 - 2026
- Kenya Laboratory Glassware Import Export Trade Statistics
- Market Opportunity Assessment By Product Type
- Market Opportunity Assessment By End-users
- Kenya Laboratory Glassware Top Companies Market Share
- Kenya Laboratory Glassware Competitive Benchmarking By Technical and Operational Parameters
- Kenya Laboratory Glassware Company Profiles
- Kenya Laboratory Glassware Key Strategic Recommendations
Frequently Asked Questions About the Market Study (FAQs):
6Wresearch actively monitors the Kenya Laboratory Glassware Market and publishes its comprehensive annual report, highlighting emerging trends, growth drivers, revenue analysis, and forecast outlook. Our insights help businesses to make data-backed strategic decisions with ongoing market dynamics. Our analysts track relevent industries related to the Kenya Laboratory Glassware Market, allowing our clients with actionable intelligence and reliable forecasts tailored to emerging regional needs.
Yes, we provide customisation as per your requirements. To learn more, feel free to contact us on sales@6wresearch.com
1 Executive Summary |
2 Introduction |
2.1 Key Highlights of the Report |
2.2 Report Description |
2.3 Market Scope & Segmentation |
2.4 Research Methodology |
2.5 Assumptions |
3 Kenya Laboratory Glassware Market Overview |
3.1 Kenya Country Macro Economic Indicators |
3.2 Kenya Laboratory Glassware Market Revenues & Volume, 2019 & 2026F |
3.3 Kenya Laboratory Glassware Market - Industry Life Cycle |
3.4 Kenya Laboratory Glassware Market - Porter's Five Forces |
3.5 Kenya Laboratory Glassware Market Revenues & Volume Share, By Product Type, 2019 & 2026F |
3.6 Kenya Laboratory Glassware Market Revenues & Volume Share, By End-users, 2019 & 2026F |
4 Kenya Laboratory Glassware Market Dynamics |
4.1 Impact Analysis |
4.2 Market Drivers |
4.3 Market Restraints |
5 Kenya Laboratory Glassware Market Trends |
6 Kenya Laboratory Glassware Market, By Types |
6.1 Kenya Laboratory Glassware Market, By Product Type |
6.1.1 Overview and Analysis |
6.1.2 Kenya Laboratory Glassware Market Revenues & Volume, By Product Type, 2016 - 2026F |
6.1.3 Kenya Laboratory Glassware Market Revenues & Volume, By Pipettes and Pipette Tips, 2016 - 2026F |
6.1.4 Kenya Laboratory Glassware Market Revenues & Volume, By Burettes, 2016 - 2026F |
6.1.5 Kenya Laboratory Glassware Market Revenues & Volume, By Storage Containers, 2016 - 2026F |
6.1.6 Kenya Laboratory Glassware Market Revenues & Volume, By Beakers, 2016 - 2026F |
6.1.7 Kenya Laboratory Glassware Market Revenues & Volume, By Flasks, 2016 - 2026F |
6.1.8 Kenya Laboratory Glassware Market Revenues & Volume, By Petri Dishes, 2016 - 2026F |
6.2 Kenya Laboratory Glassware Market, By End-users |
6.2.1 Overview and Analysis |
6.2.2 Kenya Laboratory Glassware Market Revenues & Volume, By Research and Academic Institutes, 2016 - 2026F |
6.2.3 Kenya Laboratory Glassware Market Revenues & Volume, By Hospitals and Diagnostic Centers, 2016 - 2026F |
6.2.4 Kenya Laboratory Glassware Market Revenues & Volume, By Pharmaceutical and Biotechnology Industries, 2016 - 2026F |
6.2.5 Kenya Laboratory Glassware Market Revenues & Volume, By Contract Research Organizations, 2016 - 2026F |
6.2.6 Kenya Laboratory Glassware Market Revenues & Volume, By Food and Beverage Industry, 2016 - 2026F |
6.2.7 Kenya Laboratory Glassware Market Revenues & Volume, By Othe, 2016 - 2026F |
7 Kenya Laboratory Glassware Market Import-Export Trade Statistics |
7.1 Kenya Laboratory Glassware Market Export to Major Countries |
7.2 Kenya Laboratory Glassware Market Imports from Major Countries |
8 Kenya Laboratory Glassware Market Key Performance Indicators |
9 Kenya Laboratory Glassware Market - Opportunity Assessment |
9.1 Kenya Laboratory Glassware Market Opportunity Assessment, By Product Type, 2019 & 2026F |
9.2 Kenya Laboratory Glassware Market Opportunity Assessment, By End-users, 2019 & 2026F |
10 Kenya Laboratory Glassware Market - Competitive Landscape |
10.1 Kenya Laboratory Glassware Market Revenue Share, By Companies, 2019 |
10.2 Kenya Laboratory Glassware Market Competitive Benchmarking, By Operating and Technical Parameters |
11 Company Profiles |
12 Recommendations |
13 Disclaimer |
Global Go To Market Strategy - 2030
Export potential enables firms to identify high-growth global markets with greater confidence by combining advanced trade intelligence with a structured quantitative methodology. The framework analyzes emerging demand trends and country-level import patterns while integrating macroeconomic and trade datasets such as GDP and population forecasts, bilateral import–export flows, tariff structures, elasticity differentials between developed and developing economies, geographic distance, and import demand projections. Using weighted trade values from 2020–2024 as the base period to project country-to-country export potential for 2030, these inputs are operationalized through calculated drivers such as gravity model parameters, tariff impact factors, and projected GDP per-capita growth. Through an analysis of hidden potentials, demand hotspots, and market conditions that are most favorable to success, this method enables firms to focus on target countries, maximize returns, and global expansion with data, backed by accuracy.
By factoring in the projected importer demand gap that is currently unmet and could be potential opportunity, it identifies the potential for the Exporter (Country) among 190 countries, against the general trade analysis, which identifies the biggest importer or exporter.
To discover high-growth global markets and optimize your business strategy:
Click Here
Pricing
- Single User License$ 1,995
- Department License$ 2,400
- Site License$ 3,120
- Global License$ 3,795

Leadership Perspectives from Industry Events
Search
Thought Leadership and Analyst Meet


Our Clients
6WResearch In News
- India Air Conditioner Market Set for Strong Rebound in 2026 After Weather-Led Correction and GST-Driven Recovery: 6Wresearch
- ADAS in India: How Automatic Emergency Braking, Blind Spot Detection & Driver Monitoring are Transforming Road Safety
- Doha a strategic location for EV manufacturing hub: IPA Qatar
- Demand for luxury TVs surging in the GCC, says Samsung
- Empowering Growth: The Thriving Journey of Bangladesh’s Cable Industry
- Demand for luxury TVs surging in the GCC, says Samsung
Latest Reports
- Nicaragua RPG Gaming Market (2026-2032)
- New Zealand RPG Gaming Market (2026-2032)
- Netherlands RPG Gaming Market (2026-2032)
- Nauru RPG Gaming Market (2026-2032)
- Namibia RPG Gaming Market (2026-2032)
- Mozambique RPG Gaming Market (2026-2032)
- Montenegro RPG Gaming Market (2026-2032)
- Mongolia RPG Gaming Market (2026-2032)
- Monaco RPG Gaming Market (2026-2032)
- Micronesia RPG Gaming Market (2026-2032)
Industry Events and Analyst Meet

EV India Expo 2026

HIMTEX 2026

India Refining Summit 2026

India EV Show 2026

EV tech India Expo 2026
Whitepaper
- Middle East & Africa Commercial Security Market Click here to view more.
- Middle East & Africa Fire Safety Systems & Equipment Market Click here to view more.
- GCC Drone Market Click here to view more.
- Middle East Lighting Fixture Market Click here to view more.
- GCC Physical & Perimeter Security Market Click here to view more.