Kenya Lithographic Printing Chemicals Market (2026-2032) Outlook | Companies, Industry, Revenue, Growth, Forecast, Size, Value, Trends, Share & Analysis
Market Forecast By Product by Application (Inks, Fountain solutions, Cleaning solutions, Others), By Market by Application (Publication, Packaging, Promotion) And Competitive Landscape
| Product Code: ETC331370 | Publication Date: Aug 2022 | Updated Date: Jul 2026 | Product Type: Market Research Report | |
| Publisher: 6Wresearch | Author: Dhaval Chaurasia | No. of Pages: 75 | No. of Figures: 35 | No. of Tables: 20 |
Kenya Lithographic Printing Chemicals Market Size, Share & Growth Rate
The Kenya Lithographic Printing Chemicals Market was estimated at USD 291 Million in 2025 and is projected to reach USD 396 Million by 2032, growing at a CAGR of 4.5% from 2026 to 2032. This growth trajectory is primarily driven by the expanding printing sector in Kenya, particularly in packaging and advertising, which increasingly demands high-quality printing solutions. The adoption of innovative printing technologies and a rising focus on eco-friendly products are also fueling market dynamics, making the Kenya lithographic printing chemicals market an area of significant interest for industry stakeholders.
Kenya Lithographic Printing Chemicals Market Year-wise Growth Rate and Key Drivers
This graph highlights how the Kenya Lithographic Printing Chemicals Market has steadily grown over the years, supported by major growth factors.
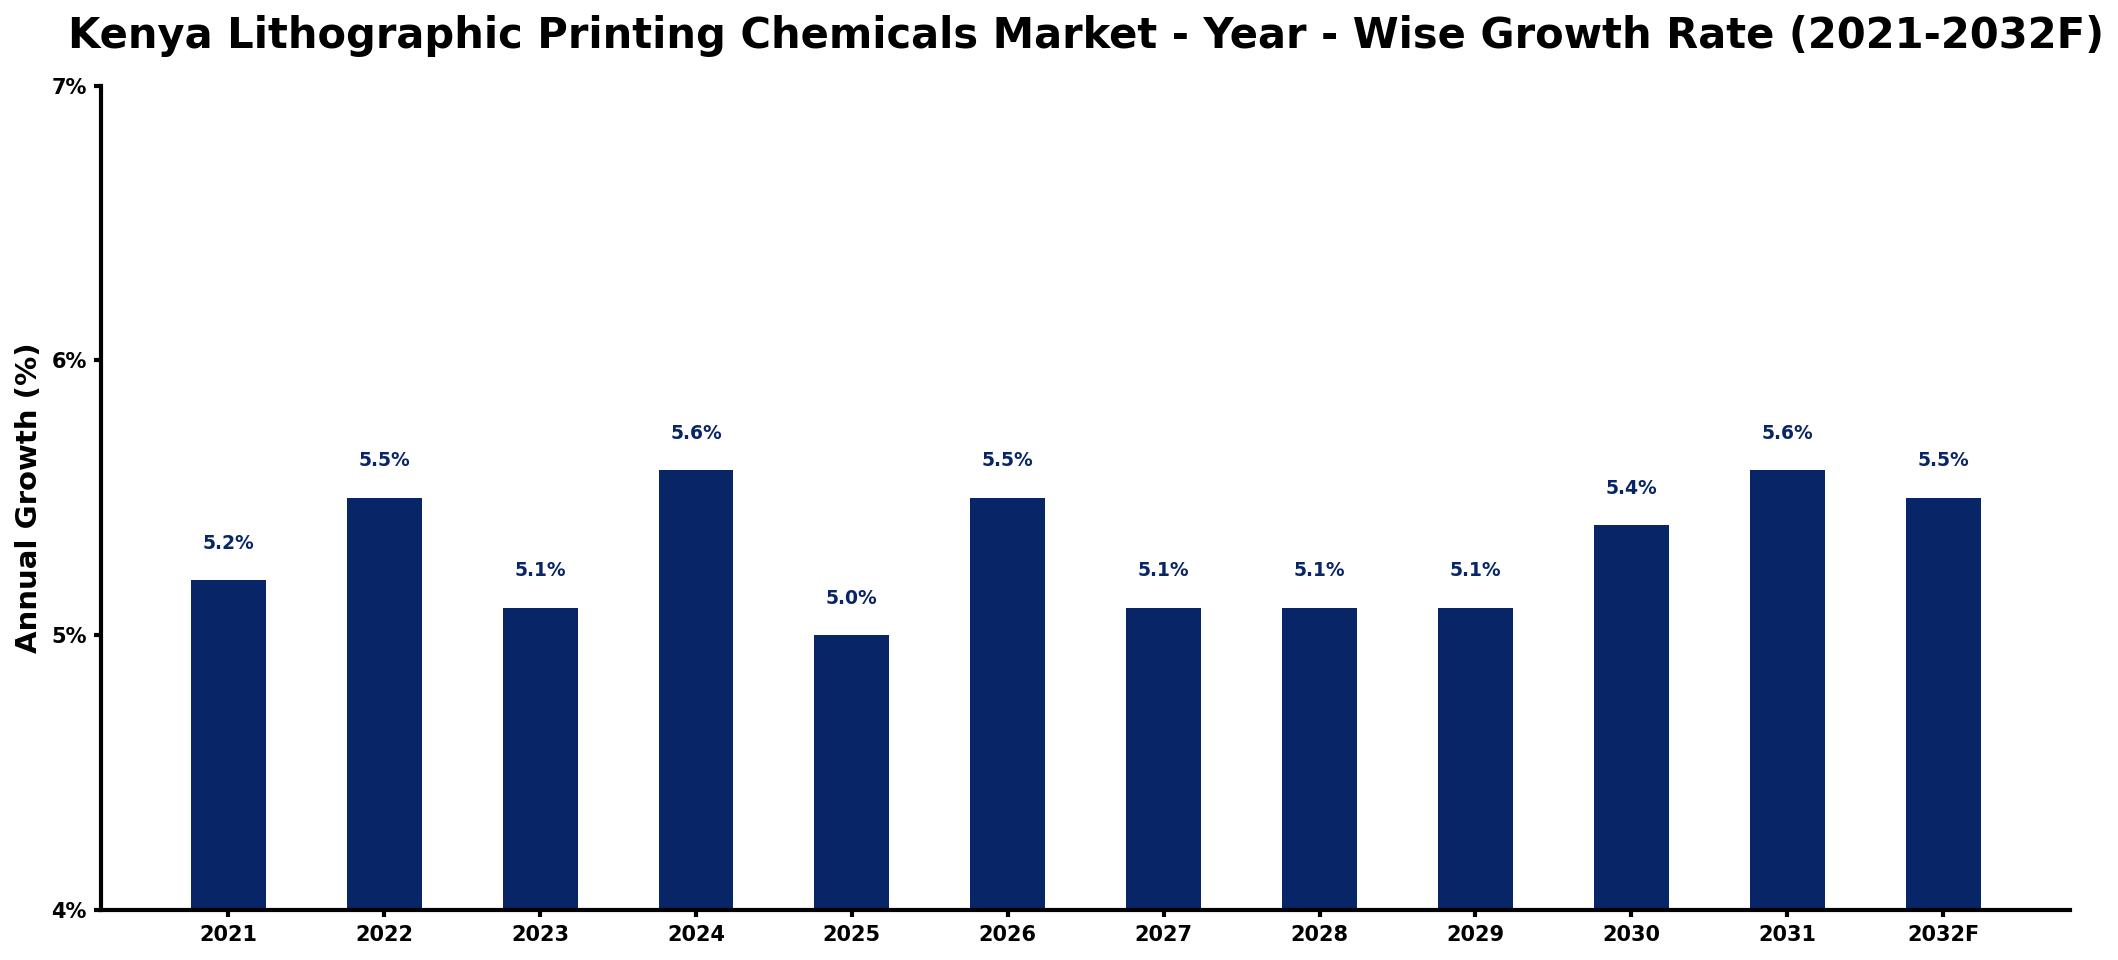
The table below presents the year‑wise growth rates along with the key drivers influencing the market
| Year | Growth Rate | Major Drivers |
| 2021 | 5.2% | Rising demand for packaging solutions |
| 2022 | 5.5% | Growth in advertising sector investments |
| 2023 | 5.1% | Expansion of digital media platforms |
| 2024 | 5.6% | Increase in consumer goods production |
| 2025 | 5.0% | Emergence of eco-friendly alternatives |
| 2026 | 5.5% | Boost in regional trade activities |
| 2027 | 5.1% | Development of local manufacturing hubs |
| 2028 | 5.1% | Surge in online retail services |
| 2029 | 5.1% | Investment in educational materials production |
| 2030 | 5.4% | growing commercial sector adoption |
| 2031 | 5.6% | Rise in event marketing expenditures |
| 2032 | 5.5% | growing downstream application demand |
Note: Market size estimations and growth projections presented in this report are based on 6Wresearch's proprietary forecasting methodology, utilizing the latest available industry data, government publications, and primary research inputs.
Kenya Lithographic Printing Chemicals Market Synopsis
A dominant force shaping the Kenya Lithographic Printing Chemicals Market is the surge in demand for high-quality printing materials across various sectors, including packaging and publishing. As businesses strive to enhance their branding through superior print quality, the need for advanced lithographic printing chemicals becomes increasingly crucial.
Moreover, the market is currently navigating a transformative phase towards sustainability. There is an escalating demand for environmentally friendly options such as soy-based inks and alcohol-free fountain solutions, as printers seek to align with global sustainability standards and reduce their ecological footprint.
Kenya Lithographic Printing Chemicals Market Key Takeaways
- The market is projected to grow significantly, driven by a rising demand for quality printing solutions.
- There is a notable shift towards eco-friendly and sustainable lithographic printing chemicals.
- Technological advancements are enhancing product performance and compatibility with digital printing processes.
- Investment opportunities are emerging in local production of raw materials and eco-friendly alternatives.
- Government regulations are aiming to promote sustainability and public health in the printing chemicals sector.
Evaluation of Restraints in Kenya Lithographic Printing Chemicals Market
Despite the positive outlook, the Kenya Lithographic Printing Chemicals Market faces several constraints that could hinder its growth. High import duties on raw materials continue to strain operational costs, leading to increased prices for consumers. Additionally, the limited availability of specialized chemicals locally restricts manufacturers' ability to meet demand efficiently. Fluctuating exchange rates also complicate import scenarios, affecting the cost predictability of raw materials. Furthermore, the growing preference for digital printing technologies poses a challenge to traditional lithographic methods, impacting the overall demand for lithographic chemicals.
Kenya Lithographic Printing Chemicals Market Trends
The market is witnessing a robust trend toward the adoption of sustainable and eco-friendly products. As awareness about environmental impacts rises, manufacturers are innovating by developing non-toxic, biodegradable chemicals that meet the regulatory standards for sustainability. Additionally, there is a growing integration of digital printing techniques with lithographic processes, which has stimulated demand for lithographic printing chemicals that can perform seamlessly with new equipment. This combination of environmental consciousness and technological advancement is reshaping the industry landscape.
Kenya Lithographic Printing Chemicals Market Opportunities
Investment opportunities in the Kenya Lithographic Printing Chemicals Market are substantial, particularly in local production facilities that can manufacture high-quality chemicals. By reducing reliance on imports, these facilities can provide more cost-effective solutions to local printers. There is also an increasing opportunity for developing innovative, eco-friendly chemicals that cater to the rising demand for sustainable products in the printing industry. This transition presents a lucrative pathway for investors looking to capitalize on the intersection of sustainability and quality in printing.
Government Initiatives in the Kenya Lithographic Printing Chemicals Market
The Kenyan government has put in place various initiatives aimed at regulating the lithographic printing chemicals market to safeguard public health and the environment. These include stringent licensing requirements for companies that handle printing chemicals and guidelines for their safe storage, disposal, and transportation. By monitoring air and water quality, the government seeks to mitigate pollution and promote best practices in the printing industry. Such regulations are essential for fostering a safer and more sustainable operational environment.
Future Insights of the Kenya Lithographic Printing Chemicals Market
Looking ahead to the period from 2026 to 2032, the Kenya Lithographic Printing Chemicals Market is expected to continue its upward trajectory, supported by the sustained growth of the packaging, publishing, and advertising sectors. As businesses increasingly prioritize quality and brand differentiation through superior printing, the demand for specialized lithographic chemicals will remain robust. The ongoing shift towards environmentally friendly practices will also drive innovations and strategic investments in the sector, ultimately enhancing the competitiveness of local manufacturers and suppliers.
Kenya Lithographic Printing Chemicals Market Latest Developments (2025 - 2026)
In recent months, the Kenya lithographic printing chemicals market has observed several key developments, reflecting a commitment to sustainability and innovation. Companies have ramped up their efforts to introduce eco-friendly products to meet the changing preferences of consumers and businesses alike. Additionally, advancements in technology are pushing the boundaries of product performance, leading to the creation of superior chemical formulations that cater to both traditional and digital printing needs. These shifts indicate a dynamic market landscape that is evolving to embrace contemporary demands.
Kenya Lithographic Printing Chemicals Market - Key Attractiveness of the Report
- 10 Years of Market Numbers
- Historical Data Starting from 2022 to 2025
- Base Year: 2025
- Forecast Data until 2032
- Key Performance Indicators Impacting the Market
- Major Upcoming Developments and Projects
Key Highlights of the Report:
- Kenya Lithographic Printing Chemicals Market Outlook
- Market Size of Kenya Lithographic Printing Chemicals Market, 2025
- Forecast of Kenya Lithographic Printing Chemicals Market, 2032
- Historical Data and Forecast of Kenya Lithographic Printing Chemicals Revenues & Volume for the Period 2022-2032F
- Kenya Lithographic Printing Chemicals Market Trend Evolution
- Kenya Lithographic Printing Chemicals Market Drivers and Challenges
- Kenya Lithographic Printing Chemicals Price Trends
- Kenya Lithographic Printing Chemicals Porter's Five Forces
- Kenya Lithographic Printing Chemicals Industry Life Cycle
- Historical Data and Forecast of Kenya Lithographic Printing Chemicals Market Revenues & Volume By Product by Application for the Period 2022-2032F
- Historical Data and Forecast of Kenya Lithographic Printing Chemicals Market Revenues & Volume By Inks for the Period 2022-2032F
- Historical Data and Forecast of Kenya Lithographic Printing Chemicals Market Revenues & Volume By Fountain solutions for the Period 2022-2032F
- Historical Data and Forecast of Kenya Lithographic Printing Chemicals Market Revenues & Volume By Cleaning solutions for the Period 2022-2032F
- Historical Data and Forecast of Kenya Lithographic Printing Chemicals Market Revenues & Volume By Others for the Period 2022-2032F
- Historical Data and Forecast of Kenya Lithographic Printing Chemicals Market Revenues & Volume By Market by Application for the Period 2022-2032F
- Historical Data and Forecast of Kenya Lithographic Printing Chemicals Market Revenues & Volume By Publication for the Period 2022-2032F
- Historical Data and Forecast of Kenya Lithographic Printing Chemicals Market Revenues & Volume By Packaging for the Period 2022-2032F
- Historical Data and Forecast of Kenya Lithographic Printing Chemicals Market Revenues & Volume By Promotion for the Period 2022-2032F
- Kenya Lithographic Printing Chemicals Import Export Trade Statistics
- Market Opportunity Assessment By Product by Application
- Market Opportunity Assessment By Market by Application
- Kenya Lithographic Printing Chemicals Top Companies Market Share
- Kenya Lithographic Printing Chemicals Competitive Benchmarking By Technical and Operational Parameters
- Kenya Lithographic Printing Chemicals Company Profiles
- Kenya Lithographic Printing Chemicals Key Strategic Recommendations
Frequently Asked Questions About the Market Study (FAQs):
The market is projected to grow at a CAGR of 4.5% from 2026 to 2032, reaching USD 396 Million by 2032.
The primary applications include packaging, publishing, and advertising, which are all focusing on high-quality print outcomes to enhance brand visibility.
The market is increasingly adopting eco-friendly products such as soy-based inks and alcohol-free fountain solutions to meet environmental standards.
Major challenges include high import duties on raw materials and competition from digital printing technologies, which might limit traditional printing growth.
Investing in local manufacturing can reduce reliance on imports, lower costs, and enhance the availability of specialized chemicals to meet local demand effectively.
Government policies focus on regulating hazardous materials in the printing industry, promoting public health and environmental sustainability, which ultimately shapes market practices.
6Wresearch actively monitors the Kenya Lithographic Printing Chemicals Market and publishes its comprehensive annual report, highlighting emerging trends, growth drivers, revenue analysis, and forecast outlook. Our insights help businesses to make data-backed strategic decisions with ongoing market dynamics. Our analysts track relevent industries related to the Kenya Lithographic Printing Chemicals Market, allowing our clients with actionable intelligence and reliable forecasts tailored to emerging regional needs.
Yes, we provide customisation as per your requirements. To learn more, feel free to contact us on sales@6wresearch.com
1 Executive Summary |
2 Introduction |
2.1 Key Highlights of the Report |
2.2 Report Description |
2.3 Market Scope & Segmentation |
2.4 Research Methodology |
2.5 Assumptions |
3 Kenya Lithographic Printing Chemicals Market Overview |
3.1 Kenya Country Macro Economic Indicators |
3.2 Kenya Lithographic Printing Chemicals Market Revenues & Volume, 2022 & 2032F |
3.3 Kenya Lithographic Printing Chemicals Market - Industry Life Cycle |
3.4 Kenya Lithographic Printing Chemicals Market - Porter's Five Forces |
3.5 Kenya Lithographic Printing Chemicals Market Revenues & Volume Share, By Product by Application, 2022 & 2032F |
3.6 Kenya Lithographic Printing Chemicals Market Revenues & Volume Share, By Market by Application, 2022 & 2032F |
4 Kenya Lithographic Printing Chemicals Market Dynamics |
4.1 Impact Analysis |
4.2 Market Drivers |
4.2.1 Growing demand for high-quality printing materials in various industries in Kenya |
4.2.2 Increasing adoption of lithographic printing technology for packaging and labeling purposes in the country |
4.3 Market Restraints |
4.3.1 Volatility in raw material prices affecting the production cost of lithographic printing chemicals |
4.3.2 Competition from alternative printing technologies impacting the market growth |
5 Kenya Lithographic Printing Chemicals Market Trends |
6 Kenya Lithographic Printing Chemicals Market, By Types |
6.1 Kenya Lithographic Printing Chemicals Market, By Product by Application |
6.1.1 Overview and Analysis |
6.1.2 Kenya Lithographic Printing Chemicals Market Revenues & Volume, By Product by Application, 2022-2032F |
6.1.3 Kenya Lithographic Printing Chemicals Market Revenues & Volume, By Inks, 2022-2032F |
6.1.4 Kenya Lithographic Printing Chemicals Market Revenues & Volume, By Fountain solutions, 2022-2032F |
6.1.5 Kenya Lithographic Printing Chemicals Market Revenues & Volume, By Cleaning solutions, 2022-2032F |
6.1.6 Kenya Lithographic Printing Chemicals Market Revenues & Volume, By Others, 2022-2032F |
6.2 Kenya Lithographic Printing Chemicals Market, By Market by Application |
6.2.1 Overview and Analysis |
6.2.2 Kenya Lithographic Printing Chemicals Market Revenues & Volume, By Publication, 2022-2032F |
6.2.3 Kenya Lithographic Printing Chemicals Market Revenues & Volume, By Packaging, 2022-2032F |
6.2.4 Kenya Lithographic Printing Chemicals Market Revenues & Volume, By Promotion, 2022-2032F |
7 Kenya Lithographic Printing Chemicals Market Import-Export Trade Statistics |
7.1 Kenya Lithographic Printing Chemicals Market Export to Major Countries |
7.2 Kenya Lithographic Printing Chemicals Market Imports from Major Countries |
8 Kenya Lithographic Printing Chemicals Market Key Performance Indicators |
8.1 Environmental impact metrics related to the use of lithographic printing chemicals |
8.2 Innovation rate in the development of eco-friendly lithographic printing chemicals |
8.3 Adoption rate of digital printing technology as a substitute for lithographic printing in the market |
9 Kenya Lithographic Printing Chemicals Market - Opportunity Assessment |
9.1 Kenya Lithographic Printing Chemicals Market Opportunity Assessment, By Product by Application, 2022 & 2032F |
9.2 Kenya Lithographic Printing Chemicals Market Opportunity Assessment, By Market by Application, 2022 & 2032F |
10 Kenya Lithographic Printing Chemicals Market - Competitive Landscape |
10.1 Kenya Lithographic Printing Chemicals Market Revenue Share, By Companies, 2025 |
10.2 Kenya Lithographic Printing Chemicals Market Competitive Benchmarking, By Operating and Technical Parameters |
11 Company Profiles |
12 Recommendations |
13 Disclaimer |
Global Go To Market Strategy - 2030
Export potential enables firms to identify high-growth global markets with greater confidence by combining advanced trade intelligence with a structured quantitative methodology. The framework analyzes emerging demand trends and country-level import patterns while integrating macroeconomic and trade datasets such as GDP and population forecasts, bilateral import–export flows, tariff structures, elasticity differentials between developed and developing economies, geographic distance, and import demand projections. Using weighted trade values from 2020–2024 as the base period to project country-to-country export potential for 2030, these inputs are operationalized through calculated drivers such as gravity model parameters, tariff impact factors, and projected GDP per-capita growth. Through an analysis of hidden potentials, demand hotspots, and market conditions that are most favorable to success, this method enables firms to focus on target countries, maximize returns, and global expansion with data, backed by accuracy.
By factoring in the projected importer demand gap that is currently unmet and could be potential opportunity, it identifies the potential for the Exporter (Country) among 190 countries, against the general trade analysis, which identifies the biggest importer or exporter.
To discover high-growth global markets and optimize your business strategy:
Click Here
Pricing
- Single User License$ 1,995
- Department License$ 2,400
- Site License$ 3,120
- Global License$ 3,795

Leadership Perspectives from Industry Events
Search
Thought Leadership and Analyst Meet


Our Clients
6WResearch In News
- India Air Conditioner Market Set for Strong Rebound in 2026 After Weather-Led Correction and GST-Driven Recovery: 6Wresearch
- ADAS in India: How Automatic Emergency Braking, Blind Spot Detection & Driver Monitoring are Transforming Road Safety
- Doha a strategic location for EV manufacturing hub: IPA Qatar
- Demand for luxury TVs surging in the GCC, says Samsung
- Empowering Growth: The Thriving Journey of Bangladesh’s Cable Industry
- Demand for luxury TVs surging in the GCC, says Samsung
Latest Reports
- Nicaragua RPG Gaming Market (2026-2032)
- New Zealand RPG Gaming Market (2026-2032)
- Netherlands RPG Gaming Market (2026-2032)
- Nauru RPG Gaming Market (2026-2032)
- Namibia RPG Gaming Market (2026-2032)
- Mozambique RPG Gaming Market (2026-2032)
- Montenegro RPG Gaming Market (2026-2032)
- Mongolia RPG Gaming Market (2026-2032)
- Monaco RPG Gaming Market (2026-2032)
- Micronesia RPG Gaming Market (2026-2032)
Industry Events and Analyst Meet

EV India Expo 2026

HIMTEX 2026

India Refining Summit 2026

India EV Show 2026

EV tech India Expo 2026
Whitepaper
- Middle East & Africa Commercial Security Market Click here to view more.
- Middle East & Africa Fire Safety Systems & Equipment Market Click here to view more.
- GCC Drone Market Click here to view more.
- Middle East Lighting Fixture Market Click here to view more.
- GCC Physical & Perimeter Security Market Click here to view more.