Kenya Oleoresins Market Outlook | Industry, Companies, Revenue, Forecast, Trends, Share, Value, Growth, Analysis, COVID-19 IMPACT & Size
Market Forecast By Extraction process (Solvent extraction, Supercritical fluid extraction), By Application (Food & beverages, Pharmaceuticals & nutraceuticals, Personal care products, Feed), By Sources (Paprika, Capsicum, Seed spices, Turmeric, Ginger, Cinnamon & cassia, Herbs, Others) And Competitive Landscape
| Product Code: ETC097089 | Publication Date: Jun 2021 | Updated Date: Apr 2025 | Product Type: Report | |
| Publisher: 6Wresearch | Author: Ravi Bhandari | No. of Pages: 70 | No. of Figures: 35 | No. of Tables: 5 |
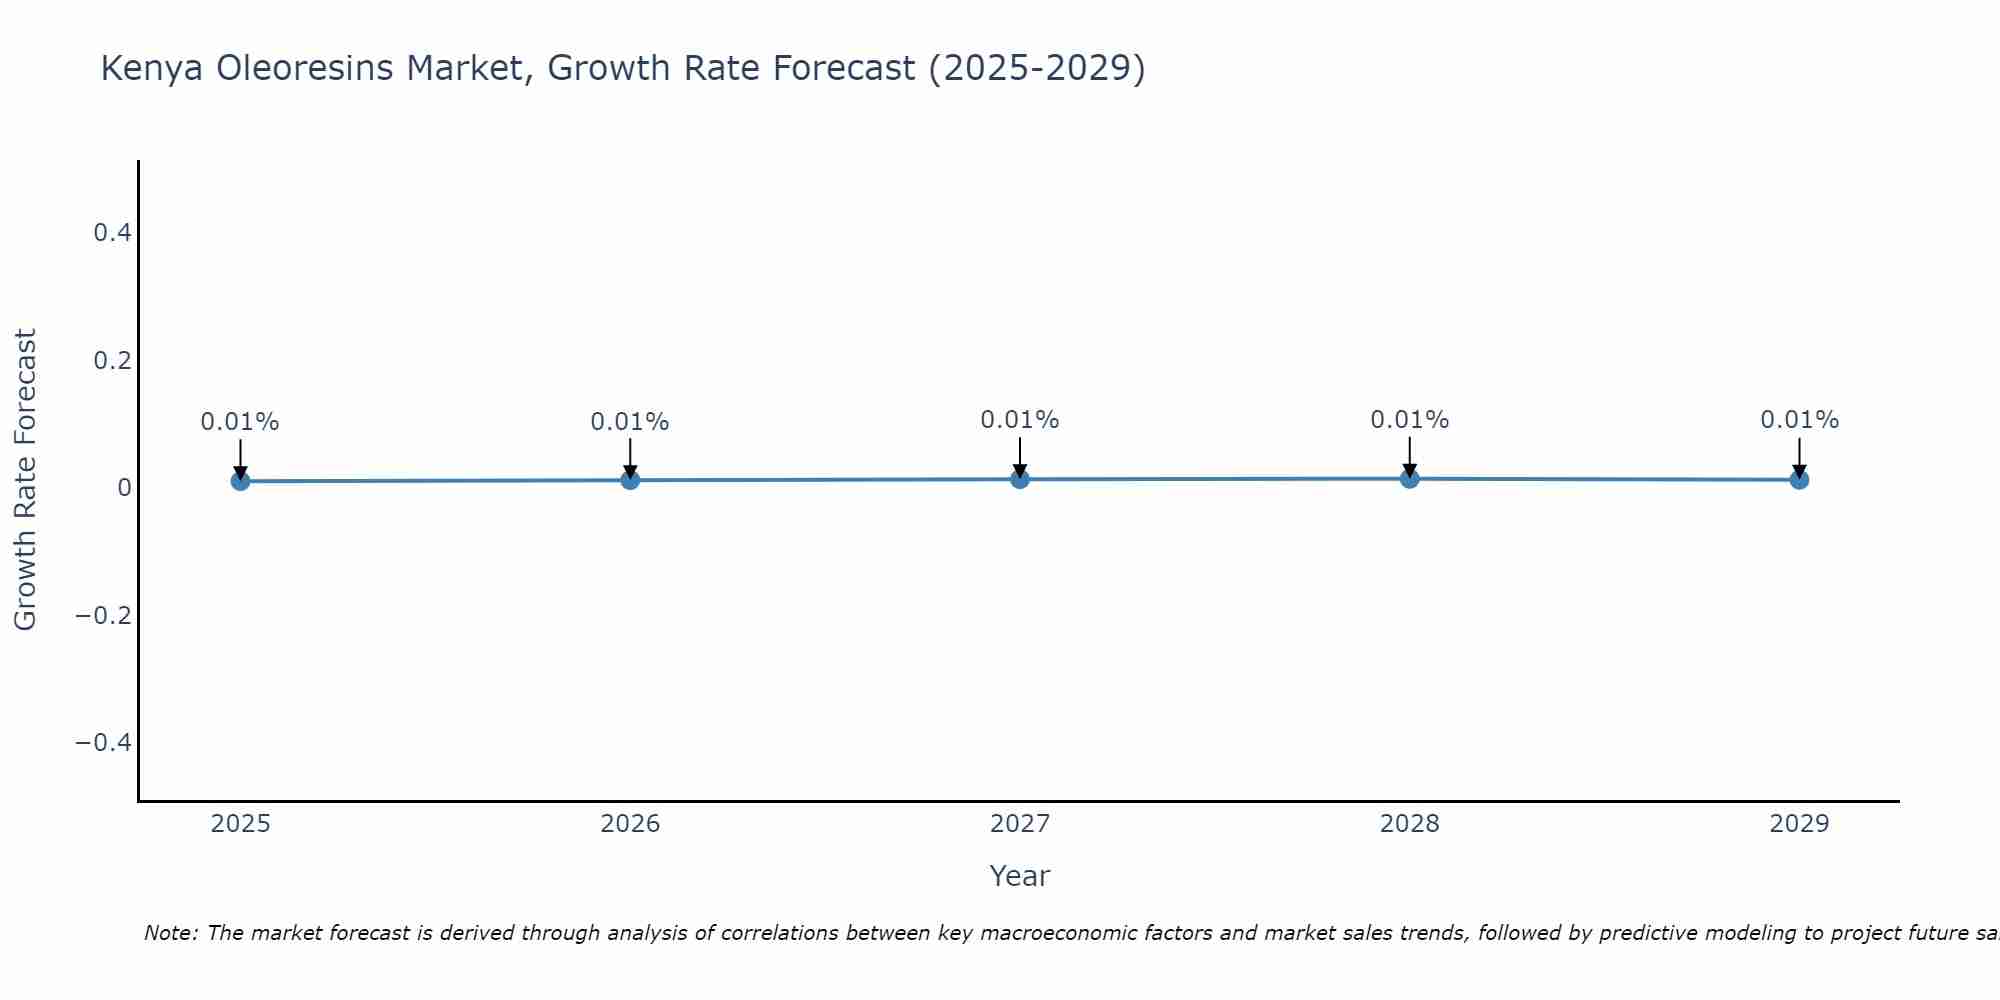
Kenya Oleoresins Market Size Growth Rate
The Kenya Oleoresins Market is projected to witness mixed growth rate patterns during 2025 to 2029. Growth accelerates to 0.01% in 2028, following an initial rate of 0.01%, before easing to 0.01% at the end of the period.
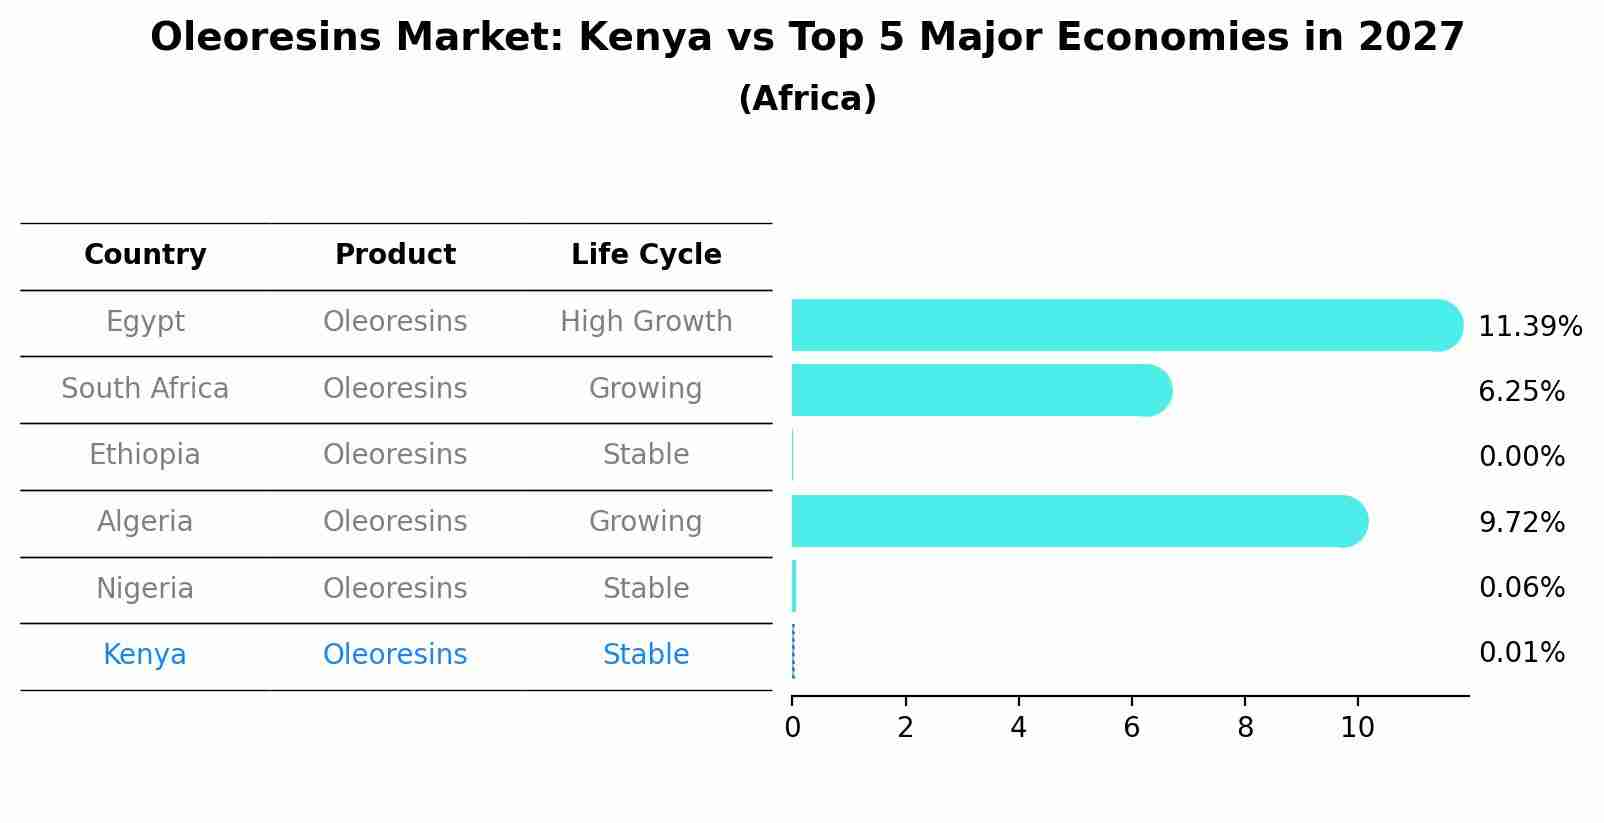
Oleoresins Market: Kenya vs Top 5 Major Economies in 2027 (Africa)
In the Africa region, the Oleoresins market in Kenya is projected to expand at a stable growth rate of 0.01% by 2027. The largest economy is Egypt, followed by South Africa, Ethiopia, Algeria and Nigeria.
Kenya Oleoresins Market Overview
Kenya oleoresins market involves the extraction and distribution of concentrated plant extracts used as flavoring and coloring agents in the food, beverage, and cosmetic industries. The market is driven by demand for natural and sustainable ingredients. Challenges include ensuring consistent quality, supply chain management, and competition from synthetic alternatives.
Drivers of the market
The oleoresins market in Kenya is influenced by the growing demand for natural flavor and fragrance ingredients in food, beverages, cosmetics, and pharmaceuticals, driven by consumer preferences for natural products, clean labeling trends, and the expansion of end-user industries.
Challenges of the market
The Kenya Oleoresins Market is faced with several challenges that impact its growth and competitiveness. One of the main challenges is the fluctuation in the availability and prices of raw materials, such as spices and herbs, which can affect the production and cost of oleoresins. Additionally, there is intense competition from international producers, which can impact the market share of local companies. The market also faces challenges related to quality control and standardization, as variations in raw materials can lead to inconsistencies in the final product. Furthermore, the regulatory environment, including stringent quality and safety standards, requires continuous monitoring and compliance efforts, which can be resource-intensive for companies.
Government Policy of the market
The oleoresins market in Kenya encounters several obstacles. One major challenge is the high cost of production and extraction of oleoresins, which can be prohibitive for many producers. There is also limited awareness and understanding of the benefits and applications of oleoresins among potential users. The market is constrained by inadequate local manufacturing capabilities and a reliance on imports. Additionally, the lack of advanced processing technologies and the need for compliance with international quality standards pose additional challenges for the oleoresins market.
Key Highlights of the Report:
- Kenya Oleoresins Market Outlook
- Market Size of Kenya Oleoresins Market, 2020
- Forecast of Kenya Oleoresins Market, 2027
- Historical Data and Forecast of Kenya Oleoresins Revenues & Volume for the Period 2018 - 2027
- Kenya Oleoresins Market Trend Evolution
- Kenya Oleoresins Market Drivers and Challenges
- Kenya Oleoresins Price Trends
- Kenya Oleoresins Porter's Five Forces
- Kenya Oleoresins Industry Life Cycle
- Historical Data and Forecast of Kenya Oleoresins Market Revenues & Volume By Extraction process for the Period 2018 - 2027
- Historical Data and Forecast of Kenya Oleoresins Market Revenues & Volume By Solvent extraction for the Period 2018 - 2027
- Historical Data and Forecast of Kenya Oleoresins Market Revenues & Volume By Supercritical fluid extraction for the Period 2018 - 2027
- Historical Data and Forecast of Kenya Oleoresins Market Revenues & Volume By Application for the Period 2018 - 2027
- Historical Data and Forecast of Kenya Oleoresins Market Revenues & Volume By Food & beverages for the Period 2018 - 2027
- Historical Data and Forecast of Kenya Oleoresins Market Revenues & Volume By Pharmaceuticals & nutraceuticals for the Period 2018 - 2027
- Historical Data and Forecast of Kenya Oleoresins Market Revenues & Volume By Personal care products for the Period 2018 - 2027
- Historical Data and Forecast of Kenya Oleoresins Market Revenues & Volume By Feed for the Period 2018 - 2027
- Historical Data and Forecast of Kenya Oleoresins Market Revenues & Volume By Sources for the Period 2018 - 2027
- Historical Data and Forecast of Kenya Oleoresins Market Revenues & Volume By Paprika for the Period 2018 - 2027
- Historical Data and Forecast of Kenya Oleoresins Market Revenues & Volume By Capsicum for the Period 2018 - 2027
- Historical Data and Forecast of Kenya Oleoresins Market Revenues & Volume By Seed spices for the Period 2018 - 2027
- Historical Data and Forecast of Kenya Oleoresins Market Revenues & Volume By Turmeric for the Period 2018 - 2027
- Historical Data and Forecast of Kenya Oleoresins Market Revenues & Volume By Ginger for the Period 2018 - 2027
- Historical Data and Forecast of Kenya Oleoresins Market Revenues & Volume By Cinnamon & cassia for the Period 2018 - 2027
- Historical Data and Forecast of Kenya Oleoresins Market Revenues & Volume By Herbs for the Period 2018 - 2027
- Historical Data and Forecast of Kenya Oleoresins Market Revenues & Volume By Others for the Period 2018 - 2027
- Kenya Oleoresins Import Export Trade Statistics
- Market Opportunity Assessment By Extraction process
- Market Opportunity Assessment By Application
- Market Opportunity Assessment By Sources
- Kenya Oleoresins Top Companies Market Share
- Kenya Oleoresins Competitive Benchmarking By Technical and Operational Parameters
- Kenya Oleoresins Company Profiles
- Kenya Oleoresins Key Strategic Recommendations
Frequently Asked Questions About the Market Study (FAQs):
6Wresearch actively monitors the Kenya Oleoresins Market and publishes its comprehensive annual report, highlighting emerging trends, growth drivers, revenue analysis, and forecast outlook. Our insights help businesses to make data-backed strategic decisions with ongoing market dynamics. Our analysts track relevent industries related to the Kenya Oleoresins Market, allowing our clients with actionable intelligence and reliable forecasts tailored to emerging regional needs.
Yes, we provide customisation as per your requirements. To learn more, feel free to contact us on sales@6wresearch.com
1 Executive Summary |
2 Introduction |
2.1 Key Highlights of the Report |
2.2 Report Description |
2.3 Market Scope & Segmentation |
2.4 Research Methodology |
2.5 Assumptions |
3 Kenya Oleoresins Market Overview |
3.1 Kenya Country Macro Economic Indicators |
3.2 Kenya Oleoresins Market Revenues & Volume, 2020 & 2027F |
3.3 Kenya Oleoresins Market - Industry Life Cycle |
3.4 Kenya Oleoresins Market - Porter's Five Forces |
3.5 Kenya Oleoresins Market Revenues & Volume Share, By Extraction process, 2020 & 2027F |
3.6 Kenya Oleoresins Market Revenues & Volume Share, By Application, 2020 & 2027F |
3.7 Kenya Oleoresins Market Revenues & Volume Share, By Sources, 2020 & 2027F |
4 Kenya Oleoresins Market Dynamics |
4.1 Impact Analysis |
4.2 Market Drivers |
4.3 Market Restraints |
5 Kenya Oleoresins Market Trends |
6 Kenya Oleoresins Market, By Types |
6.1 Kenya Oleoresins Market, By Extraction process |
6.1.1 Overview and Analysis |
6.1.2 Kenya Oleoresins Market Revenues & Volume, By Extraction process, 2018 - 2027F |
6.1.3 Kenya Oleoresins Market Revenues & Volume, By Solvent extraction, 2018 - 2027F |
6.1.4 Kenya Oleoresins Market Revenues & Volume, By Supercritical fluid extraction, 2018 - 2027F |
6.2 Kenya Oleoresins Market, By Application |
6.2.1 Overview and Analysis |
6.2.2 Kenya Oleoresins Market Revenues & Volume, By Food & beverages, 2018 - 2027F |
6.2.3 Kenya Oleoresins Market Revenues & Volume, By Pharmaceuticals & nutraceuticals, 2018 - 2027F |
6.2.4 Kenya Oleoresins Market Revenues & Volume, By Personal care products, 2018 - 2027F |
6.2.5 Kenya Oleoresins Market Revenues & Volume, By Feed, 2018 - 2027F |
6.3 Kenya Oleoresins Market, By Sources |
6.3.1 Overview and Analysis |
6.3.2 Kenya Oleoresins Market Revenues & Volume, By Paprika, 2018 - 2027F |
6.3.3 Kenya Oleoresins Market Revenues & Volume, By Capsicum, 2018 - 2027F |
6.3.4 Kenya Oleoresins Market Revenues & Volume, By Seed spices, 2018 - 2027F |
6.3.5 Kenya Oleoresins Market Revenues & Volume, By Turmeric, 2018 - 2027F |
6.3.6 Kenya Oleoresins Market Revenues & Volume, By Ginger, 2018 - 2027F |
6.3.7 Kenya Oleoresins Market Revenues & Volume, By Cinnamon & cassia, 2018 - 2027F |
6.3.8 Kenya Oleoresins Market Revenues & Volume, By Others, 2018 - 2027F |
6.3.9 Kenya Oleoresins Market Revenues & Volume, By Others, 2018 - 2027F |
7 Kenya Oleoresins Market Import-Export Trade Statistics |
7.1 Kenya Oleoresins Market Export to Major Countries |
7.2 Kenya Oleoresins Market Imports from Major Countries |
8 Kenya Oleoresins Market Key Performance Indicators |
9 Kenya Oleoresins Market - Opportunity Assessment |
9.1 Kenya Oleoresins Market Opportunity Assessment, By Extraction process, 2020 & 2027F |
9.2 Kenya Oleoresins Market Opportunity Assessment, By Application, 2020 & 2027F |
9.3 Kenya Oleoresins Market Opportunity Assessment, By Sources, 2020 & 2027F |
10 Kenya Oleoresins Market - Competitive Landscape |
10.1 Kenya Oleoresins Market Revenue Share, By Companies, 2020 |
10.2 Kenya Oleoresins Market Competitive Benchmarking, By Operating and Technical Parameters |
11 Company Profiles |
12 Recommendations |
13 Disclaimer |
Export potential assessment - trade Analytics for 2030
Export potential enables firms to identify high-growth global markets with greater confidence by combining advanced trade intelligence with a structured quantitative methodology. The framework analyzes emerging demand trends and country-level import patterns while integrating macroeconomic and trade datasets such as GDP and population forecasts, bilateral import–export flows, tariff structures, elasticity differentials between developed and developing economies, geographic distance, and import demand projections. Using weighted trade values from 2020–2024 as the base period to project country-to-country export potential for 2030, these inputs are operationalized through calculated drivers such as gravity model parameters, tariff impact factors, and projected GDP per-capita growth. Through an analysis of hidden potentials, demand hotspots, and market conditions that are most favorable to success, this method enables firms to focus on target countries, maximize returns, and global expansion with data, backed by accuracy.
By factoring in the projected importer demand gap that is currently unmet and could be potential opportunity, it identifies the potential for the Exporter (Country) among 190 countries, against the general trade analysis, which identifies the biggest importer or exporter.
To discover high-growth global markets and optimize your business strategy:
Click Here
Pricing
- Single User License$ 1,995
- Department License$ 2,400
- Site License$ 3,120
- Global License$ 3,795

Thought Leadership
Search
Thought Leadership and Analyst Meet


Our Clients
Latest Reports
- New Zealand Aseptic Manufacturing Market (2026-2032)
- Netherlands Aseptic Manufacturing Market (2026-2032)
- Nauru Aseptic Manufacturing Market (2026-2032)
- Namibia Aseptic Manufacturing Market (2026-2032)
- Mozambique Aseptic Manufacturing Market (2026-2032)
- Montenegro Aseptic Manufacturing Market (2026-2032)
- Mongolia Aseptic Manufacturing Market (2026-2032)
- Monaco Aseptic Manufacturing Market (2026-2032)
- Micronesia Aseptic Manufacturing Market (2026-2032)
- Mauritius Aseptic Manufacturing Market (2026-2032)
Industry Events and Analyst Meet

HIMTEX 2026

India Refining Summit 2026

India EV Show 2026

EV tech India Expo 2026

Auto Tech Asia 2026
Whitepaper
- Middle East & Africa Commercial Security Market Click here to view more.
- Middle East & Africa Fire Safety Systems & Equipment Market Click here to view more.
- GCC Drone Market Click here to view more.
- Middle East Lighting Fixture Market Click here to view more.
- GCC Physical & Perimeter Security Market Click here to view more.
6WResearch In News
- Doha a strategic location for EV manufacturing hub: IPA Qatar
- Demand for luxury TVs surging in the GCC, says Samsung
- Empowering Growth: The Thriving Journey of Bangladesh’s Cable Industry
- Demand for luxury TVs surging in the GCC, says Samsung
- Video call with a traditional healer? Once unthinkable, it’s now common in South Africa
- Intelligent Buildings To Smooth GCC’s Path To Net Zero