Kenya Sand & Gravel Market (2026-2032) Outlook | Share, Trends, Size, Value, Growth, Companies, Analysis, Forecast, Revenue, Industry
Market Forecast By Product Type (Coarse Crushed Limestone Gravel, Pit Or Coarse Sand, Crushed Clean Stone, Fine Limestone Gravel, River Sand), By End Users (Glass, Road Construction, Mining, Foundry, Others) And Competitive Landscape
| Product Code: ETC304550 | Publication Date: Aug 2022 | Updated Date: Jul 2026 | Product Type: Market Research Report | |
| Publisher: 6Wresearch | Author: Dhaval Chaurasia | No. of Pages: 75 | No. of Figures: 35 | No. of Tables: 20 |
Kenya Sand & Gravel Market Size, Share & Growth Rate
The Kenya Sand & Gravel Market was estimated at USD 185 Million in 2025 and is projected to reach USD 260 Million by 2032, growing at a CAGR of 5.0% from 2026 to 2032. This growth trajectory is bolstered by an array of ongoing construction initiatives, underscored by substantial investments in infrastructure. As urbanization accelerates, the increasing demand for housing, roads, and commercial buildings positions the sand and gravel market as a pivotal component of Kenya's economic development.
Kenya Sand & Gravel Market Year-wise Growth Rate and Key Drivers
This graph highlights how the Kenya Sand & Gravel Market has steadily grown over the years, supported by major growth factors.
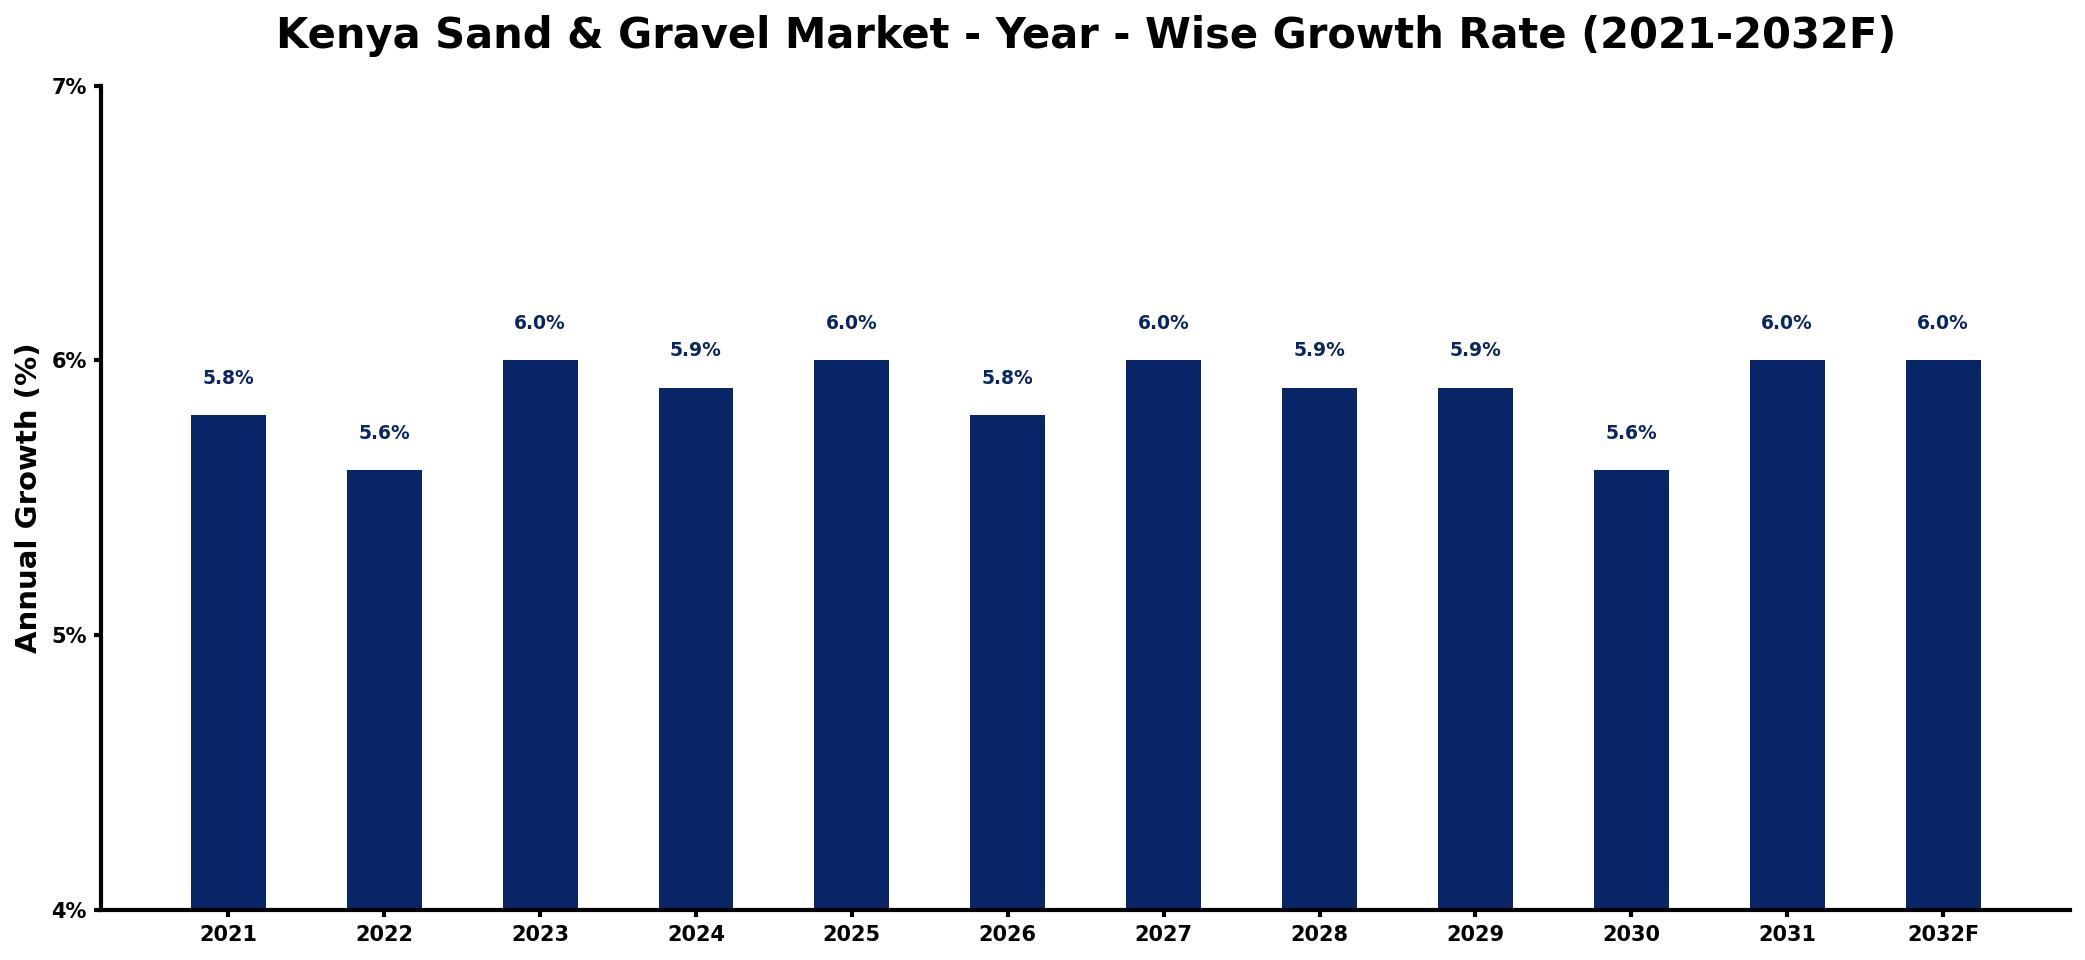
The table below presents the year‑wise growth rates along with the key drivers influencing the market
| Year | Growth Rate | Major Drivers |
| 2021 | 5.8% | Infrastructure projects driving demand |
| 2022 | 5.6% | Increased construction activities nationwide |
| 2023 | 6.0% | Rising urbanization boosting consumption |
| 2024 | 5.9% | Government investments in housing |
| 2025 | 6.0% | Growing renewable energy projects |
| 2026 | 5.8% | Expansion of transportation networks |
| 2027 | 6.0% | Increased foreign direct investments |
| 2028 | 5.9% | increased production capacity utilization |
| 2029 | 5.9% | Rising residential developments ongoing |
| 2030 | 5.6% | Demand from mining sector stabilizing |
| 2031 | 6.0% | Sustainable construction materials adoption |
| 2032 | 6.0% | Technological advancements in construction |
Note: Market size estimations and growth projections presented in this report are based on 6Wresearch's proprietary forecasting methodology, utilizing the latest available industry data, government publications, and primary research inputs.
Kenya Sand & Gravel Market Synopsis
The Kenya Sand & Gravel market has witnessed significant momentum due to a surge in construction activities driven by infrastructure development projects. This upward trend indicates a robust future, where the market is set to expand further, fueled by a rising population and urbanization trends. As the construction sector flourishes, the role of sand and gravel as essential materials remains crucial.
Contrasting with past challenges, recent advancements in sustainable practices and regulatory frameworks are gradually reshaping the landscape of the sand and gravel market. Local suppliers, capitalizing on competitive pricing and proximity to project sites, play a dominant role, while international players remain active, contributing to a diverse supply chain.
- Robust growth driven by substantial infrastructure development and a booming construction sector.
- Market expected to evolve with increased adoption of sustainable sourcing and eco-friendly materials.
- Technological advancements are enhancing extraction efficiency and quality in the sand and gravel market.
- Regulatory frameworks are being strengthened to address environmental concerns surrounding sand harvesting.
- Local suppliers dominate the market landscape due to their competitive pricing strategies.
Despite the growth potential, the Kenya Sand & Gravel market faces significant restraints that could impede progress. Environmental concerns loom large, with unsustainable extraction practices leading to soil degradation and water pollution. Furthermore, a lack of stringent regulations exacerbates the issue, allowing illegal operators to thrive, which creates instability and undermines the efforts of compliant businesses. Addressing these challenges requires a concerted effort from both industry stakeholders and government entities.
The Kenya Sand & Gravel market is shaped by several current and emerging trends. The push for sustainable construction is influencing consumer preferences, with an increasing demand for eco-friendly and recycled materials. Additionally, advancements in extraction and processing technologies are being implemented to enhance operational efficiency. Urbanization continues to drive the demand for various construction materials, solidifying sand and gravel's place as indispensable commodities in Kenya's development landscape.
Investment opportunities in the Kenya Sand & Gravel market are abundant. Companies can explore avenues such as establishing distribution networks to efficiently supply construction companies, or investing in machinery that improves extraction and processing capabilities. There is also potential for vertical integration through investments in concrete production or real estate projects that necessitate a consistent supply of quality sand and gravel. As the country's infrastructure development remains a priority, these ventures present lucrative prospects for stakeholders.
The Kenyan government has instituted various policies to govern the sand and gravel market, notably through the Mining Act of 2016, which mandates licensing for extraction activities. Additionally, the Environmental Management and Coordination Act of 1999 emphasizes the necessity for environmental impact assessments to ensure responsible practices. By establishing the National Environment Management Authority (NEMA), the government seeks to ensure compliance with these regulations, promoting sustainable extraction and environmental conservation.
Looking ahead to 2026-2032, the Kenya Sand & Gravel market is poised for sustained growth, propelled by ongoing urbanization and a commitment to infrastructure enhancement. As the government prioritizes affordable housing and transportation initiatives, the demand for sand and gravel will remain strong. Although environmental regulations and challenges associated with illegal extraction must be addressed, the overall outlook remains positive for stakeholders in this vital sector.
In the latest industry developments, several initiatives have emerged aimed at promoting sustainable extraction practices within the sand and gravel sector. Increased collaboration between governmental bodies and industry stakeholders is being observed, focusing on compliance with environmental regulations. Technological innovations in extraction processes are also becoming more prevalent, enhancing the efficiency and quality of sand and gravel production. These trends signal a commitment to responsible practices while meeting the growing demand in the construction sector.
- 10 Years of Market Numbers
- Historical Data Starting from 2022 to 2025
- Base Year: 2025
- Forecast Data until 2032
- Key Performance Indicators Impacting the Market
- Major Upcoming Developments and Projects
Key Highlights of the Report:
- Kenya Sand & Gravel Market Outlook
- Market Size of Kenya Sand & Gravel Market, 2025
- Forecast of Kenya Sand & Gravel Market, 2032
- Historical Data and Forecast of Kenya Sand & Gravel Revenues & Volume for the Period 2022-2032F
- Kenya Sand & Gravel Market Trend Evolution
- Kenya Sand & Gravel Market Drivers and Challenges
- Kenya Sand & Gravel Price Trends
- Kenya Sand & Gravel Porter's Five Forces
- Kenya Sand & Gravel Industry Life Cycle
- Historical Data and Forecast of Kenya Sand & Gravel Market Revenues & Volume By Product Type for the Period 2022-2032F
- Historical Data and Forecast of Kenya Sand & Gravel Market Revenues & Volume By Coarse Crushed Limestone Gravel for the Period 2022-2032F
- Historical Data and Forecast of Kenya Sand & Gravel Market Revenues & Volume By Pit Or Coarse Sand for the Period 2022-2032F
- Historical Data and Forecast of Kenya Sand & Gravel Market Revenues & Volume By Crushed Clean Stone for the Period 2022-2032F
- Historical Data and Forecast of Kenya Sand & Gravel Market Revenues & Volume By Fine Limestone Gravel for the Period 2022-2032F
- Historical Data and Forecast of Kenya Sand & Gravel Market Revenues & Volume By River Sand for the Period 2022-2032F
- Historical Data and Forecast of Kenya Sand & Gravel Market Revenues & Volume By End Users for the Period 2022-2032F
- Historical Data and Forecast of Kenya Sand & Gravel Market Revenues & Volume By Glass for the Period 2022-2032F
- Historical Data and Forecast of Kenya Sand & Gravel Market Revenues & Volume By Road Construction for the Period 2022-2032F
- Historical Data and Forecast of Kenya Sand & Gravel Market Revenues & Volume By Mining for the Period 2022-2032F
- Historical Data and Forecast of Kenya Sand & Gravel Market Revenues & Volume By Foundry for the Period 2022-2032F
- Historical Data and Forecast of Kenya Sand & Gravel Market Revenues & Volume By Others for the Period 2022-2032F
- Kenya Sand & Gravel Import Export Trade Statistics
- Market Opportunity Assessment By Product Type
- Market Opportunity Assessment By End Users
- Kenya Sand & Gravel Top Companies Market Share
- Kenya Sand & Gravel Competitive Benchmarking By Technical and Operational Parameters
- Kenya Sand & Gravel Company Profiles
- Kenya Sand & Gravel Key Strategic Recommendations
Frequently Asked Questions About the Market Study (FAQs):
The growth is largely driven by an increase in infrastructure projects, a rising population, and urbanization trends that necessitate more construction materials.
The market is projected to grow from USD 185 Million in 2025 to USD 260 Million by 2032, at a CAGR of 5.0% from 2026 to 2032, primarily due to ongoing construction activities and infrastructure development initiatives.
Local suppliers are crucial in the Kenya Sand & Gravel market, dominating due to their competitive pricing and proximity to construction sites, which enhances their ability to meet demand effectively.
Emerging trends include a shift towards sustainable construction materials, advancements in extraction technologies, and a greater emphasis on compliance with environmental regulations.
Government policies, such as the Mining Act of 2016 and environmental regulations, are designed to ensure responsible extraction practices and promote environmental sustainability, which significantly affects market operations.
6Wresearch actively monitors the Kenya Sand & Gravel Market and publishes its comprehensive annual report, highlighting emerging trends, growth drivers, revenue analysis, and forecast outlook. Our insights help businesses to make data-backed strategic decisions with ongoing market dynamics. Our analysts track relevent industries related to the Kenya Sand & Gravel Market, allowing our clients with actionable intelligence and reliable forecasts tailored to emerging regional needs.
Yes, we provide customisation as per your requirements. To learn more, feel free to contact us on sales@6wresearch.com
1 Executive Summary |
2 Introduction |
2.1 Key Highlights of the Report |
2.2 Report Description |
2.3 Market Scope & Segmentation |
2.4 Research Methodology |
2.5 Assumptions |
3 Kenya Sand & Gravel Market Overview |
3.1 Kenya Country Macro Economic Indicators |
3.2 Kenya Sand & Gravel Market Revenues & Volume, 2022 & 2032F |
3.3 Kenya Sand & Gravel Market - Industry Life Cycle |
3.4 Kenya Sand & Gravel Market - Porter's Five Forces |
3.5 Kenya Sand & Gravel Market Revenues & Volume Share, By Product Type, 2022 & 2032F |
3.6 Kenya Sand & Gravel Market Revenues & Volume Share, By End Users, 2022 & 2032F |
4 Kenya Sand & Gravel Market Dynamics |
4.1 Impact Analysis |
4.2 Market Drivers |
4.2.1 Rapid urbanization and infrastructure development projects in Kenya driving demand for sand and gravel. |
4.2.2 Growth in the construction industry, particularly in residential, commercial, and industrial sectors. |
4.2.3 Increasing government investment in public infrastructure projects such as roads, bridges, and dams. |
4.3 Market Restraints |
4.3.1 Environmental regulations and sustainability concerns impacting extraction and supply of sand and gravel. |
4.3.2 Fluctuating prices of raw materials and transportation costs affecting profitability. |
4.3.3 Competition from alternative materials like recycled aggregates or artificial sand. |
5 Kenya Sand & Gravel Market Trends |
6 Kenya Sand & Gravel Market, By Types |
6.1 Kenya Sand & Gravel Market, By Product Type |
6.1.1 Overview and Analysis |
6.1.2 Kenya Sand & Gravel Market Revenues & Volume, By Product Type, 2022-2032F |
6.1.3 Kenya Sand & Gravel Market Revenues & Volume, By Coarse Crushed Limestone Gravel, 2022-2032F |
6.1.4 Kenya Sand & Gravel Market Revenues & Volume, By Pit Or Coarse Sand, 2022-2032F |
6.1.5 Kenya Sand & Gravel Market Revenues & Volume, By Crushed Clean Stone, 2022-2032F |
6.1.6 Kenya Sand & Gravel Market Revenues & Volume, By Fine Limestone Gravel, 2022-2032F |
6.1.7 Kenya Sand & Gravel Market Revenues & Volume, By River Sand, 2022-2032F |
6.2 Kenya Sand & Gravel Market, By End Users |
6.2.1 Overview and Analysis |
6.2.2 Kenya Sand & Gravel Market Revenues & Volume, By Glass, 2022-2032F |
6.2.3 Kenya Sand & Gravel Market Revenues & Volume, By Road Construction, 2022-2032F |
6.2.4 Kenya Sand & Gravel Market Revenues & Volume, By Mining, 2022-2032F |
6.2.5 Kenya Sand & Gravel Market Revenues & Volume, By Foundry, 2022-2032F |
6.2.6 Kenya Sand & Gravel Market Revenues & Volume, By Others, 2022-2032F |
7 Kenya Sand & Gravel Market Import-Export Trade Statistics |
7.1 Kenya Sand & Gravel Market Export to Major Countries |
7.2 Kenya Sand & Gravel Market Imports from Major Countries |
8 Kenya Sand & Gravel Market Key Performance Indicators |
8.1 Environmental impact metrics such as carbon footprint reduction initiatives and sustainable sourcing practices. |
8.2 Construction industry growth indicators like building permits issued, housing starts, and infrastructure project announcements. |
8.3 Customer satisfaction and loyalty metrics to gauge market reputation and repeat business. |
8.4 Investment in research and development for innovative extraction techniques or product diversification. |
9 Kenya Sand & Gravel Market - Opportunity Assessment |
9.1 Kenya Sand & Gravel Market Opportunity Assessment, By Product Type, 2022 & 2032F |
9.2 Kenya Sand & Gravel Market Opportunity Assessment, By End Users, 2022 & 2032F |
10 Kenya Sand & Gravel Market - Competitive Landscape |
10.1 Kenya Sand & Gravel Market Revenue Share, By Companies, 2025 |
10.2 Kenya Sand & Gravel Market Competitive Benchmarking, By Operating and Technical Parameters |
11 Company Profiles |
12 Recommendations |
13 Disclaimer |
Global Go To Market Strategy - 2030
Export potential enables firms to identify high-growth global markets with greater confidence by combining advanced trade intelligence with a structured quantitative methodology. The framework analyzes emerging demand trends and country-level import patterns while integrating macroeconomic and trade datasets such as GDP and population forecasts, bilateral import–export flows, tariff structures, elasticity differentials between developed and developing economies, geographic distance, and import demand projections. Using weighted trade values from 2020–2024 as the base period to project country-to-country export potential for 2030, these inputs are operationalized through calculated drivers such as gravity model parameters, tariff impact factors, and projected GDP per-capita growth. Through an analysis of hidden potentials, demand hotspots, and market conditions that are most favorable to success, this method enables firms to focus on target countries, maximize returns, and global expansion with data, backed by accuracy.
By factoring in the projected importer demand gap that is currently unmet and could be potential opportunity, it identifies the potential for the Exporter (Country) among 190 countries, against the general trade analysis, which identifies the biggest importer or exporter.
To discover high-growth global markets and optimize your business strategy:
Click Here
Pricing
- Single User License$ 1,995
- Department License$ 2,400
- Site License$ 3,120
- Global License$ 3,795

Leadership Perspectives from Industry Events
Search
Thought Leadership and Analyst Meet


Our Clients
6WResearch In News
- India Air Conditioner Market Set for Strong Rebound in 2026 After Weather-Led Correction and GST-Driven Recovery: 6Wresearch
- ADAS in India: How Automatic Emergency Braking, Blind Spot Detection & Driver Monitoring are Transforming Road Safety
- Doha a strategic location for EV manufacturing hub: IPA Qatar
- Demand for luxury TVs surging in the GCC, says Samsung
- Empowering Growth: The Thriving Journey of Bangladesh’s Cable Industry
- Demand for luxury TVs surging in the GCC, says Samsung
Latest Reports
- Nicaragua RPG Gaming Market (2026-2032)
- New Zealand RPG Gaming Market (2026-2032)
- Netherlands RPG Gaming Market (2026-2032)
- Nauru RPG Gaming Market (2026-2032)
- Namibia RPG Gaming Market (2026-2032)
- Mozambique RPG Gaming Market (2026-2032)
- Montenegro RPG Gaming Market (2026-2032)
- Mongolia RPG Gaming Market (2026-2032)
- Monaco RPG Gaming Market (2026-2032)
- Micronesia RPG Gaming Market (2026-2032)
Industry Events and Analyst Meet

EV India Expo 2026

HIMTEX 2026

India Refining Summit 2026

India EV Show 2026

EV tech India Expo 2026
Whitepaper
- Middle East & Africa Commercial Security Market Click here to view more.
- Middle East & Africa Fire Safety Systems & Equipment Market Click here to view more.
- GCC Drone Market Click here to view more.
- Middle East Lighting Fixture Market Click here to view more.
- GCC Physical & Perimeter Security Market Click here to view more.