Kenya Silicon Alloys Market (2026-2032) Outlook | Analysis, Industry, Size, Forecast, Share, Growth, Companies, Trends, Revenue & Value
Market Forecast By Type (Ferrosilicon, Deoxidizers, Inoculants, Others), By Application (Carbon Steel & Other Alloy Steel, Stainless Steel, Electrical Steel, Cast Iron, Others) And Competitive Landscape
| Product Code: ETC102789 | Publication Date: Jun 2021 | Updated Date: Jun 2026 | Product Type: Report | |
| Publisher: 6Wresearch | Author: Vasudha | No. of Pages: 70 | No. of Figures: 35 | No. of Tables: 5 |
Kenya Silicon Alloys Market Size, Share & Growth Rate
The Kenya Silicon Alloys Market was estimated at USD 232 Million in 2025 and is projected to reach USD 326 Million by 2032, growing at a CAGR of 5.0% from 2026 to 2032. This growth trajectory is primarily fueled by the country’s burgeoning industrial sector, which is witnessing increased demand for silicon alloys across automotive, electronics, and construction applications. Coupled with the government’s push towards infrastructure development and renewable energy, particularly solar power, these factors significantly bolster the market's expansion.
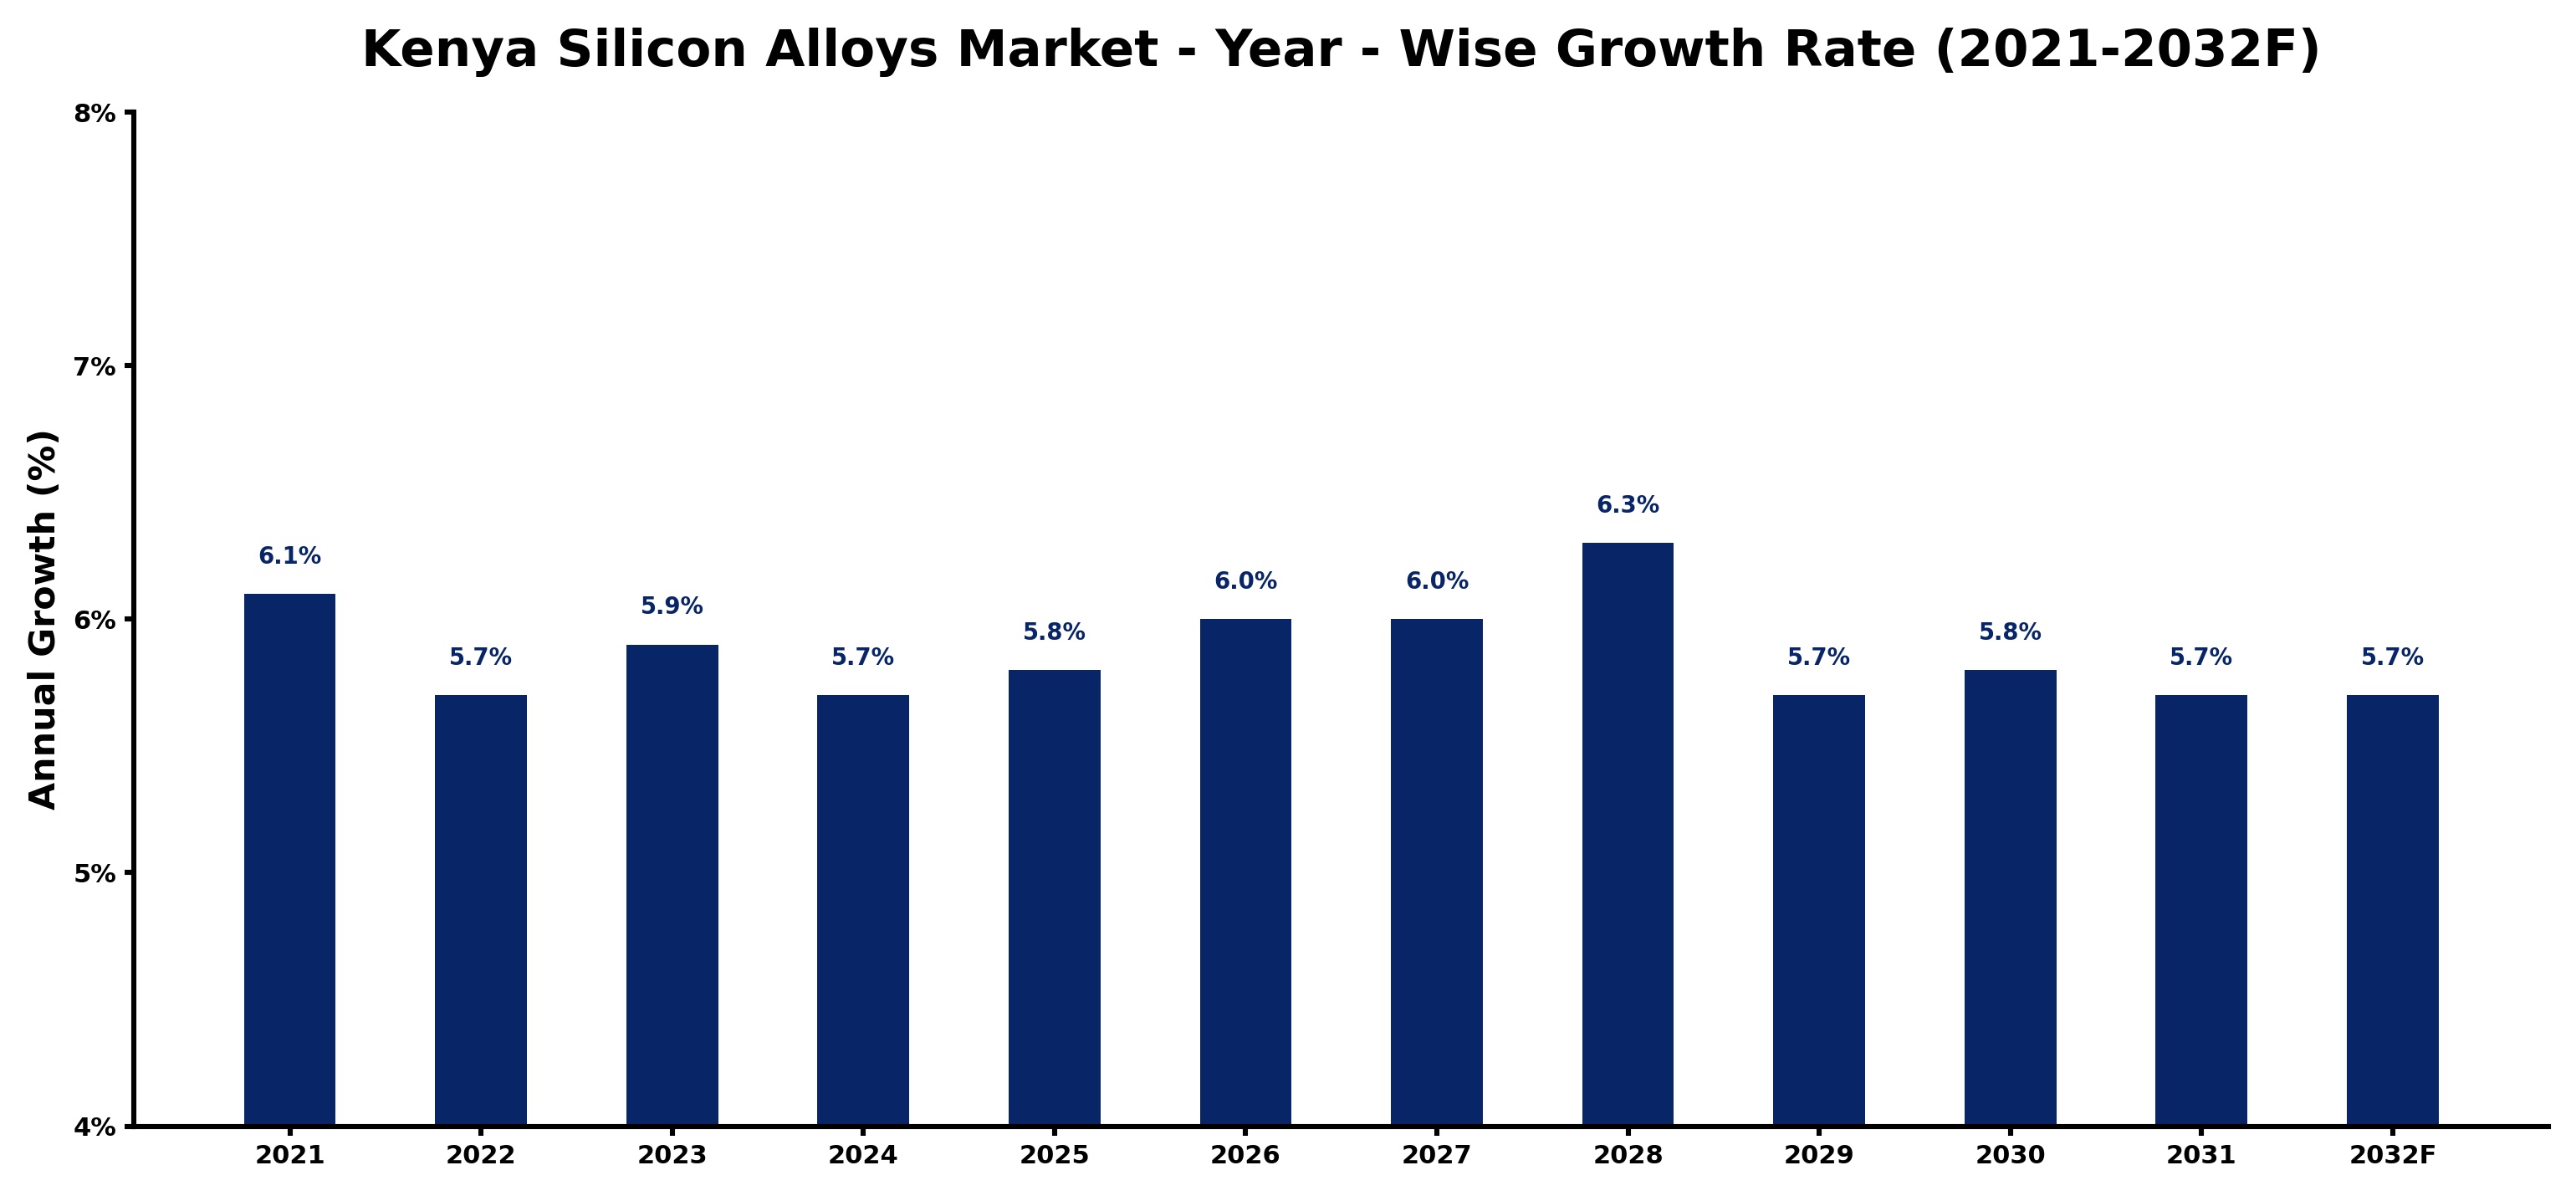
Kenya Silicon Alloys Market Growth Rate Analysis (2021-2032)
The Kenya Silicon Alloys market has exhibited stable growth, marked by a yearly increase ranging from 5.7% to 6.3% between 2021 and 2032. In 2021, the market experienced a robust growth of 6.1%, fueled primarily by rising demand from the country's steel and aluminum industries. The following years saw slight fluctuations, with 2022 at 5.7% and a rebound to 5.9% in 2023, reflecting ongoing investments in industrial infrastructure and a growing emphasis on energy transition initiatives. Factors such as improvements in mining efficiency and increased consumer demand for advanced materials have consistently supported growth, culminating in a steady 6.0% forecast in 2026 and 2027, before stabilizing again around 5.7% in later years.
Kenya Silicon Alloys Market Year-wise Growth Rate and Key Drivers
This graph highlights how the Kenya Silicon Alloys Market has steadily grown over the past five years, supported by major growth factors.
The table below presents the year‑wise growth rates along with the key drivers influencing the market
| Year | Growth Rate | Major Drivers |
| 2021 | 6.1% | New silicon alloy production facilities boost local manufacturing capabilities |
| 2022 | 5.7% | Expanded power supply reliability boosts silicon alloy production capacity |
| 2023 | 5.9% | Investment in renewable energy boosts silicon alloy demand for batteries |
| 2024 | 5.7% | New smelting plant constructions boost silicon alloy supply capacity |
| 2025 | 5.8% | Technology integration in smelting processes enhanced alloy production efficiency |
| 2026 | 6.0% | New smelting technologies boost silicon alloy production efficiency |
| 2027 | 6.0% | Increased mining activities drive silicon metal supply chain growth |
| 2028 | 6.3% | Export driven silicon alloy production boosts domestic electric vehicle components supply |
| 2029 | 5.7% | New manufacturing plants boost local silicon alloy production capacity |
| 2030 | 5.8% | Capacity upgrades at local smelters boosted silicon alloy output |
| 2031 | 5.7% | Local steel producers expand capacity to meet rising alloy demand |
| 2032 | 5.7% | Renewable energy investments boost silicon alloy production capacity in Kenya |
Note - Market size estimations and growth projections presented in this report are based on 6Wresearch’s advanced forecasting approach, validated with industry datasets as of June 2026.
Kenya Silicon Alloys Market Synopsis
The most compelling force driving the Kenya Silicon Alloys Market is the rapid industrialization that the country is experiencing. As industries expand, the need for materials that offer strength and durability, particularly in construction and automotive applications, has surged, creating a robust demand for silicon alloys.
Additionally, an increasing shift toward sustainable production methods is reshaping the market landscape. The focus on cleaner technologies in the manufacturing process is not only enhancing product quality but also opening avenues for innovation, further solidifying Kenya’s position in the global silicon alloys market.
Kenya Silicon Alloys Market Key Takeaways
- The market is projected to grow significantly, reaching USD 326 Million by 2032.
- Industrial expansion and infrastructural development are primary drivers of demand.
- A focus on renewable energy, especially solar, is creating new applications for silicon alloys.
- Investment in cleaner technologies is becoming a norm among manufacturers.
- Government initiatives are providing critical support through tax incentives and industrial parks.
Evaluation of Restraints in Kenya Silicon Alloys Market
Despite the promising outlook, several factors pose real challenges to the Kenya Silicon Alloys Market. Fluctuating global demand for silicon alloys can create pricing volatility, impacting the stability of local producers. Additionally, competition from international suppliers complicates market dynamics, while inconsistent government regulations regarding mining and exports can create uncertainty. The existing infrastructural limitations, particularly in transportation and energy supply, also pose significant barriers, hindering efficient production and distribution efforts in this growing market.
Kenya Silicon Alloys Market Trends
A notable trend in the Kenya Silicon Alloys Market is the increasing integration of advanced technologies in production processes. Manufacturers are investing significantly in research and development to create innovative alloys tailored to specific industrial applications. Furthermore, there's a growing preference for environmentally friendly practices, leading to investments in cleaner production technologies that minimize waste and emissions.
Strategic partnerships among local and international players are also emerging as a common trend, as companies seek to enhance their market presence and leverage each other's expertise. This collaborative approach is expected to drive innovation and expand the scope of applications for silicon alloys across various sectors.
Kenya Silicon Alloys Market Opportunities
The Kenya Silicon Alloys Market offers numerous investment opportunities, particularly as the demand for steel production escalates alongside ongoing infrastructure projects. Investors may find lucrative prospects in establishing or expanding silicon alloy manufacturing facilities, or in partnering with local steel producers to ensure a consistent supply chain. With the government's emphasis on promoting local manufacturing, engaging in mining operations to secure essential raw materials also presents a promising avenue for growth. A thorough understanding of the regulatory environment will be vital for successfully capitalizing on these opportunities.
Government Initiatives in the Kenya Silicon Alloys Market
The Kenyan government is actively fostering the Silicon Alloys Market through several supportive policies and incentives aimed at boosting local production. Tax incentives such as reduced corporate tax rates and import duty exemptions for raw materials are designed to attract both local and foreign investments. Furthermore, the establishment of special economic zones and industrial parks provides manufacturers with a conducive environment for growth. Collaborative efforts with academic institutions also encourage research and development, thus driving innovation in this sector.
Future Insights of the Kenya Silicon Alloys Market
Looking ahead to the period from 2026 to 2032, the Kenya Silicon Alloys Market is positioned for continued growth. The ongoing industrialization and significant investments in infrastructure will drive the demand for silicon alloys, particularly in the construction and automotive sectors. As companies innovate and adapt to changing market needs, enhanced product quality and diversity will further solidify their competitive advantage. With increasing government support and investment, the market is likely to experience robust expansion in the years to come.
Kenya Silicon Alloys Market Latest Developments (May 2025 - June 2026)
Recent developments in the Kenya Silicon Alloys Market indicate a strong momentum in production capabilities. Manufacturers are increasingly adopting advanced technologies to enhance efficiency and reduce environmental impact. Additionally, there is a noticeable uptick in collaborations between local firms and international stakeholders, aimed at sharing expertise and resources. These trends underscore a collective effort within the industry to navigate challenges while capitalizing on growth opportunities.
Kenya Silicon Alloys Market - Key Attractiveness of the Report
- 10 Years of Market Numbers
- Historical Data Starting from 2022 to 2025
- Base Year: 2025
- Forecast Data until 2032
- Key Performance Indicators Impacting the Market
- Major Upcoming Developments and Projects
Key Highlights of the Report:
- Kenya Silicon Alloys Market Outlook
- Market Size of Kenya Silicon Alloys Market, 2025
- Forecast of Kenya Silicon Alloys Market, 2032
- Historical Data and Forecast of Kenya Silicon Alloys Revenues & Volume for the Period 2022-2032F
- Kenya Silicon Alloys Market Trend Evolution
- Kenya Silicon Alloys Market Drivers and Challenges
- Kenya Silicon Alloys Price Trends
- Kenya Silicon Alloys Porter's Five Forces
- Kenya Silicon Alloys Industry Life Cycle
- Historical Data and Forecast of Kenya Silicon Alloys Market Revenues & Volume By Type for the Period 2022-2032F
- Historical Data and Forecast of Kenya Silicon Alloys Market Revenues & Volume By Ferrosilicon for the Period 2022-2032F
- Historical Data and Forecast of Kenya Silicon Alloys Market Revenues & Volume By Deoxidizers for the Period 2022-2032F
- Historical Data and Forecast of Kenya Silicon Alloys Market Revenues & Volume By Inoculants for the Period 2022-2032F
- Historical Data and Forecast of Kenya Silicon Alloys Market Revenues & Volume By Others for the Period 2022-2032F
- Historical Data and Forecast of Kenya Silicon Alloys Market Revenues & Volume By Application for the Period 2022-2032F
- Historical Data and Forecast of Kenya Silicon Alloys Market Revenues & Volume By Carbon Steel & Other Alloy Steel for the Period 2022-2032F
- Historical Data and Forecast of Kenya Silicon Alloys Market Revenues & Volume By Stainless Steel for the Period 2022-2032F
- Historical Data and Forecast of Kenya Silicon Alloys Market Revenues & Volume By Electrical Steel for the Period 2022-2032F
- Historical Data and Forecast of Kenya Silicon Alloys Market Revenues & Volume By Cast Iron for the Period 2022-2032F
- Historical Data and Forecast of Kenya Silicon Alloys Market Revenues & Volume By Others for the Period 2022-2032F
- Kenya Silicon Alloys Import Export Trade Statistics
- Market Opportunity Assessment By Type
- Market Opportunity Assessment By Application
- Kenya Silicon Alloys Top Companies Market Share
- Kenya Silicon Alloys Competitive Benchmarking By Technical and Operational Parameters
- Kenya Silicon Alloys Company Profiles
- Kenya Silicon Alloys Key Strategic Recommendations
Kenya Silicon Alloys Market - Frequently Asked Questions
The growth is primarily driven by expanding industrial sectors, increased demand for durable materials in construction and automotive industries, and governmental support for local production.
The Kenya Silicon Alloys Market was estimated at USD 232 Million in 2025 and is expected to grow to USD 326 Million by 2032, reflecting a CAGR of 5.0% from 2026 to 2032.
Silicon alloys are primarily utilized in the automotive, electronics, and construction sectors, where they enhance product strength and heat resistance.
Government policies include tax incentives and the establishment of industrial parks, which are designed to bolster local manufacturing and attract foreign investment.
There is a growing focus on sustainable production methods, prompting manufacturers to invest in cleaner technologies that minimize emissions and waste in the production process.
6Wresearch actively monitors the Kenya Silicon Alloys Market and publishes its comprehensive annual report, highlighting emerging trends, growth drivers, revenue analysis, and forecast outlook. Our insights help businesses to make data-backed strategic decisions with ongoing market dynamics. Our analysts track relevent industries related to the Kenya Silicon Alloys Market, allowing our clients with actionable intelligence and reliable forecasts tailored to emerging regional needs.
Yes, we provide customisation as per your requirements. To learn more, feel free to contact us on sales@6wresearch.com
1 Executive Summary |
2 Introduction |
2.1 Key Highlights of the Report |
2.2 Report Description |
2.3 Market Scope & Segmentation |
2.4 Research Methodology |
2.5 Assumptions |
3 Kenya Silicon Alloys Market Overview |
3.1 Kenya Country Macro Economic Indicators |
3.2 Kenya Silicon Alloys Market Revenues & Volume, 2022 & 2032F |
3.3 Kenya Silicon Alloys Market - Industry Life Cycle |
3.4 Kenya Silicon Alloys Market - Porter's Five Forces |
3.5 Kenya Silicon Alloys Market Revenues & Volume Share, By Type, 2022 & 2032F |
3.6 Kenya Silicon Alloys Market Revenues & Volume Share, By Form, 2022 & 2032F |
4 Kenya Silicon Alloys Market Dynamics |
4.1 Impact Analysis |
4.2 Market Drivers |
4.3 Market Restraints |
5 Kenya Silicon Alloys Market Trends |
6 Kenya Silicon Alloys Market, By Types |
6.1 Kenya Silicon Alloys Market, By Type |
6.1.1 Overview and Analysis |
6.1.2 Kenya Silicon Alloys Market Revenues & Volume, By Type, 2022-2032F |
6.1.3 Kenya Silicon Alloys Market Revenues & Volume, By Ferrosilicon, 2022-2032F |
6.1.4 Kenya Silicon Alloys Market Revenues & Volume, By Deoxidizers, 2022-2032F |
6.1.5 Kenya Silicon Alloys Market Revenues & Volume, By Inoculants, 2022-2032F |
6.1.6 Kenya Silicon Alloys Market Revenues & Volume, By Others, 2022-2032F |
6.2 Kenya Silicon Alloys Market, By Application |
6.2.1 Overview and Analysis |
6.2.2 Kenya Silicon Alloys Market Revenues & Volume, By Carbon Steel & Other Alloy Steel, 2022-2032F |
6.2.3 Kenya Silicon Alloys Market Revenues & Volume, By Stainless Steel, 2022-2032F |
6.2.4 Kenya Silicon Alloys Market Revenues & Volume, By Electrical Steel, 2022-2032F |
6.2.5 Kenya Silicon Alloys Market Revenues & Volume, By Cast Iron, 2022-2032F |
6.2.6 Kenya Silicon Alloys Market Revenues & Volume, By Others, 2022-2032F |
7 Kenya Silicon Alloys Market Import-Export Trade Statistics |
7.1 Kenya Silicon Alloys Market Export to Major Countries |
7.2 Kenya Silicon Alloys Market Imports from Major Countries |
8 Kenya Silicon Alloys Market Key Performance Indicators |
9 Kenya Silicon Alloys Market - Opportunity Assessment |
9.1 Kenya Silicon Alloys Market Opportunity Assessment, By Type, 2022 & 2032F |
9.2 Kenya Silicon Alloys Market Opportunity Assessment, By Application, 2022 & 2032F |
10 Kenya Silicon Alloys Market - Competitive Landscape |
10.1 Kenya Silicon Alloys Market Revenue Share, By Companies, 2025 |
10.2 Kenya Silicon Alloys Market Competitive Benchmarking, By Operating and Technical Parameters |
11 Company Profiles |
12 Recommendations |
13 Disclaimer |
Global Go To Market Strategy - 2030
Export potential enables firms to identify high-growth global markets with greater confidence by combining advanced trade intelligence with a structured quantitative methodology. The framework analyzes emerging demand trends and country-level import patterns while integrating macroeconomic and trade datasets such as GDP and population forecasts, bilateral import–export flows, tariff structures, elasticity differentials between developed and developing economies, geographic distance, and import demand projections. Using weighted trade values from 2020–2024 as the base period to project country-to-country export potential for 2030, these inputs are operationalized through calculated drivers such as gravity model parameters, tariff impact factors, and projected GDP per-capita growth. Through an analysis of hidden potentials, demand hotspots, and market conditions that are most favorable to success, this method enables firms to focus on target countries, maximize returns, and global expansion with data, backed by accuracy.
By factoring in the projected importer demand gap that is currently unmet and could be potential opportunity, it identifies the potential for the Exporter (Country) among 190 countries, against the general trade analysis, which identifies the biggest importer or exporter.
To discover high-growth global markets and optimize your business strategy:
Click Here
Pricing
- Single User License$ 1,995
- Department License$ 2,400
- Site License$ 3,120
- Global License$ 3,795

Leadership Perspectives from Industry Events
Search
Thought Leadership and Analyst Meet


Our Clients
6WResearch In News
- India Air Conditioner Market Set for Strong Rebound in 2026 After Weather-Led Correction and GST-Driven Recovery: 6Wresearch
- ADAS in India: How Automatic Emergency Braking, Blind Spot Detection & Driver Monitoring are Transforming Road Safety
- Doha a strategic location for EV manufacturing hub: IPA Qatar
- Demand for luxury TVs surging in the GCC, says Samsung
- Empowering Growth: The Thriving Journey of Bangladesh’s Cable Industry
- Demand for luxury TVs surging in the GCC, says Samsung
Latest Reports
- Nicaragua RPG Gaming Market (2026-2032)
- New Zealand RPG Gaming Market (2026-2032)
- Netherlands RPG Gaming Market (2026-2032)
- Nauru RPG Gaming Market (2026-2032)
- Namibia RPG Gaming Market (2026-2032)
- Mozambique RPG Gaming Market (2026-2032)
- Montenegro RPG Gaming Market (2026-2032)
- Mongolia RPG Gaming Market (2026-2032)
- Monaco RPG Gaming Market (2026-2032)
- Micronesia RPG Gaming Market (2026-2032)
Industry Events and Analyst Meet

HIMTEX 2026

India Refining Summit 2026

India EV Show 2026

EV tech India Expo 2026

Auto Tech Asia 2026
Whitepaper
- Middle East & Africa Commercial Security Market Click here to view more.
- Middle East & Africa Fire Safety Systems & Equipment Market Click here to view more.
- GCC Drone Market Click here to view more.
- Middle East Lighting Fixture Market Click here to view more.
- GCC Physical & Perimeter Security Market Click here to view more.