Kenya Soups Market Outlook | Companies, Share, Revenue, Size, COVID-19 IMPACT, Value, Industry, Trends, Growth, Forecast & Analysis
Market Forecast By Type (Dry, Wet, Others), By Distribution Channel (Supermarkets & Hypermarkets, Convenience Stores, Others) And Competitive Landscape
| Product Code: ETC218690 | Publication Date: Aug 2022 | Updated Date: Aug 2025 | Product Type: Market Research Report | |
| Publisher: 6Wresearch | Author: Ravi Bhandari | No. of Pages: 75 | No. of Figures: 35 | No. of Tables: 20 |
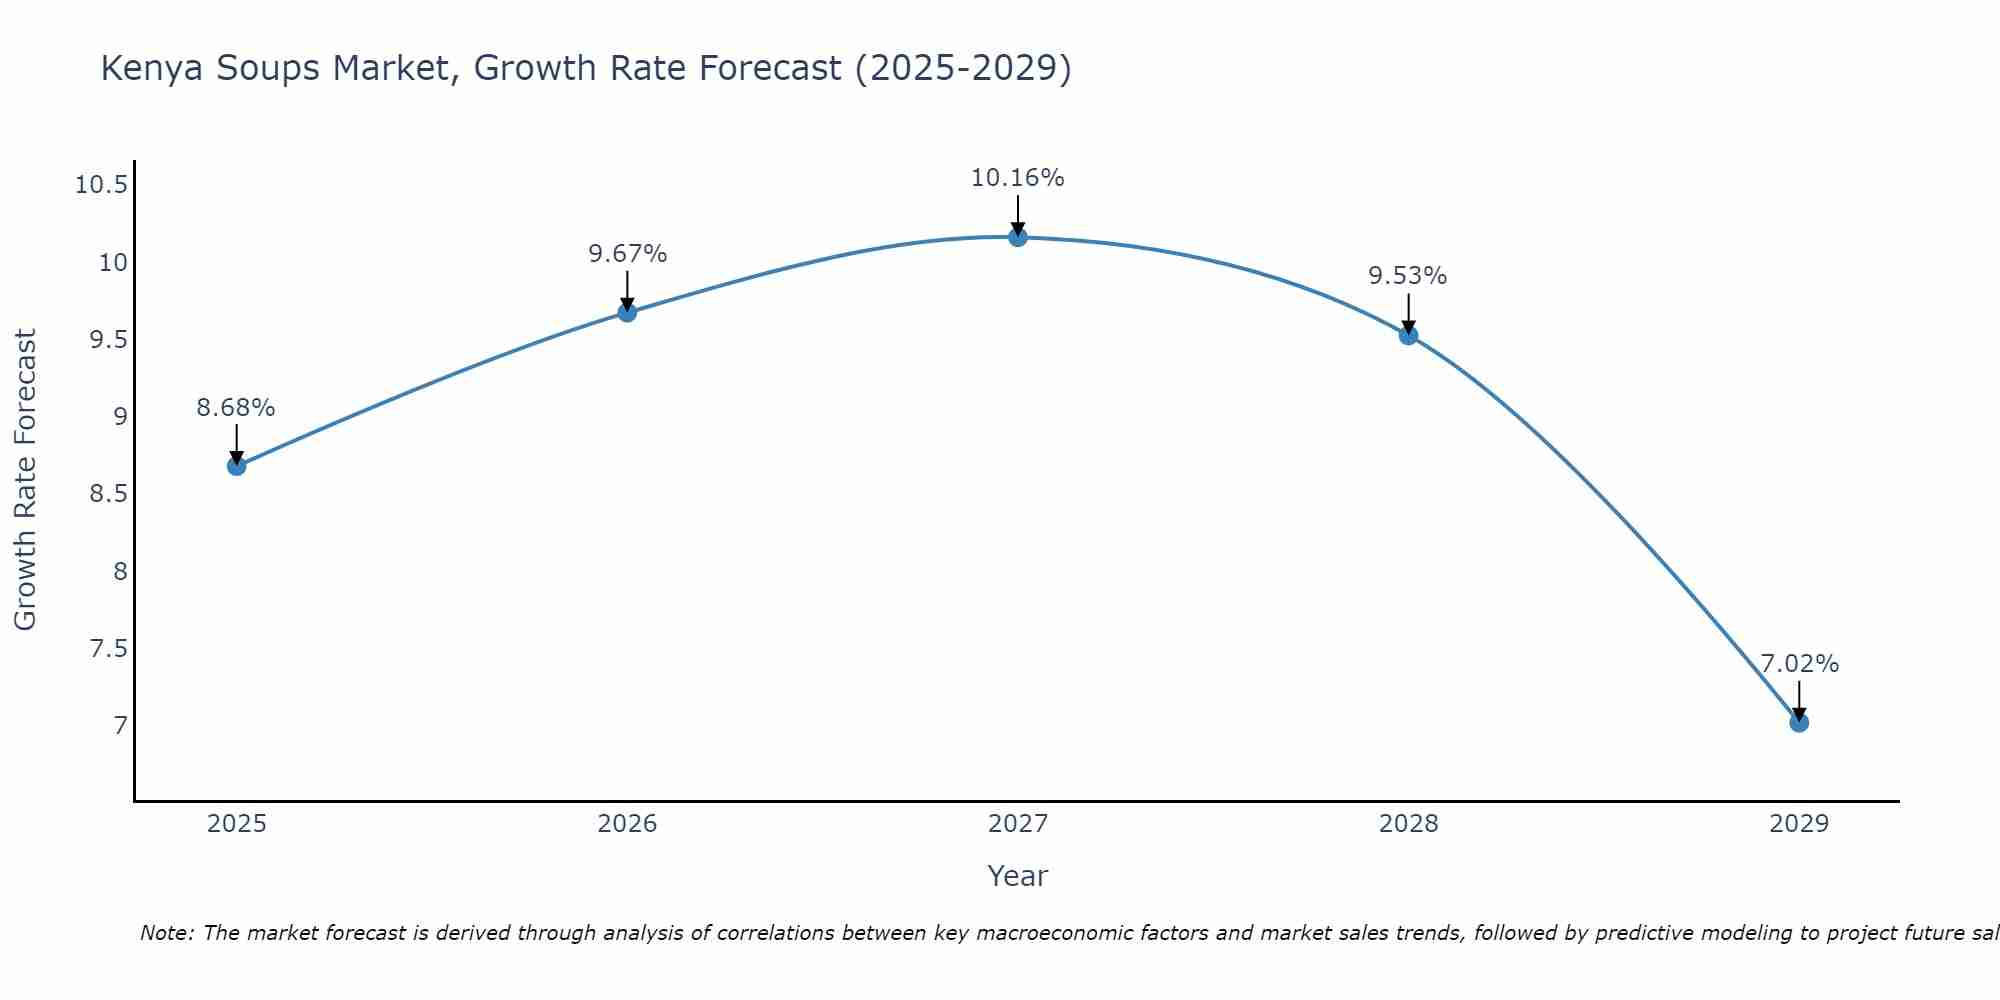
Kenya Soups Market Size Growth Rate
The Kenya Soups Market is projected to witness mixed growth rate patterns during 2025 to 2029. Growth accelerates to 10.16% in 2027, following an initial rate of 8.68%, before easing to 7.02% at the end of the period.
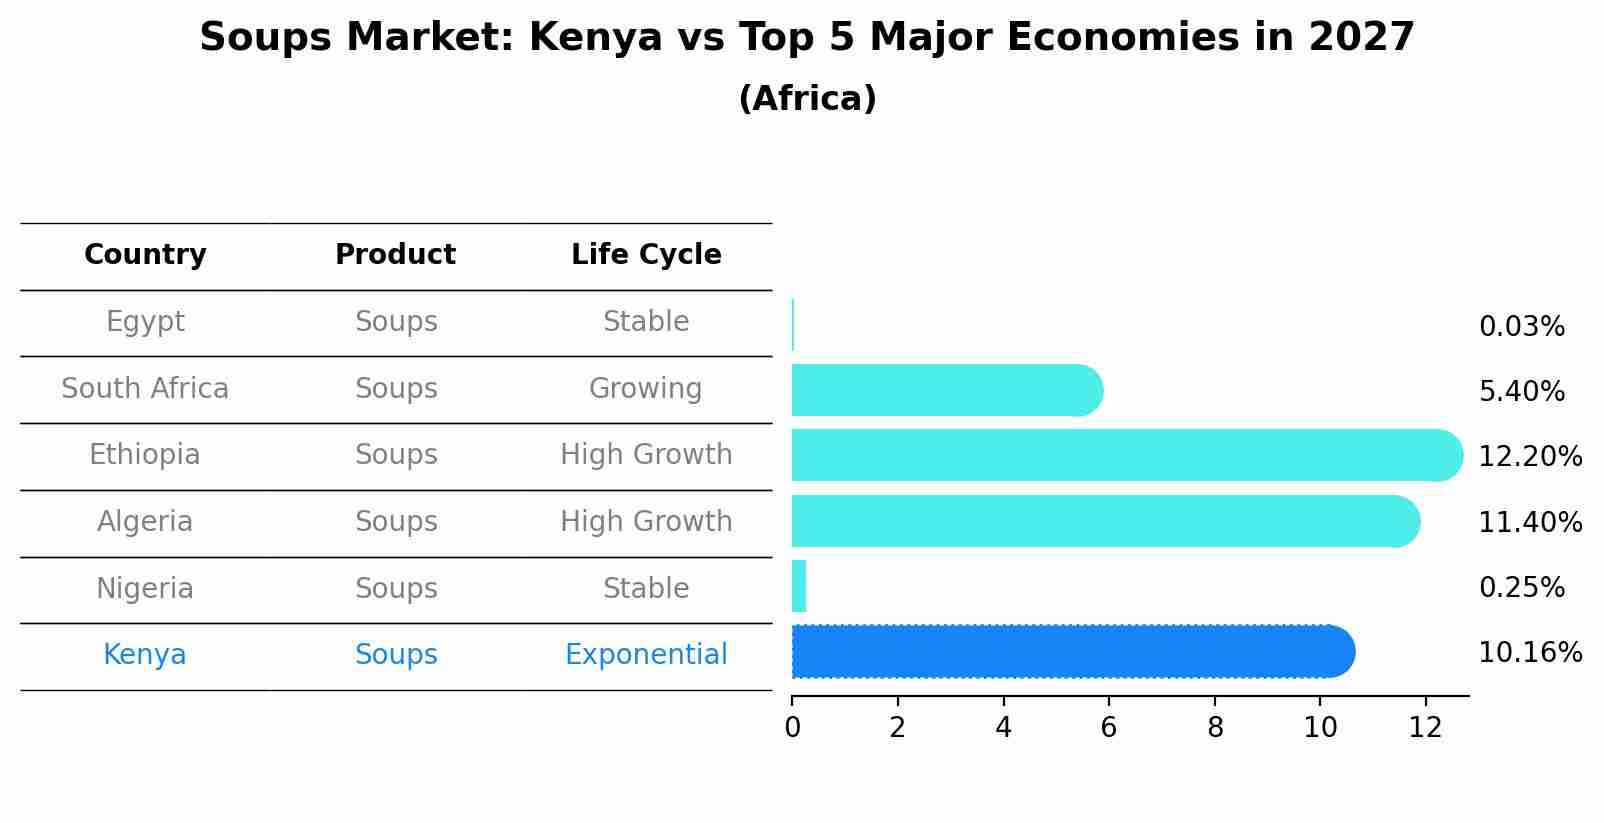
Soups Market: Kenya vs Top 5 Major Economies in 2027 (Africa)
The Soups market in Kenya is projected to grow at a high growth rate of 10.16% by 2027, highlighting the country's increasing focus on advanced technologies within the Africa region, where Egypt holds the dominant position, followed closely by South Africa, Ethiopia, Algeria and Nigeria, shaping overall regional demand.
Kenya Soups Market Overview
The soups market in Kenya is witnessing growth, driven by changing dietary habits and the increasing demand for convenient and nutritious meal options. Soups, available in various flavors and formats, are becoming popular as a quick and healthy food choice for busy consumers. The market benefits from the rising disposable incomes and the influence of global food trends. Innovations in product formulations, focusing on health benefits and natural ingredients, are expected to attract more consumers and expand market reach.
Drivers of the market
The Kenya Soups Market is being propelled by changing consumer lifestyles and dietary habits. As more people lead busy lives, there is a growing demand for convenient and quick meal options, such as ready-to-eat soups. The increasing awareness of healthy eating is also driving consumers towards soups that offer nutritional benefits, such as low-fat, low-calorie, and organic options. Additionally, the expansion of the retail sector and the availability of a wide variety of soups in supermarkets and convenience stores are contributing to market growth.
Challenges of the market
The soups market in Kenya faces challenges related to consumer preferences and the traditional food culture, which often prioritizes homemade meals over packaged foods. The high cost of imported ingredients and packaging materials makes it difficult for local manufacturers to offer competitively priced products. Additionally, there are logistical challenges in terms of distribution and maintaining the freshness and quality of soups, especially in regions with inadequate refrigeration infrastructure. Marketing and educating consumers about the convenience and nutritional benefits of packaged soups also pose significant challenges.
Government Policy of the market
The Kenya governments policies on food safety and standards influence the soups market. KEBS regulations ensure that soups meet safety and quality standards. Additionally, policies promoting local agriculture and food processing industries support the growth of the soups market through local sourcing and production.
Key Highlights of the Report:
- Kenya Soups Market Outlook
- Market Size of Kenya Soups Market, 2021
- Forecast of Kenya Soups Market, 2028
- Historical Data and Forecast of Kenya Soups Revenues & Volume for the Period 2018 - 2028
- Kenya Soups Market Trend Evolution
- Kenya Soups Market Drivers and Challenges
- Kenya Soups Price Trends
- Kenya Soups Porter's Five Forces
- Kenya Soups Industry Life Cycle
- Historical Data and Forecast of Kenya Soups Market Revenues & Volume By Type for the Period 2018 - 2028
- Historical Data and Forecast of Kenya Soups Market Revenues & Volume By Dry for the Period 2018 - 2028
- Historical Data and Forecast of Kenya Soups Market Revenues & Volume By Wet for the Period 2018 - 2028
- Historical Data and Forecast of Kenya Soups Market Revenues & Volume By Others for the Period 2018 - 2028
- Historical Data and Forecast of Kenya Soups Market Revenues & Volume By Distribution Channel for the Period 2018 - 2028
- Historical Data and Forecast of Kenya Soups Market Revenues & Volume By Supermarkets & Hypermarkets for the Period 2018 - 2028
- Historical Data and Forecast of Kenya Soups Market Revenues & Volume By Convenience Stores for the Period 2018 - 2028
- Historical Data and Forecast of Kenya Soups Market Revenues & Volume By Others for the Period 2018 - 2028
- Kenya Soups Import Export Trade Statistics
- Market Opportunity Assessment By Type
- Market Opportunity Assessment By Distribution Channel
- Kenya Soups Top Companies Market Share
- Kenya Soups Competitive Benchmarking By Technical and Operational Parameters
- Kenya Soups Company Profiles
- Kenya Soups Key Strategic Recommendations
Frequently Asked Questions About the Market Study (FAQs):
6Wresearch actively monitors the Kenya Soups Market and publishes its comprehensive annual report, highlighting emerging trends, growth drivers, revenue analysis, and forecast outlook. Our insights help businesses to make data-backed strategic decisions with ongoing market dynamics. Our analysts track relevent industries related to the Kenya Soups Market, allowing our clients with actionable intelligence and reliable forecasts tailored to emerging regional needs.
Yes, we provide customisation as per your requirements. To learn more, feel free to contact us on sales@6wresearch.com
1 Executive Summary |
2 Introduction |
2.1 Key Highlights of the Report |
2.2 Report Description |
2.3 Market Scope & Segmentation |
2.4 Research Methodology |
2.5 Assumptions |
3 Kenya Soups Market Overview |
3.1 Kenya Country Macro Economic Indicators |
3.2 Kenya Soups Market Revenues & Volume, 2021 & 2028F |
3.3 Kenya Soups Market - Industry Life Cycle |
3.4 Kenya Soups Market - Porter's Five Forces |
3.5 Kenya Soups Market Revenues & Volume Share, By Type, 2021 & 2028F |
3.6 Kenya Soups Market Revenues & Volume Share, By Distribution Channel, 2021 & 2028F |
4 Kenya Soups Market Dynamics |
4.1 Impact Analysis |
4.2 Market Drivers |
4.2.1 Increasing consumer awareness about health and wellness benefits of soups |
4.2.2 Growing demand for convenient and ready-to-eat food options |
4.2.3 Rising disposable incomes leading to higher spending on convenience foods |
4.3 Market Restraints |
4.3.1 Seasonal fluctuations affecting the consumption of soups |
4.3.2 Price sensitivity among consumers, particularly in lower-income segments |
5 Kenya Soups Market Trends |
6 Kenya Soups Market, By Types |
6.1 Kenya Soups Market, By Type |
6.1.1 Overview and Analysis |
6.1.2 Kenya Soups Market Revenues & Volume, By Type, 2018 - 2028F |
6.1.3 Kenya Soups Market Revenues & Volume, By Dry, 2018 - 2028F |
6.1.4 Kenya Soups Market Revenues & Volume, By Wet, 2018 - 2028F |
6.1.5 Kenya Soups Market Revenues & Volume, By Others, 2018 - 2028F |
6.2 Kenya Soups Market, By Distribution Channel |
6.2.1 Overview and Analysis |
6.2.2 Kenya Soups Market Revenues & Volume, By Supermarkets & Hypermarkets, 2018 - 2028F |
6.2.3 Kenya Soups Market Revenues & Volume, By Convenience Stores, 2018 - 2028F |
6.2.4 Kenya Soups Market Revenues & Volume, By Others, 2018 - 2028F |
7 Kenya Soups Market Import-Export Trade Statistics |
7.1 Kenya Soups Market Export to Major Countries |
7.2 Kenya Soups Market Imports from Major Countries |
8 Kenya Soups Market Key Performance Indicators |
8.1 Number of new product launches in the soup market |
8.2 Consumer engagement on social media platforms for soup brands |
8.3 Percentage growth in online sales of soups |
8.4 Number of partnerships with food delivery services to increase accessibility |
8.5 Average daily consumption rate of soups per capita |
9 Kenya Soups Market - Opportunity Assessment |
9.1 Kenya Soups Market Opportunity Assessment, By Type, 2021 & 2028F |
9.2 Kenya Soups Market Opportunity Assessment, By Distribution Channel, 2021 & 2028F |
10 Kenya Soups Market - Competitive Landscape |
10.1 Kenya Soups Market Revenue Share, By Companies, 2021 |
10.2 Kenya Soups Market Competitive Benchmarking, By Operating and Technical Parameters |
11 Company Profiles |
12 Recommendations |
13 Disclaimer |
Global Go To Market Strategy - 2030
Export potential enables firms to identify high-growth global markets with greater confidence by combining advanced trade intelligence with a structured quantitative methodology. The framework analyzes emerging demand trends and country-level import patterns while integrating macroeconomic and trade datasets such as GDP and population forecasts, bilateral import–export flows, tariff structures, elasticity differentials between developed and developing economies, geographic distance, and import demand projections. Using weighted trade values from 2020–2024 as the base period to project country-to-country export potential for 2030, these inputs are operationalized through calculated drivers such as gravity model parameters, tariff impact factors, and projected GDP per-capita growth. Through an analysis of hidden potentials, demand hotspots, and market conditions that are most favorable to success, this method enables firms to focus on target countries, maximize returns, and global expansion with data, backed by accuracy.
By factoring in the projected importer demand gap that is currently unmet and could be potential opportunity, it identifies the potential for the Exporter (Country) among 190 countries, against the general trade analysis, which identifies the biggest importer or exporter.
To discover high-growth global markets and optimize your business strategy:
Click Here
Pricing
- Single User License$ 1,995
- Department License$ 2,400
- Site License$ 3,120
- Global License$ 3,795

Leadership Perspectives from Industry Events
Search
Thought Leadership and Analyst Meet


Our Clients
6WResearch In News
- India Air Conditioner Market Set for Strong Rebound in 2026 After Weather-Led Correction and GST-Driven Recovery: 6Wresearch
- ADAS in India: How Automatic Emergency Braking, Blind Spot Detection & Driver Monitoring are Transforming Road Safety
- Doha a strategic location for EV manufacturing hub: IPA Qatar
- Demand for luxury TVs surging in the GCC, says Samsung
- Empowering Growth: The Thriving Journey of Bangladesh’s Cable Industry
- Demand for luxury TVs surging in the GCC, says Samsung
Latest Reports
- Nicaragua RPG Gaming Market (2026-2032)
- New Zealand RPG Gaming Market (2026-2032)
- Netherlands RPG Gaming Market (2026-2032)
- Nauru RPG Gaming Market (2026-2032)
- Namibia RPG Gaming Market (2026-2032)
- Mozambique RPG Gaming Market (2026-2032)
- Montenegro RPG Gaming Market (2026-2032)
- Mongolia RPG Gaming Market (2026-2032)
- Monaco RPG Gaming Market (2026-2032)
- Micronesia RPG Gaming Market (2026-2032)
Industry Events and Analyst Meet

EV India Expo 2026

HIMTEX 2026

India Refining Summit 2026

India EV Show 2026

EV tech India Expo 2026
Whitepaper
- Middle East & Africa Commercial Security Market Click here to view more.
- Middle East & Africa Fire Safety Systems & Equipment Market Click here to view more.
- GCC Drone Market Click here to view more.
- Middle East Lighting Fixture Market Click here to view more.
- GCC Physical & Perimeter Security Market Click here to view more.