Kenya Speciality Cleaning and Sanitation Market (2026-2032) | Companies, Forecast, Size, Industry, Outlook, Value, Growth, Trends, Revenue, Share, Analysis & COVID-19 IMPACT
Market Forecast By Type (Acid cleaner, Alkaline cleaner, Other), By Applications (Food industry, Household use, Pharmaceuticals industry, Others) And Competitive Landscape
| Product Code: ETC035890 | Publication Date: Jun 2023 | Product Type: Report | ||
| Publisher: 6Wresearch | Author: Ravi Bhandari | No. of Pages: 70 | No. of Figures: 35 | No. of Tables: 5 |
Kenya Speciality Cleaning and Sanitation Market Summary
The kenya speciality cleaning and sanitation market was estimated at USD 243 Million in 2025 and is projected to reach USD 337 Million by 2032, growing at a CAGR of 5.6% from 2026 to 2032.
Kenya Speciality Cleaning and Sanitation Market Year-wise Growth Rate and Key Drivers
This graph highlights how the Kenya Speciality Cleaning and Sanitation Market has steadily grown over the past five years, supported by major growth factors.
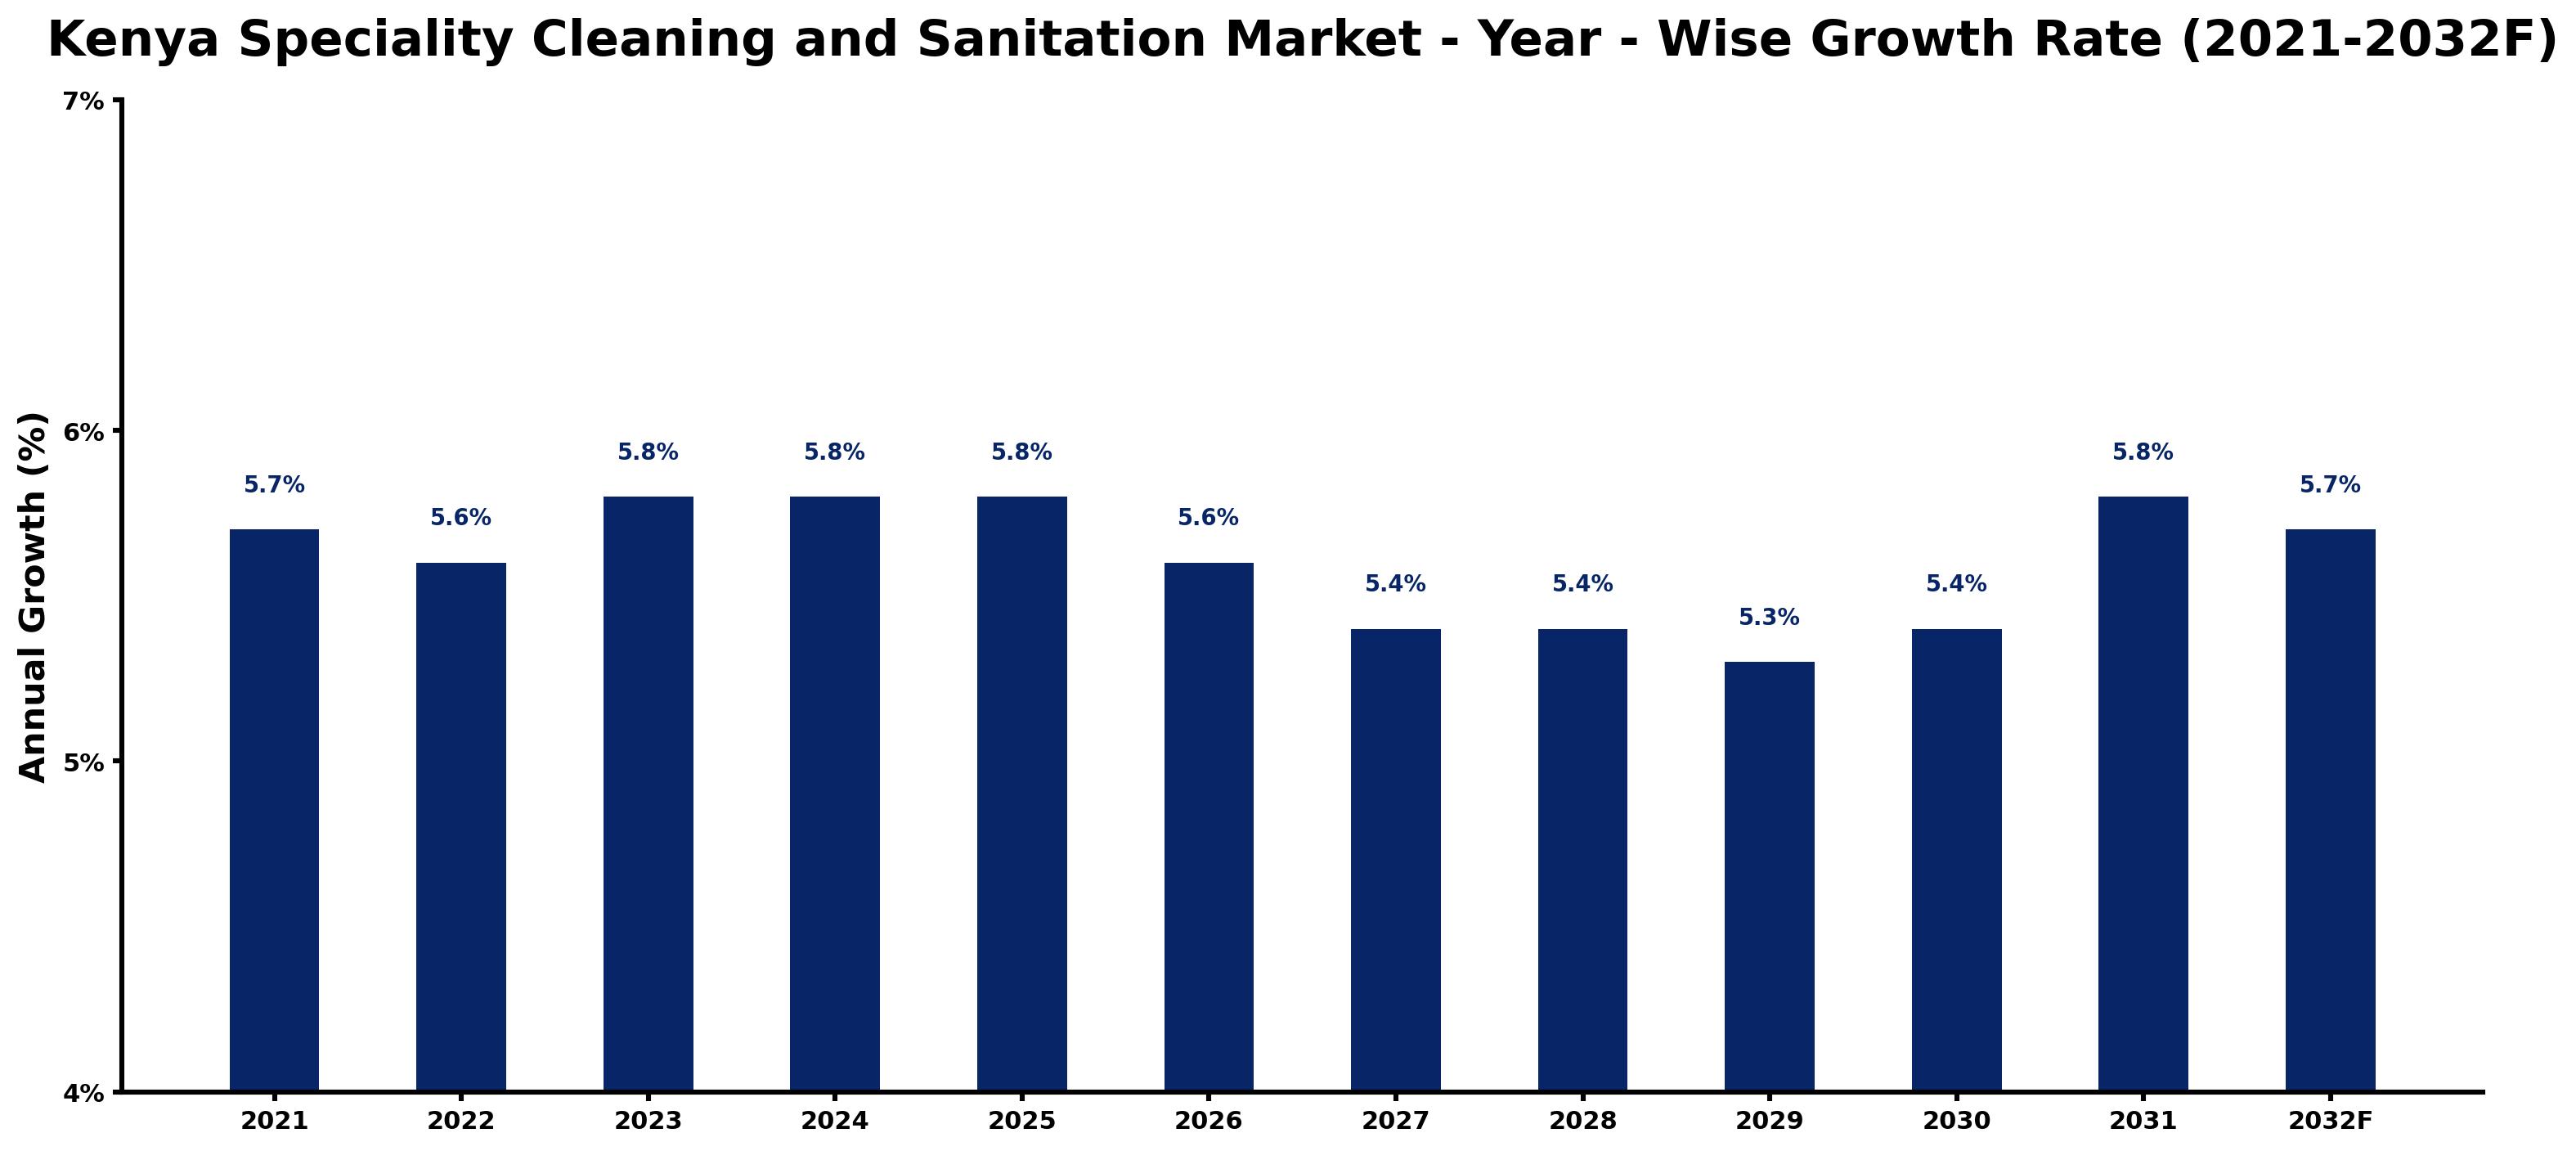
The table below presents the year wise growth rates along with the key drivers influencing the market
| Year | Growth Rate | Major Drivers |
| 2021 | 5.7% | Increased health awareness following the pandemic fuels demand for specialized cleaning services. |
| 2022 | 5.6% | Urbanization trends lead to higher residential and commercial cleaning service needs. |
| 2023 | 5.8% | Technological advancements in cleaning equipment enhance efficiency and effectiveness in sanitation. |
| 2024 | 5.8% | Corporate sustainability goals push companies to prioritize professional cleaning services. |
| 2025 | 5.8% | Rural electrification initiatives create opportunities for sanitation services in underserved areas. |
| 2026 | 5.6% | Emergence of e-commerce platforms drives home delivery of cleaning products and services. |
| 2027 | 5.4% | Consumer behavior shifts towards eco-friendly products, shaping cleaning service offerings. |
| 2028 | 5.4% | Increased foreign investment in hospitality boosts demand for cleaning and sanitation services. |
| 2029 | 5.3% | Compliance with international hygiene standards becomes crucial for businesses across sectors. |
| 2030 | 5.4% | Health crises and outbreaks highlight the importance of regular sanitation practices. |
| 2031 | 5.8% | Local startups innovate cleaning solutions, enhancing competition within the market landscape. |
| 2032 | 5.7% | Integration of AI and IoT into cleaning solutions transforms operational efficiency. |
Note - Market size estimations and growth projections presented in this report are based on 6Wresearch's advanced forecasting approach, validated with industry datasets as of June 2026.
Kenya Speciality Cleaning and Sanitation Market Synopsis
The Kenya Speciality Cleaning and Sanitation Market is projected to reach 5.6% and witness significant growth during the forecast period (2026-2032). The advancements in this market are primarily driven by the rising demand for specialty cleaning products across various sectors including healthcare, hospitality, food processing, automotive, and industrial manufacturing. This increasing awareness regarding hygiene and the health benefits associated with high-quality sanitation materials is expected to propel the market forward in the coming years. Furthermore, a notable rise in the number of hospitals, alongside growing governmental investments, is set to further stimulate demand within Kenya's specialty cleaning and sanitation industry throughout the forecast period.
Kenya Speciality Cleaning and Sanitation Market Growth Drivers
Several factors are contributing to the rapid growth of the Kenya Speciality Cleaning and Sanitation Market. The following points outline the main drivers:
- The commercial sectors, particularly healthcare and hospitality, are increasingly adopting specialty cleaning services and products, thereby boosting market demand.
- Heightened consumer awareness about the importance of hygiene and sanitation, particularly in the wake of global health crises, has led to a sharp increase in the uptake of specialized cleaning products.
- Government initiatives and funding aimed at enhancing healthcare facilities are widening the market for sanitation solutions, particularly in urban centers like Nairobi and Mombasa.
- The growing number of households and commercial establishments is leading to a corresponding rise in the need for effective cleaning solutions, providing a steady growth trajectory for the market.
- Environmental concerns and the rising trend towards sustainability are prompting consumers and businesses to favor biodegradable and eco-friendly cleaning products, thus altering market dynamics.
Kenya Speciality Cleaning and Sanitation Market Market Trends
The Kenya Speciality Cleaning and Sanitation Market is currently witnessing several trends that are shaping its future landscape. These trends include:
- A significant shift towards eco-friendly products, with consumers increasingly selecting cleaning solutions made from natural ingredients, thereby encouraging manufacturers to adapt their product portfolios.
- The integration of technology, including smart cleaning solutions that leverage IoT and automation to enhance efficacy and efficiency in sanitation processes.
- Collaboration among industry stakeholders, including partnerships between local vendors and distributors, aimed at enhancing market penetration and product accessibility across the nation.
- Elevated emphasis on safety and health standards, particularly in commercial environments like hospitals and food processing plants, is demanding higher quality sanitation products that meet stringent regulatory requirements.
- A growing trend towards personalized cleaning solutions tailored to specific industry needs, enabling businesses to achieve better sanitation outcomes.
Kenya Speciality Cleaning and Sanitation Market Challenges and Restraints
Despite the positive growth trajectory, the Kenya Speciality Cleaning and Sanitation Market faces several challenges that could impact its expansion. Key challenges include:
- The presence of counterfeit products in the market, which can undermine consumer trust and affect the demand for authentic specialty cleaning materials.
- Economic fluctuations and budget constraints, particularly in public healthcare sectors, may limit spending on advanced cleaning solutions and sanitization efforts.
- Inadequate infrastructure in certain regions can pose logistical challenges that affect product distribution and accessibility.
- Resistance to change among traditional cleaning practices may slow down the adoption of innovative cleaning solutions among some businesses.
- The need for continuous training and skill development of cleaning personnel in best practices and the use of new products can pose an additional burden on companies.
Kenya Speciality Cleaning and Sanitation Market Government Investment and Initiatives
The Kenyan government has recognized the critical importance of sanitation and hygiene in enhancing public health and is actively investing in various initiatives to support the specialty cleaning and sanitation market. Key government strategies include:
- Increased budget allocations for healthcare infrastructure improvements, which have led to the establishment of more hospitals requiring specialized cleaning services and products.
- Implementation of regulatory frameworks aimed at ensuring quality standards in cleaning and sanitation products, thereby fostering consumer confidence in these solutions.
- Public health campaigns focused on promoting hygiene awareness, which have boosted demand for sanitation products among both individuals and institutions.
- Collaboration with non-governmental organizations to enhance sanitation practices in rural areas, aimed at improving overall public health outcomes.
- Facilitation of partnerships between local manufacturers and international companies to promote technology transfer and enhance local product offerings.
Kenya Speciality Cleaning and Sanitation Market Latest Developments (May 2025 - June 2026)
Recent developments in the Kenya Speciality Cleaning and Sanitation Market from May 2025 to June 2026 reflect a dynamic and evolving landscape. Noteworthy trends during this period include:
- Escalation of investments from international entities in local cleaning product manufacturing, promoting job creation and economic growth within the industry.
- Accelerated adoption of digital marketing strategies by manufacturers to enhance consumer engagement and education on the benefits of specialty cleaning products.
- Emergence of new product lines focusing on antibacterial and antiviral properties, driven by ongoing public health concerns.
- Focus on sustainability led to the introduction of a host of new eco-friendly products as businesses seek to align with consumer preferences.
- Governmental initiatives aimed at enhancing vocational training programs for sanitation workers, thereby improving overall service quality in the industry.
Kenya Speciality Cleaning and Sanitation Market - Key Attractiveness of the Report
- 10 Years of Market Numbers
- Historical Data Starting from 2022 to 2025
- Base Year: 2025
- Forecast Data until 2032
- Key Performance Indicators Impacting the Market
- Major Upcoming Developments and Projects
Key Highlights of the Report:
- Kenya Speciality Cleaning and Sanitation Market Outlook
- Market Size of Kenya Speciality Cleaning and Sanitation Market, 2025
- Forecast of Kenya Speciality Cleaning and Sanitation Market, 2032F
- Historical Data and Forecast of Kenya Speciality Cleaning and Sanitation Revenues & Volume for the Period 2022-2032F
- Kenya Speciality Cleaning and Sanitation Market Trend Evolution
- Kenya Speciality Cleaning and Sanitation Market Drivers and Challenges
- Kenya Speciality Cleaning and Sanitation Price Trends
- Kenya Speciality Cleaning and Sanitation Porter's Five Forces
- Kenya Speciality Cleaning and Sanitation Industry Life Cycle
- Historical Data and Forecast of Kenya Speciality Cleaning and Sanitation Market Revenues & Volume By Type for the Period 2022-2032F
- Historical Data and Forecast of Kenya Speciality Cleaning and Sanitation Market Revenues & Volume By Acid cleaner for the Period 2022-2032F
- Historical Data and Forecast of Kenya Speciality Cleaning and Sanitation Market Revenues & Volume By Alkaline cleaner for the Period 2022-2032F
- Historical Data and Forecast of Kenya Speciality Cleaning and Sanitation Market Revenues & Volume By Other for the Period 2022-2032F
- Historical Data and Forecast of Kenya Speciality Cleaning and Sanitation Market Revenues & Volume By Applications for the Period 2022-2032F
- Historical Data and Forecast of Kenya Speciality Cleaning and Sanitation Market Revenues & Volume By Food industry for the Period 2022-2032F
- Historical Data and Forecast of Kenya Speciality Cleaning and Sanitation Market Revenues & Volume By Household use for the Period 2022-2032F
- Historical Data and Forecast of Kenya Speciality Cleaning and Sanitation Market Revenues & Volume By Pharmaceuticals industry for the Period 2022-2032F
- Historical Data and Forecast of Kenya Speciality Cleaning and Sanitation Market Revenues & Volume By Others for the Period 2022-2032F
- Kenya Speciality Cleaning and Sanitation Import Export Trade Statistics
- Market Opportunity Assessment By Type
- Market Opportunity Assessment By Applications
- Kenya Speciality Cleaning and Sanitation Top Companies Market Share
- Kenya Speciality Cleaning and Sanitation Competitive Benchmarking By Technical and Operational Parameters
- Kenya Speciality Cleaning and Sanitation Company Profiles
- Kenya Speciality Cleaning and Sanitation Key Strategic Recommendations
Frequently Asked Questions About the Market Study (FAQs):
The market growth is predominantly driven by demand in sectors such as healthcare and hospitality, increased awareness regarding hygiene, and governmental support for sanitation initiatives.
Government investment plays a crucial role in enhancing healthcare infrastructure and promoting sanitation standards, which in turn boosts demand for specialty cleaning products.
The market faces challenges such as counterfeit products, economic fluctuations, and a need for better infrastructure and trained personnel.
Yes, there is a growing trend towards eco-friendly cleaning products as consumers become more environmentally conscious and seek sustainable options.
6Wresearch actively monitors the Kenya Speciality Cleaning and Sanitation Market and publishes its comprehensive annual report, highlighting emerging trends, growth drivers, revenue analysis, and forecast outlook. Our insights help businesses to make data-backed strategic decisions with ongoing market dynamics. Our analysts track relevent industries related to the Kenya Speciality Cleaning and Sanitation Market, allowing our clients with actionable intelligence and reliable forecasts tailored to emerging regional needs.
Yes, we provide customisation as per your requirements. To learn more, feel free to contact us on sales@6wresearch.com
1 Executive Summary |
2 Introduction |
2.1 Key Highlights of the Report |
2.2 Report Description |
2.3 Market Scope & Segmentation |
2.4 Research Methodology |
2.5 Assumptions |
3 Kenya Speciality Cleaning and Sanitation Market Overview |
3.1 Kenya Country Macro Economic Indicators |
3.2 Kenya Speciality Cleaning and Sanitation Market Revenues & Volume, 2022 & 2032F |
3.3 Kenya Speciality Cleaning and Sanitation Market - Industry Life Cycle |
3.4 Kenya Speciality Cleaning and Sanitation Market - Porter's Five Forces |
3.5 Kenya Speciality Cleaning and Sanitation Market Revenues & Volume Share, By Type, 2022 & 2032F |
3.6 Kenya Speciality Cleaning and Sanitation Market Revenues & Volume Share, By Applications, 2022 & 2032F |
4 Kenya Speciality Cleaning and Sanitation Market Dynamics |
4.1 Impact Analysis |
4.2 Market Drivers |
4.3 Market Restraints |
5 Kenya Speciality Cleaning and Sanitation Market Trends |
6 Kenya Speciality Cleaning and Sanitation Market, By Types |
6.1 Kenya Speciality Cleaning and Sanitation Market, By Type |
6.1.1 Overview and Analysis |
6.1.2 Kenya Speciality Cleaning and Sanitation Market Revenues & Volume, By Type, 2022-2032F |
6.1.3 Kenya Speciality Cleaning and Sanitation Market Revenues & Volume, By Acid cleaner, 2022-2032F |
6.1.4 Kenya Speciality Cleaning and Sanitation Market Revenues & Volume, By Alkaline cleaner, 2022-2032F |
6.1.5 Kenya Speciality Cleaning and Sanitation Market Revenues & Volume, By Other, 2022-2032F |
6.2 Kenya Speciality Cleaning and Sanitation Market, By Applications |
6.2.1 Overview and Analysis |
6.2.2 Kenya Speciality Cleaning and Sanitation Market Revenues & Volume, By Food industry, 2022-2032F |
6.2.3 Kenya Speciality Cleaning and Sanitation Market Revenues & Volume, By Household use, 2022-2032F |
6.2.4 Kenya Speciality Cleaning and Sanitation Market Revenues & Volume, By Pharmaceuticals industry, 2022-2032F |
6.2.5 Kenya Speciality Cleaning and Sanitation Market Revenues & Volume, By Others, 2022-2032F |
7 Kenya Speciality Cleaning and Sanitation Market Import-Export Trade Statistics |
7.1 Kenya Speciality Cleaning and Sanitation Market Export to Major Countries |
7.2 Kenya Speciality Cleaning and Sanitation Market Imports from Major Countries |
8 Kenya Speciality Cleaning and Sanitation Market Key Performance Indicators |
9 Kenya Speciality Cleaning and Sanitation Market - Opportunity Assessment |
9.1 Kenya Speciality Cleaning and Sanitation Market Opportunity Assessment, By Type, 2022 & 2032F |
9.2 Kenya Speciality Cleaning and Sanitation Market Opportunity Assessment, By Applications, 2022 & 2032F |
10 Kenya Speciality Cleaning and Sanitation Market - Competitive Landscape |
10.1 Kenya Speciality Cleaning and Sanitation Market Revenue Share, By Companies, 2025 |
10.2 Kenya Speciality Cleaning and Sanitation Market Competitive Benchmarking, By Operating and Technical Parameters |
11 Company Profiles |
12 Recommendations |
13 Disclaimer |
Global Go To Market Strategy - 2030
Export potential enables firms to identify high-growth global markets with greater confidence by combining advanced trade intelligence with a structured quantitative methodology. The framework analyzes emerging demand trends and country-level import patterns while integrating macroeconomic and trade datasets such as GDP and population forecasts, bilateral import–export flows, tariff structures, elasticity differentials between developed and developing economies, geographic distance, and import demand projections. Using weighted trade values from 2020–2024 as the base period to project country-to-country export potential for 2030, these inputs are operationalized through calculated drivers such as gravity model parameters, tariff impact factors, and projected GDP per-capita growth. Through an analysis of hidden potentials, demand hotspots, and market conditions that are most favorable to success, this method enables firms to focus on target countries, maximize returns, and global expansion with data, backed by accuracy.
By factoring in the projected importer demand gap that is currently unmet and could be potential opportunity, it identifies the potential for the Exporter (Country) among 190 countries, against the general trade analysis, which identifies the biggest importer or exporter.
To discover high-growth global markets and optimize your business strategy:
Click Here
Pricing
- Single User License$ 1,995
- Department License$ 2,400
- Site License$ 3,120
- Global License$ 3,795

Leadership Perspectives from Industry Events
Search
Thought Leadership and Analyst Meet


Our Clients
6WResearch In News
- India Air Conditioner Market Set for Strong Rebound in 2026 After Weather-Led Correction and GST-Driven Recovery: 6Wresearch
- ADAS in India: How Automatic Emergency Braking, Blind Spot Detection & Driver Monitoring are Transforming Road Safety
- Doha a strategic location for EV manufacturing hub: IPA Qatar
- Demand for luxury TVs surging in the GCC, says Samsung
- Empowering Growth: The Thriving Journey of Bangladesh’s Cable Industry
- Demand for luxury TVs surging in the GCC, says Samsung
Latest Reports
- Nicaragua RPG Gaming Market (2026-2032)
- New Zealand RPG Gaming Market (2026-2032)
- Netherlands RPG Gaming Market (2026-2032)
- Nauru RPG Gaming Market (2026-2032)
- Namibia RPG Gaming Market (2026-2032)
- Mozambique RPG Gaming Market (2026-2032)
- Montenegro RPG Gaming Market (2026-2032)
- Mongolia RPG Gaming Market (2026-2032)
- Monaco RPG Gaming Market (2026-2032)
- Micronesia RPG Gaming Market (2026-2032)
Industry Events and Analyst Meet

EV India Expo 2026

HIMTEX 2026

India Refining Summit 2026

India EV Show 2026

EV tech India Expo 2026
Whitepaper
- Middle East & Africa Commercial Security Market Click here to view more.
- Middle East & Africa Fire Safety Systems & Equipment Market Click here to view more.
- GCC Drone Market Click here to view more.
- Middle East Lighting Fixture Market Click here to view more.
- GCC Physical & Perimeter Security Market Click here to view more.