Kenya Tables Market (2026-2032) | Outlook, Revenue, Growth, Value, Companies, Trends, Share, Size, Industry, Analysis & Forecast
Market Forecast By Types (Fabric, Leather, Metal, Wooden, Others), By Applications (Family, Office, Others) And Competitive Landscape
| Product Code: ETC034690 | Publication Date: Oct 2020 | Updated Date: Jun 2026 | Product Type: Report | |
| Publisher: 6Wresearch | Author: Bhawna Singh | No. of Pages: 70 | No. of Figures: 35 | No. of Tables: 5 |
Kenya Tables Market Summary
The kenya tables market was estimated at USD 320 Million in 2025 and is projected to reach USD 468 Million by 2032, growing at a CAGR of 6.6% from 2026 to 2032.
Kenya Tables Market Growth Rate Analysis (2021-2032)
The Kenya tables market has exhibited stable growth over the past few years, with an annual growth rate of 6.5% in 2021, slightly dipping to 6.3% in 2022 before rebounding to 6.8% in 2023. This fluctuation can be attributed to a combination of factors, including increased consumer demand driven by urbanization and a growing middle class. As investments in infrastructure and energy transition initiatives gain momentum, manufacturers are enhancing production capabilities, resulting in a steady supply. Projections indicate a continued growth rate of around 6.6% into 2029, influenced by the ongoing digitalization of supply chains and evolving design preferences among consumers. These dynamics underscore a vibrant market poised for sustained expansion.
Kenya Tables Market Year-wise Growth Rate and Key Drivers
This graph highlights how the Kenya Tables Market has steadily grown over the past five years, supported by major growth factors.
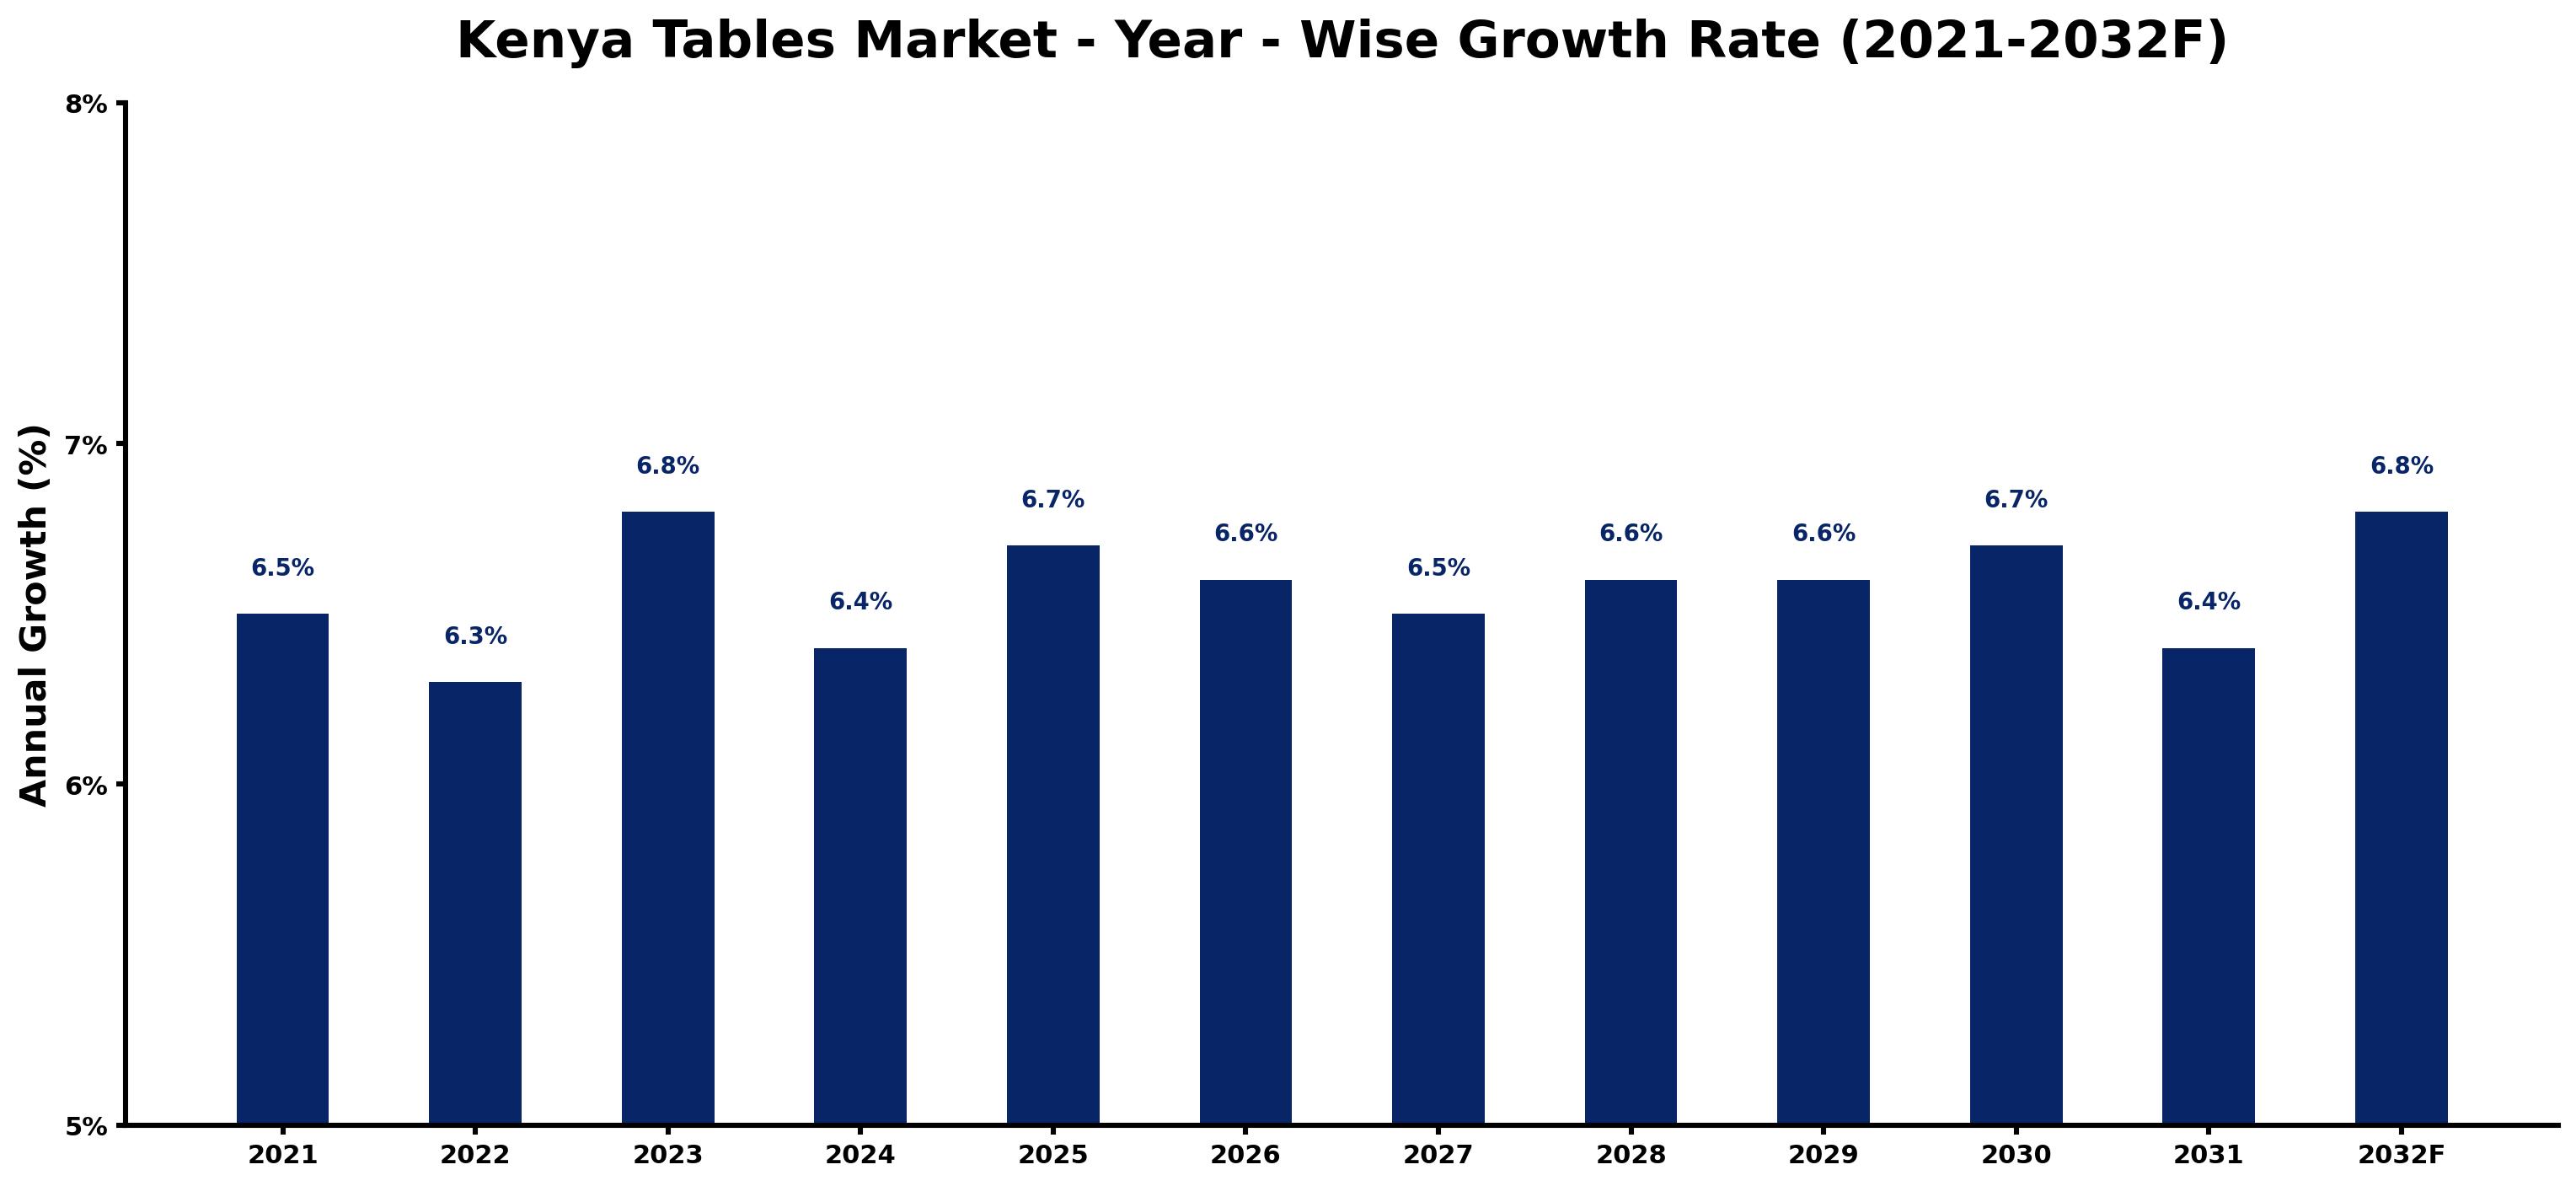
The table below presents the year wise growth rates along with the key drivers influencing the market
| Year | Growth Rate | Major Drivers |
| 2021 | 6.5% | Emerging middle class is increasingly interested in quality furniture for home settings. |
| 2022 | 6.3% | Urbanization fosters new residential developments, boosting demand for stylish table designs. |
| 2023 | 6.8% | Popularity of outdoor dining spaces leads to higher sales of patio tables. |
| 2024 | 6.4% | Local artisans are gaining recognition, emphasizing handcrafted tables that attract consumers. |
| 2025 | 6.7% | Sustainability trends encourage eco-friendly materials for table production and design. |
| 2026 | 6.6% | E-commerce platforms expand furniture availability, making diverse table options accessible. |
| 2027 | 6.5% | Influence of interior design trends sparks interest in unique and modern table styles. |
| 2028 | 6.6% | Increased disposable income allows households to invest in premium furniture pieces. |
| 2029 | 6.6% | Cultural gatherings and celebrations drive demand for larger dining tables in homes. |
| 2030 | 6.7% | Investment in hospitality sectors boosts orders for commercial-grade tables in restaurants. |
| 2031 | 6.4% | Technological innovations facilitate customized table designs to meet consumer preferences. |
| 2032 | 6.8% | Shift towards multifunctional furniture solutions elevates interest in transformable table designs. |
Note - Market size estimations and growth projections presented in this report are based on 6Wresearch's advanced forecasting approach, validated with industry datasets as of June 2026.
Kenya Tables Market Synopsis
The Kenya Tables Market is projected to reach 6.6% and witness significant growth during the forecast period (2026-2032). This market encompasses a wide array of table types, including dining tables, coffee tables, office tables, and outdoor tables, catering to the diverse preferences of consumers. The enduring popularity of wooden tables stems from their durability and aesthetic appeal, while metal and glass options are increasingly sought after for their contemporary design. Contributing factors to market growth include rapid urbanization, rising disposable incomes, and evolving lifestyle trends.
Kenya Tables Market Growth Drivers
Several key drivers are propelling the Kenya Tables Market forward. Urbanization plays a pivotal role, as more individuals move into cities and seek furniture that complements their modern living spaces. Rising disposable incomes empower consumers to invest in quality furniture, highlighting an increased demand for stylish and functional table designs. E-commerce platforms are emerging as vital sales channels, making it easier for consumers to purchase tables. Furthermore, customization options are becoming a significant attraction, allowing consumers to select designs that resonate with their personal styles. Finally, the burgeoning middle class is fueling demand for aesthetically pleasing and practical furniture solutions.
Kenya Tables Market Trends and Opportunities
The Kenya Tables Market is currently experiencing distinct trends that offer intriguing opportunities. A notable shift toward sustainable and eco-friendly materials, such as bamboo and reclaimed wood, is evident, with consumers expressing a preference for environmentally conscious furniture solutions. The rise of multifunctional tables is also noteworthy, as urban dwellers look for furniture that serves multiple purposes in limited spaces, such as extendable dining tables or coffee tables equipped with storage compartments. Minimalist and modern designs are gaining traction, with consumers favoring clean lines and neutral color palettes. Additionally, the growing reliance on online retail channels provides avenues for businesses to reach a wider audience with diverse table options.
Kenya Tables Market Challenges and Restraints
Despite its growth potential, the Kenya Tables Market faces several challenges. Intense competition from local and international manufacturers contributes to a crowded marketplace, where price differentiation becomes crucial. Fluctuating raw material prices can disrupt production costs, impacting the affordability and availability of tables. Furthermore, consumer preferences are continually evolving, making it challenging for manufacturers to stay ahead of trends and respond effectively to changing design demands. Access to capital remains limited for small and medium-sized enterprises, hindering their growth and innovation capabilities. Lastly, maintaining quality control and product durability is essential to building consumer trust and protecting brand reputation in the competitive landscape.
Kenya Tables Market Investment Opportunities
Investors looking to enter the Kenya Tables Market will find several promising opportunities. The ongoing trend of urbanization, coupled with increased disposable income, suggests robust demand for stylish furniture, including tables for homes, offices, and commercial environments. Capitalizing on the rising interest in sustainable furniture solutions can position investors to meet the needs of environmentally conscious consumers. Collaborating with local artisans or designers to create unique, culturally inspired table designs presents another avenue for investment success. Targeting customization options in table designs could also attract discerning consumers seeking personalized solutions in their furniture choices.
Kenya Tables Market Government Investment and Initiatives
The Kenyan government has instituted various policies aimed at enhancing the growth of the Kenya Tables Market. These policies include enforcing quality standards for tables to ensure consumer safety and satisfaction, alongside implementing import tariffs to safeguard local manufacturers from foreign competition. Initiatives promoting sustainability in the furniture sector have been introduced, advocating for the use of eco-friendly materials and production practices. Furthermore, the government is focusing on bolstering support for small and medium-sized enterprises through improved access to financing and market opportunities, thereby fostering a conducive environment for growth in the tables market.
Kenya Tables Market Latest Developments (May 2025 - June 2026)
Recent developments in the Kenya Tables Market indicate a strong focus on sustainability and innovation. Manufacturers are increasingly embracing eco-friendly materials in their production processes, aligning with consumer preferences for sustainable products. The trend toward online shopping has continued to escalate, with consumers favoring the convenience of e-commerce platforms for furniture purchases. Additionally, the push for multifunctional designs has resulted in new product offerings that cater to the evolving needs of urban consumers. Overall, these developments reflect a dynamic market landscape, poised for continued growth as stakeholders adapt to emerging trends and consumer demands.
Kenya Tables Market - Key Attractiveness of the Report
- 10 Years of Market Numbers
- Historical Data Starting from 2022 to 2025
- Base Year: 2025
- Forecast Data until 2032
- Key Performance Indicators Impacting the Market
- Major Upcoming Developments and Projects
Key Highlights of the Report:
- Kenya Tables Market Outlook
- Market Size of Kenya Tables Market, 2025
- Forecast of Kenya Tables Market, 2032F
- Historical Data and Forecast of Kenya Tables Revenues & Volume for the Period 2022-2032F
- Kenya Tables Market Trend Evolution
- Kenya Tables Market Drivers and Challenges
- Kenya Tables Price Trends
- Kenya Tables Porter's Five Forces
- Kenya Tables Industry Life Cycle
- Historical Data and Forecast of Kenya Tables Market Revenues & Volume By Types for the Period 2022-2032F
- Historical Data and Forecast of Kenya Tables Market Revenues & Volume By Fabric for the Period 2022-2032F
- Historical Data and Forecast of Kenya Tables Market Revenues & Volume By Leather for the Period 2022-2032F
- Historical Data and Forecast of Kenya Tables Market Revenues & Volume By Metal for the Period 2022-2032F
- Historical Data and Forecast of Kenya Tables Market Revenues & Volume By Wooden for the Period 2022-2032F
- Historical Data and Forecast of Kenya Tables Market Revenues & Volume By Others for the Period 2022-2032F
- Historical Data and Forecast of Kenya Tables Market Revenues & Volume By Applications for the Period 2022-2032F
- Historical Data and Forecast of Kenya Tables Market Revenues & Volume By Family for the Period 2022-2032F
- Historical Data and Forecast of Kenya Tables Market Revenues & Volume By Office for the Period 2022-2032F
- Historical Data and Forecast of Kenya Tables Market Revenues & Volume By Others for the Period 2022-2032F
- Kenya Tables Import Export Trade Statistics
- Market Opportunity Assessment By Types
- Market Opportunity Assessment By Applications
- Kenya Tables Top Companies Market Share
- Kenya Tables Competitive Benchmarking By Technical and Operational Parameters
- Kenya Tables Company Profiles
- Kenya Tables Key Strategic Recommendations
Frequently Asked Questions About the Market Study (FAQs):
Dining tables, coffee tables, and multifunctional tables are among the most sought-after products, catering to diverse consumer needs.
Urbanization drives demand for stylish furniture solutions that fit modern living spaces, influencing consumer preferences and purchasing behaviors.
Key trends include the shift toward sustainable materials, the demand for multifunctional designs, and the popularity of minimalist aesthetics.
The government is implementing policies to enhance product quality, protect local manufacturers, and promote sustainability in the furniture sector.
6Wresearch actively monitors the Kenya Tables Market and publishes its comprehensive annual report, highlighting emerging trends, growth drivers, revenue analysis, and forecast outlook. Our insights help businesses to make data-backed strategic decisions with ongoing market dynamics. Our analysts track relevent industries related to the Kenya Tables Market, allowing our clients with actionable intelligence and reliable forecasts tailored to emerging regional needs.
Yes, we provide customisation as per your requirements. To learn more, feel free to contact us on sales@6wresearch.com
1 Executive Summary |
2 Introduction |
2.1 Key Highlights of the Report |
2.2 Report Description |
2.3 Market Scope & Segmentation |
2.4 Research Methodology |
2.5 Assumptions |
3 Kenya Tables Market Overview |
3.1 Kenya Country Macro Economic Indicators |
3.2 Kenya Tables Market Revenues & Volume, 2022 & 2032F |
3.3 Kenya Tables Market - Industry Life Cycle |
3.4 Kenya Tables Market - Porter's Five Forces |
3.5 Kenya Tables Market Revenues & Volume Share, By Types, 2022 & 2032F |
3.6 Kenya Tables Market Revenues & Volume Share, By Applications, 2022 & 2032F |
4 Kenya Tables Market Dynamics |
4.1 Impact Analysis |
4.2 Market Drivers |
4.3 Market Restraints |
5 Kenya Tables Market Trends |
6 Kenya Tables Market, By Types |
6.1 Kenya Tables Market, By Types |
6.1.1 Overview and Analysis |
6.1.2 Kenya Tables Market Revenues & Volume, By Types, 2022-2032F |
6.1.3 Kenya Tables Market Revenues & Volume, By Fabric, 2022-2032F |
6.1.4 Kenya Tables Market Revenues & Volume, By Leather, 2022-2032F |
6.1.5 Kenya Tables Market Revenues & Volume, By Metal, 2022-2032F |
6.1.6 Kenya Tables Market Revenues & Volume, By Wooden, 2022-2032F |
6.1.7 Kenya Tables Market Revenues & Volume, By Others, 2022-2032F |
6.2 Kenya Tables Market, By Applications |
6.2.1 Overview and Analysis |
6.2.2 Kenya Tables Market Revenues & Volume, By Family, 2022-2032F |
6.2.3 Kenya Tables Market Revenues & Volume, By Office, 2022-2032F |
6.2.4 Kenya Tables Market Revenues & Volume, By Others, 2022-2032F |
7 Kenya Tables Market Import-Export Trade Statistics |
7.1 Kenya Tables Market Export to Major Countries |
7.2 Kenya Tables Market Imports from Major Countries |
8 Kenya Tables Market Key Performance Indicators |
9 Kenya Tables Market - Opportunity Assessment |
9.1 Kenya Tables Market Opportunity Assessment, By Types, 2022 & 2032F |
9.2 Kenya Tables Market Opportunity Assessment, By Applications, 2022 & 2032F |
10 Kenya Tables Market - Competitive Landscape |
10.1 Kenya Tables Market Revenue Share, By Companies, 2025 |
10.2 Kenya Tables Market Competitive Benchmarking, By Operating and Technical Parameters |
11 Company Profiles |
12 Recommendations |
13 Disclaimer |
Global Go To Market Strategy - 2030
Export potential enables firms to identify high-growth global markets with greater confidence by combining advanced trade intelligence with a structured quantitative methodology. The framework analyzes emerging demand trends and country-level import patterns while integrating macroeconomic and trade datasets such as GDP and population forecasts, bilateral import–export flows, tariff structures, elasticity differentials between developed and developing economies, geographic distance, and import demand projections. Using weighted trade values from 2020–2024 as the base period to project country-to-country export potential for 2030, these inputs are operationalized through calculated drivers such as gravity model parameters, tariff impact factors, and projected GDP per-capita growth. Through an analysis of hidden potentials, demand hotspots, and market conditions that are most favorable to success, this method enables firms to focus on target countries, maximize returns, and global expansion with data, backed by accuracy.
By factoring in the projected importer demand gap that is currently unmet and could be potential opportunity, it identifies the potential for the Exporter (Country) among 190 countries, against the general trade analysis, which identifies the biggest importer or exporter.
To discover high-growth global markets and optimize your business strategy:
Click Here
Pricing
- Single User License$ 1,995
- Department License$ 2,400
- Site License$ 3,120
- Global License$ 3,795

Leadership Perspectives from Industry Events
Search
Thought Leadership and Analyst Meet


Our Clients
6WResearch In News
- India Air Conditioner Market Set for Strong Rebound in 2026 After Weather-Led Correction and GST-Driven Recovery: 6Wresearch
- ADAS in India: How Automatic Emergency Braking, Blind Spot Detection & Driver Monitoring are Transforming Road Safety
- Doha a strategic location for EV manufacturing hub: IPA Qatar
- Demand for luxury TVs surging in the GCC, says Samsung
- Empowering Growth: The Thriving Journey of Bangladesh’s Cable Industry
- Demand for luxury TVs surging in the GCC, says Samsung
Latest Reports
- Nicaragua RPG Gaming Market (2026-2032)
- New Zealand RPG Gaming Market (2026-2032)
- Netherlands RPG Gaming Market (2026-2032)
- Nauru RPG Gaming Market (2026-2032)
- Namibia RPG Gaming Market (2026-2032)
- Mozambique RPG Gaming Market (2026-2032)
- Montenegro RPG Gaming Market (2026-2032)
- Mongolia RPG Gaming Market (2026-2032)
- Monaco RPG Gaming Market (2026-2032)
- Micronesia RPG Gaming Market (2026-2032)
Industry Events and Analyst Meet

HIMTEX 2026

India Refining Summit 2026

India EV Show 2026

EV tech India Expo 2026

Auto Tech Asia 2026
Whitepaper
- Middle East & Africa Commercial Security Market Click here to view more.
- Middle East & Africa Fire Safety Systems & Equipment Market Click here to view more.
- GCC Drone Market Click here to view more.
- Middle East Lighting Fixture Market Click here to view more.
- GCC Physical & Perimeter Security Market Click here to view more.