Kenya Wear Plates Market (2026-2032) Outlook | Share, Analysis, Industry, Growth, Revenue, Trends, Value, Companies, Size & Forecast
Market Forecast By Material Type (Mild Steel, Hardox, Abrasion Resistant Grade, Flame Hardened Grade, Austenitic Stainless Steel, Duplex, Niobium Carbide, Alloys), By Plate Thickness (3 to 6 mm, 6 to 10 mm, 10 to 15 mm, 15 to 20 mm, 20 to 25 mm, 25 to 50 mm, 60 to 120 mm, 120 to 150 mm), By End Use (Mining, Power Generation, Cement & Refractories, Sugar, Off-Road Construction & Earthmoving Equipment, Waste Management, Pulp & Paper, Chemicals) And Competitive Landscape
| Product Code: ETC424966 | Publication Date: Oct 2022 | Updated Date: Jul 2026 | Product Type: Market Research Report | |
| Publisher: 6Wresearch | Author: Summon Dutta | No. of Pages: 75 | No. of Figures: 35 | No. of Tables: 20 |
Kenya Wear Plates Market Size, Share & Growth Rate
The Kenya Wear Plates Market was estimated at USD 790 Million in 2025 and is projected to reach USD 1126 Million by 2032, growing at a CAGR of 5.2% from 2026 to 2032. This growth trajectory is driven by the rapid expansion of industrial sectors, particularly mining and construction, which are increasingly recognizing the value of wear plates in prolonging equipment life and minimizing downtime. Additionally, the trend towards customization in wear plate production is also elevating market dynamics, as companies seek tailored solutions for specific machinery needs.
Kenya Wear Plates Market Year-wise Growth Rate and Key Drivers
This graph highlights how the Kenya Wear Plates Market has steadily grown over the years, supported by major growth factors.
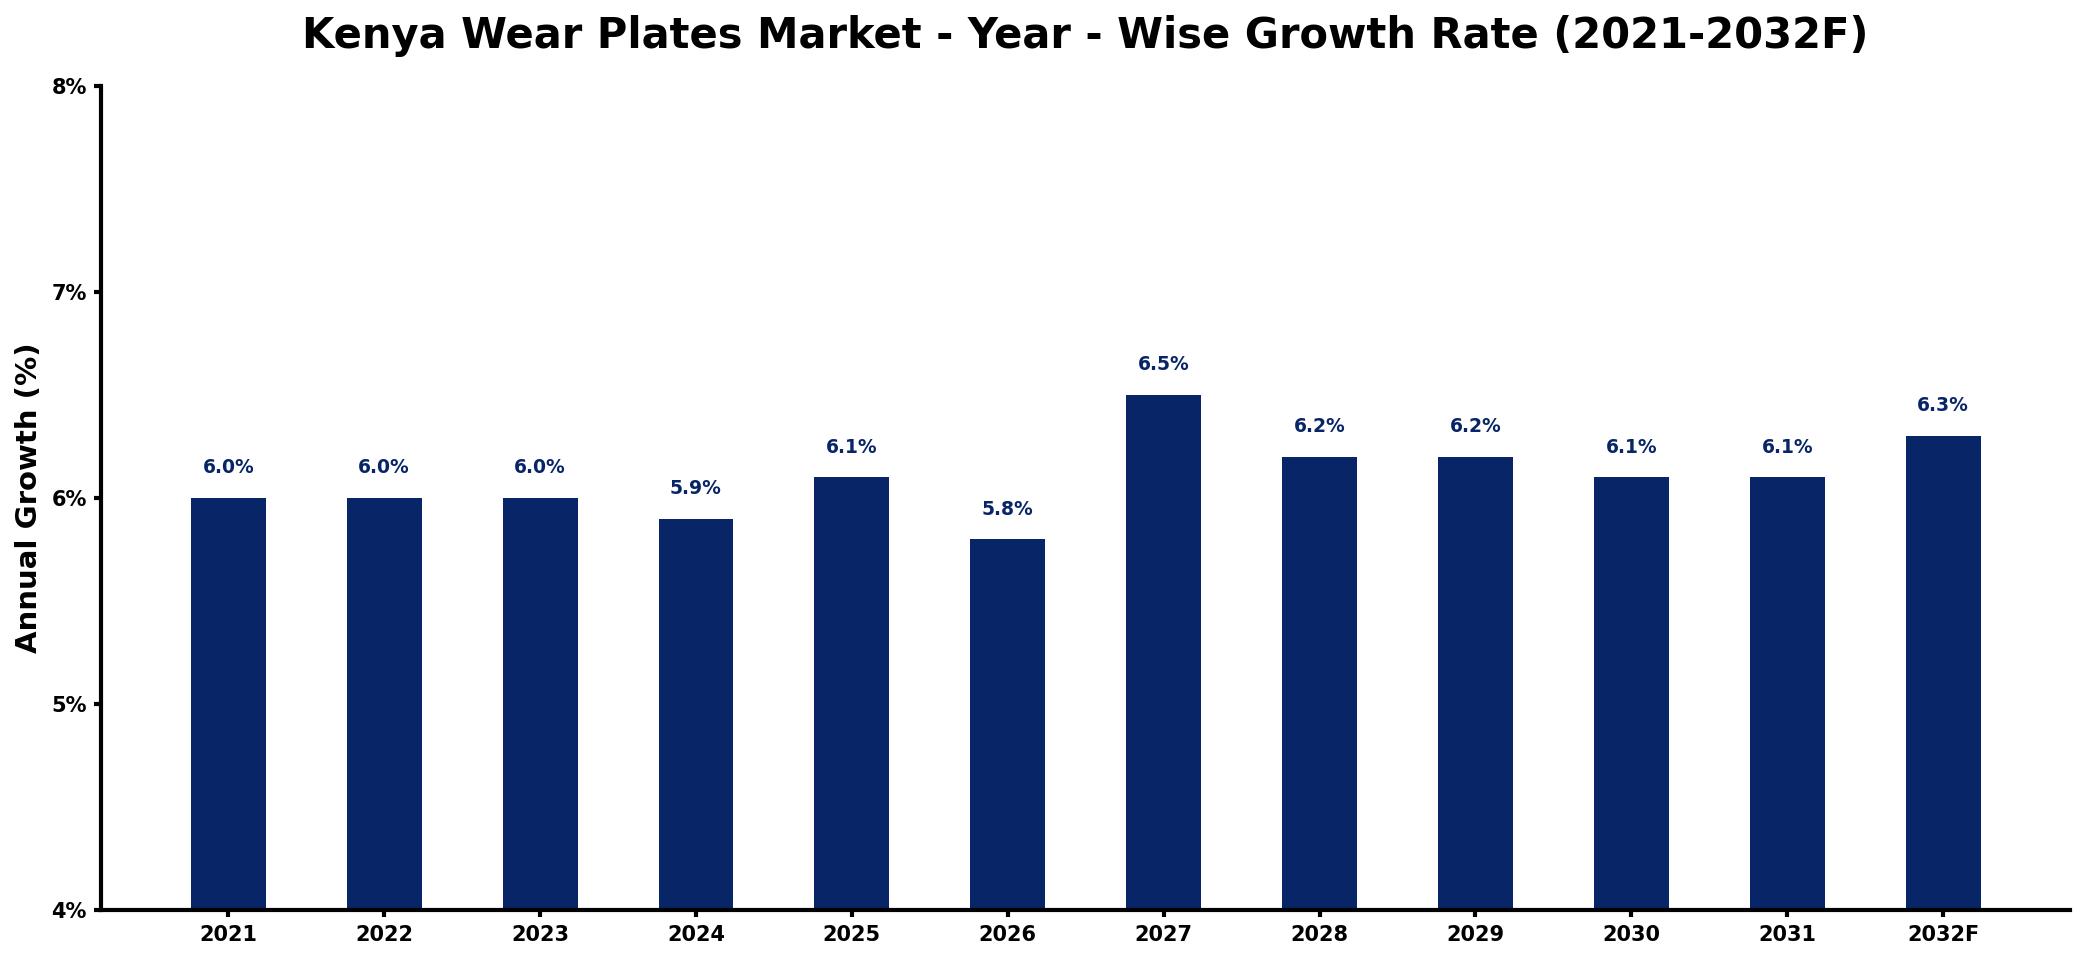
The table below presents the year‑wise growth rates along with the key drivers influencing the market
| Year | Growth Rate | Major Drivers |
| 2021 | 6.0% | Rising construction sector investments |
| 2022 | 6.0% | Increased mining activities demand |
| 2023 | 6.0% | Growing industrial machinery requirements |
| 2024 | 5.9% | Expansion of transportation infrastructure |
| 2025 | 6.1% | Surge in agricultural machinery usage |
| 2026 | 5.8% | Development of renewable energy projects |
| 2027 | 6.5% | Boost in manufacturing sector output |
| 2028 | 6.2% | Demand from heavy-duty applications |
| 2029 | 6.2% | Growth in logistics and transportation |
| 2030 | 6.1% | Increased government infrastructure spending |
| 2031 | 6.1% | growing automotive sector requirements |
| 2032 | 6.3% | Rising demand for construction equipment |
Note: Market size estimations and growth projections presented in this report are based on 6Wresearch's proprietary forecasting methodology, utilizing the latest available industry data, government publications, and primary research inputs.
Kenya Wear Plates Market Synopsis
In Kenya, the demand for wear plates is significantly influenced by the burgeoning mining sector, which requires high-performance materials to withstand harsh operational conditions. This sector, along with growing construction activities, underscores the need for durable components that can mitigate wear and tear on essential equipment.
Local manufacturers are increasingly diversifying their product offerings, with a focus on materials such as chromium carbide and tungsten carbide, tailored to meet varied industry specifications. As the market evolves, quality and innovation are becoming critical factors for companies striving to maintain a competitive edge.
Kenya Wear Plates Market Key Takeaways
- The market is poised for steady growth, driven by increased industrial activity.
- Customization is key, with companies offering tailored wear plates for specific applications.
- Focus on sustainability is influencing material choices and manufacturing processes.
- Intense competition exists from lower-cost imports, challenging local manufacturers.
- Investment in R&D is crucial for innovation and meeting evolving market demands.
Evaluation of Restraints in Kenya Wear Plates Market
The Kenya Wear Plates Market is currently facing significant hurdles that could hinder its potential for growth. A primary concern is the influx of low-quality imported products, which often undercut local manufacturers' pricing, compelling them to adjust their strategies to remain competitive. Fluctuating raw material costs and supply chain issues also pose challenges, impacting overall production capabilities and pricing structures. Furthermore, local manufacturers often struggle with limited access to advanced technologies that would improve product quality, while logistical constraints in transportation and distribution complicate market accessibility. Addressing these issues will be critical for stakeholders aiming to sustain growth in this dynamic market.
Kenya Wear Plates Market Trends
The Kenya Wear Plates Market is witnessing notable trends that are shaping its landscape. A significant shift towards the adoption of advanced materials, such as high-hardness composites, is occurring to enhance the performance and longevity of wear plates. Alongside this, there is an increasing demand for customized solutions that address specific operational requirements, fostering a market environment rich in product innovation. Moreover, sustainability is becoming a driving force, as manufacturers explore recycled materials and eco-friendly processes that not only cater to consumer preferences but also comply with evolving regulatory standards.
Kenya Wear Plates Market Opportunities
The Kenya Wear Plates Market offers compelling opportunities for investment and growth. As infrastructure projects continue to expand across the nation, the demand for robust wear plates is set to increase, particularly in the construction and mining sectors. Investors can look to capitalize on this trend by supporting local manufacturers and suppliers focusing on innovation and quality. Furthermore, advancements in wear plate technologies, including new materials and coatings designed for enhanced durability, create pathways for differentiation and competitive advantage. The aftermarket service segment is also ripe for growth, offering additional avenues for revenue generation.
Government Initiatives in the Kenya Wear Plates Market
The Kenyan government has launched several initiatives to bolster the Wear Plates Market. The Buy Kenya, Build Kenya initiative is aimed at promoting local manufacturing, ensuring that Kenyan products receive priority in public procurement. This is coupled with regulatory measures from the Kenya Bureau of Standards (KEBS) that aim to uphold quality and safety standards in wear plate production. Financial incentives, such as tax breaks and access to funding programs, have also been introduced to encourage investment in this sector, ultimately fostering a robust manufacturing environment.
Future Insights of the Kenya Wear Plates Market
The outlook for the Kenya Wear Plates Market between 2026 and 2032 appears highly promising. As the industrial sector expands further and the construction landscape evolves, the demand for high-quality wear plates is expected to grow significantly. Continued advancements in materials technology will likely lead to the development of wear plates with enhanced performance characteristics, driving further innovation. Stakeholders are anticipated to invest in R&D to meet the ever-changing needs of various industries, reinforcing the market's growth trajectory in the coming years.
Kenya Wear Plates Market Latest Developments (2025 - 2026)
Recent developments in the Kenya Wear Plates Market have highlighted a significant trend toward greater collaboration between manufacturers and end-users. This partnership approach is aimed at improving product offerings and tailoring solutions to specific operational challenges. Additionally, some manufacturers are focusing on integrating advanced technologies into their production processes to enhance the durability and effectiveness of wear plates. These initiatives reflect a broader commitment within the market to innovate and adapt to changing customer demands.
Kenya Wear Plates Market - Key Attractiveness of the Report
- 10 Years of Market Numbers
- Historical Data Starting from 2022 to 2025
- Base Year: 2025
- Forecast Data until 2032
- Key Performance Indicators Impacting the Market
- Major Upcoming Developments and Projects
Key Highlights of the Report:
- Kenya Wear Plates Market Outlook
- Market Size of Kenya Wear Plates Market, 2025
- Forecast of Kenya Wear Plates Market, 2032
- Historical Data and Forecast of Kenya Wear Plates Revenues & Volume for the Period 2022-2032F
- Kenya Wear Plates Market Trend Evolution
- Kenya Wear Plates Market Drivers and Challenges
- Kenya Wear Plates Price Trends
- Kenya Wear Plates Porter's Five Forces
- Kenya Wear Plates Industry Life Cycle
- Historical Data and Forecast of Kenya Wear Plates Market Revenues & Volume By Material Type for the Period 2022-2032F
- Historical Data and Forecast of Kenya Wear Plates Market Revenues & Volume By Mild Steel for the Period 2022-2032F
- Historical Data and Forecast of Kenya Wear Plates Market Revenues & Volume By Hardox for the Period 2022-2032F
- Historical Data and Forecast of Kenya Wear Plates Market Revenues & Volume By Abrasion Resistant Grade for the Period 2022-2032F
- Historical Data and Forecast of Kenya Wear Plates Market Revenues & Volume By Flame Hardened Grade for the Period 2022-2032F
- Historical Data and Forecast of Kenya Wear Plates Market Revenues & Volume By Austenitic Stainless Steel for the Period 2022-2032F
- Historical Data and Forecast of Kenya Wear Plates Market Revenues & Volume By Duplex for the Period 2022-2032F
- Historical Data and Forecast of Kenya Wear Plates Market Revenues & Volume By Niobium Carbide for the Period 2022-2032F
- Historical Data and Forecast of Kenya Mild Steel Wear Plates Market Revenues & Volume By Alloys for the Period 2022-2032F
- Historical Data and Forecast of Kenya Wear Plates Market Revenues & Volume By Plate Thickness for the Period 2022-2032F
- Historical Data and Forecast of Kenya Wear Plates Market Revenues & Volume By 3 to 6 mm for the Period 2022-2032F
- Historical Data and Forecast of Kenya Wear Plates Market Revenues & Volume By 6 to 10 mm for the Period 2022-2032F
- Historical Data and Forecast of Kenya Wear Plates Market Revenues & Volume By 10 to 15 mm for the Period 2022-2032F
- Historical Data and Forecast of Kenya Wear Plates Market Revenues & Volume By 15 to 20 mm for the Period 2022-2032F
- Historical Data and Forecast of Kenya Wear Plates Market Revenues & Volume By 20 to 25 mm for the Period 2022-2032F
- Historical Data and Forecast of Kenya Wear Plates Market Revenues & Volume By 25 to 50 mm for the Period 2022-2032F
- Historical Data and Forecast of Kenya Wear Plates Market Revenues & Volume By 60 to 120 mm for the Period 2022-2032F
- Historical Data and Forecast of Kenya Wear Plates Market Revenues & Volume By 120 to 150 mm for the Period 2022-2032F
- Historical Data and Forecast of Kenya Wear Plates Market Revenues & Volume By End Use for the Period 2022-2032F
- Historical Data and Forecast of Kenya Wear Plates Market Revenues & Volume By Mining for the Period 2022-2032F
- Historical Data and Forecast of Kenya Wear Plates Market Revenues & Volume By Power Generation for the Period 2022-2032F
- Historical Data and Forecast of Kenya Wear Plates Market Revenues & Volume By Cement & Refractories for the Period 2022-2032F
- Historical Data and Forecast of Kenya Wear Plates Market Revenues & Volume By Sugar for the Period 2022-2032F
- Historical Data and Forecast of Kenya Wear Plates Market Revenues & Volume By Off-Road Construction & Earthmoving Equipment for the Period 2022-2032F
- Historical Data and Forecast of Kenya Wear Plates Market Revenues & Volume By Waste Management for the Period 2022-2032F
- Historical Data and Forecast of Kenya Wear Plates Market Revenues & Volume By Pulp & Paper for the Period 2022-2032F
- Historical Data and Forecast of Kenya Wear Plates Market Revenues & Volume By Chemicals for the Period 2022-2032F
- Kenya Wear Plates Import Export Trade Statistics
- Market Opportunity Assessment By Material Type
- Market Opportunity Assessment By Plate Thickness
- Market Opportunity Assessment By End Use
- Kenya Wear Plates Top Companies Market Share
- Kenya Wear Plates Competitive Benchmarking By Technical and Operational Parameters
- Kenya Wear Plates Company Profiles
- Kenya Wear Plates Key Strategic Recommendations
Frequently Asked Questions About the Market Study (FAQs):
The Kenya Wear Plates Market is estimated to be valued at USD 790 Million in 2025, with projections indicating it will reach USD 1126 Million by 2032.
The Kenyan government has implemented several initiatives, including the Buy Kenya, Build Kenya initiative, which promotes local manufacturing, as well as quality regulations enforced by the Kenya Bureau of Standards.
Customization is increasingly important, as it allows manufacturers to produce wear plates that specifically meet the unique requirements of various machinery and equipment, thereby enhancing performance and longevity.
The mining and construction sectors are the primary consumers, as they require durable wear plates to protect their machinery from significant abrasion and impact during operations.
Local manufacturers contend with intense competition from cheap imports, fluctuating raw material prices, and logistical challenges that impact their pricing and production capabilities.
6Wresearch actively monitors the Kenya Wear Plates Market and publishes its comprehensive annual report, highlighting emerging trends, growth drivers, revenue analysis, and forecast outlook. Our insights help businesses to make data-backed strategic decisions with ongoing market dynamics. Our analysts track relevent industries related to the Kenya Wear Plates Market, allowing our clients with actionable intelligence and reliable forecasts tailored to emerging regional needs.
Yes, we provide customisation as per your requirements. To learn more, feel free to contact us on sales@6wresearch.com
1 Executive Summary |
2 Introduction |
2.1 Key Highlights of the Report |
2.2 Report Description |
2.3 Market Scope & Segmentation |
2.4 Research Methodology |
2.5 Assumptions |
3 Kenya Wear Plates Market Overview |
3.1 Kenya Country Macro Economic Indicators |
3.2 Kenya Wear Plates Market Revenues & Volume, 2022 & 2032F |
3.3 Kenya Wear Plates Market - Industry Life Cycle |
3.4 Kenya Wear Plates Market - Porter's Five Forces |
3.5 Kenya Wear Plates Market Revenues & Volume Share, By Material Type, 2022 & 2032F |
3.6 Kenya Wear Plates Market Revenues & Volume Share, By Plate Thickness, 2022 & 2032F |
3.7 Kenya Wear Plates Market Revenues & Volume Share, By End Use, 2022 & 2032F |
4 Kenya Wear Plates Market Dynamics |
4.1 Impact Analysis |
4.2 Market Drivers |
4.2.1 Growth in construction and infrastructure development projects in Kenya |
4.2.2 Increasing demand for wear plates in the mining and quarrying industry |
4.2.3 Rising focus on industrial safety and maintenance practices |
4.3 Market Restraints |
4.3.1 High initial investment required for wear plates |
4.3.2 Limited awareness and adoption of advanced wear plate technologies in Kenya |
4.3.3 Fluctuations in raw material prices impacting manufacturing costs |
5 Kenya Wear Plates Market Trends |
6 Kenya Wear Plates Market, By Types |
6.1 Kenya Wear Plates Market, By Material Type |
6.1.1 Overview and Analysis |
6.1.2 Kenya Wear Plates Market Revenues & Volume, By Material Type, 2022-2032F |
6.1.3 Kenya Wear Plates Market Revenues & Volume, By Mild Steel, 2022-2032F |
6.1.4 Kenya Wear Plates Market Revenues & Volume, By Hardox, 2022-2032F |
6.1.5 Kenya Wear Plates Market Revenues & Volume, By Abrasion Resistant Grade, 2022-2032F |
6.1.6 Kenya Wear Plates Market Revenues & Volume, By Flame Hardened Grade, 2022-2032F |
6.1.7 Kenya Wear Plates Market Revenues & Volume, By Austenitic Stainless Steel, 2022-2032F |
6.1.8 Kenya Wear Plates Market Revenues & Volume, By Duplex, 2022-2032F |
6.1.9 Kenya Wear Plates Market Revenues & Volume, By Alloys, 2022-2032F |
6.1.10 Kenya Wear Plates Market Revenues & Volume, By Alloys, 2022-2032F |
6.2 Kenya Wear Plates Market, By Plate Thickness |
6.2.1 Overview and Analysis |
6.2.2 Kenya Wear Plates Market Revenues & Volume, By 3 to 6 mm, 2022-2032F |
6.2.3 Kenya Wear Plates Market Revenues & Volume, By 6 to 10 mm, 2022-2032F |
6.2.4 Kenya Wear Plates Market Revenues & Volume, By 10 to 15 mm, 2022-2032F |
6.2.5 Kenya Wear Plates Market Revenues & Volume, By 15 to 20 mm, 2022-2032F |
6.2.6 Kenya Wear Plates Market Revenues & Volume, By 20 to 25 mm, 2022-2032F |
6.2.7 Kenya Wear Plates Market Revenues & Volume, By 25 to 50 mm, 2022-2032F |
6.2.8 Kenya Wear Plates Market Revenues & Volume, By 120 to 150 mm, 2022-2032F |
6.2.9 Kenya Wear Plates Market Revenues & Volume, By 120 to 150 mm, 2022-2032F |
6.3 Kenya Wear Plates Market, By End Use |
6.3.1 Overview and Analysis |
6.3.2 Kenya Wear Plates Market Revenues & Volume, By Mining, 2022-2032F |
6.3.3 Kenya Wear Plates Market Revenues & Volume, By Power Generation, 2022-2032F |
6.3.4 Kenya Wear Plates Market Revenues & Volume, By Cement & Refractories, 2022-2032F |
6.3.5 Kenya Wear Plates Market Revenues & Volume, By Sugar, 2022-2032F |
6.3.6 Kenya Wear Plates Market Revenues & Volume, By Off-Road Construction & Earthmoving Equipment, 2022-2032F |
6.3.7 Kenya Wear Plates Market Revenues & Volume, By Waste Management, 2022-2032F |
6.3.8 Kenya Wear Plates Market Revenues & Volume, By Chemicals, 2022-2032F |
6.3.9 Kenya Wear Plates Market Revenues & Volume, By Chemicals, 2022-2032F |
7 Kenya Wear Plates Market Import-Export Trade Statistics |
7.1 Kenya Wear Plates Market Export to Major Countries |
7.2 Kenya Wear Plates Market Imports from Major Countries |
8 Kenya Wear Plates Market Key Performance Indicators |
8.1 Overall equipment effectiveness (OEE) of wear plates in key industries |
8.2 Percentage of wear plate utilization in construction and mining sectors |
8.3 Rate of adoption of wear plate innovations and technologies by Kenyan industries |
9 Kenya Wear Plates Market - Opportunity Assessment |
9.1 Kenya Wear Plates Market Opportunity Assessment, By Material Type, 2022 & 2032F |
9.2 Kenya Wear Plates Market Opportunity Assessment, By Plate Thickness, 2022 & 2032F |
9.3 Kenya Wear Plates Market Opportunity Assessment, By End Use, 2022 & 2032F |
10 Kenya Wear Plates Market - Competitive Landscape |
10.1 Kenya Wear Plates Market Revenue Share, By Companies, 2025 |
10.2 Kenya Wear Plates Market Competitive Benchmarking, By Operating and Technical Parameters |
11 Company Profiles |
12 Recommendations |
13 Disclaimer |
Global Go To Market Strategy - 2030
Export potential enables firms to identify high-growth global markets with greater confidence by combining advanced trade intelligence with a structured quantitative methodology. The framework analyzes emerging demand trends and country-level import patterns while integrating macroeconomic and trade datasets such as GDP and population forecasts, bilateral import–export flows, tariff structures, elasticity differentials between developed and developing economies, geographic distance, and import demand projections. Using weighted trade values from 2020–2024 as the base period to project country-to-country export potential for 2030, these inputs are operationalized through calculated drivers such as gravity model parameters, tariff impact factors, and projected GDP per-capita growth. Through an analysis of hidden potentials, demand hotspots, and market conditions that are most favorable to success, this method enables firms to focus on target countries, maximize returns, and global expansion with data, backed by accuracy.
By factoring in the projected importer demand gap that is currently unmet and could be potential opportunity, it identifies the potential for the Exporter (Country) among 190 countries, against the general trade analysis, which identifies the biggest importer or exporter.
To discover high-growth global markets and optimize your business strategy:
Click Here
Pricing
- Single User License$ 1,995
- Department License$ 2,400
- Site License$ 3,120
- Global License$ 3,795

Leadership Perspectives from Industry Events
Search
Thought Leadership and Analyst Meet


Our Clients
6WResearch In News
- India Air Conditioner Market Set for Strong Rebound in 2026 After Weather-Led Correction and GST-Driven Recovery: 6Wresearch
- ADAS in India: How Automatic Emergency Braking, Blind Spot Detection & Driver Monitoring are Transforming Road Safety
- Doha a strategic location for EV manufacturing hub: IPA Qatar
- Demand for luxury TVs surging in the GCC, says Samsung
- Empowering Growth: The Thriving Journey of Bangladesh’s Cable Industry
- Demand for luxury TVs surging in the GCC, says Samsung
Latest Reports
- Nicaragua RPG Gaming Market (2026-2032)
- New Zealand RPG Gaming Market (2026-2032)
- Netherlands RPG Gaming Market (2026-2032)
- Nauru RPG Gaming Market (2026-2032)
- Namibia RPG Gaming Market (2026-2032)
- Mozambique RPG Gaming Market (2026-2032)
- Montenegro RPG Gaming Market (2026-2032)
- Mongolia RPG Gaming Market (2026-2032)
- Monaco RPG Gaming Market (2026-2032)
- Micronesia RPG Gaming Market (2026-2032)
Industry Events and Analyst Meet

EV India Expo 2026

HIMTEX 2026

India Refining Summit 2026

India EV Show 2026

EV tech India Expo 2026
Whitepaper
- Middle East & Africa Commercial Security Market Click here to view more.
- Middle East & Africa Fire Safety Systems & Equipment Market Click here to view more.
- GCC Drone Market Click here to view more.
- Middle East Lighting Fixture Market Click here to view more.
- GCC Physical & Perimeter Security Market Click here to view more.