Kenya Windows Market (2026-2032) | Analysis, Trends, Revenue, Share, Size, Growth, Value, Outlook, Forecast, Companies & Industry
Market Forecast By Material (uPVC, Wood, Metal, Others), By Application (Residential, Commercial) And Competitive Landscape
| Product Code: ETC021250 | Publication Date: Oct 2020 | Updated Date: Jun 2026 | Product Type: Report | |
| Publisher: 6Wresearch | Author: Ravi Bhandari | No. of Pages: 70 | No. of Figures: 35 | No. of Tables: 5 |
Kenya Windows Market Summary
The kenya windows market was estimated at USD 478 Million in 2025 and is projected to reach USD 630 Million by 2032, growing at a CAGR of 4.9% from 2026 to 2032.
Kenya Windows Market Growth Rate Analysis (2021-2032)
The Kenya windows market has experienced a stable growth trajectory, with notable yearly increases such as 4.4% in 2021 and peaking at 5.0% expected in both 2024 and 2032. Key factors contributing to this upward trend include rising consumer demand for energy-efficient solutions amid an ongoing focus on sustainability. The government's favorable policies promoting green building practices have further catalyzed investments in innovative window technologies. Despite minor fluctuations, such as a dip to 4.3% in 2027, the market maintains robust growth due to consistent infrastructure development and the digitalization of sales channels, which enhance consumer access to a broader array of window options.
Kenya Windows Market Year-wise Growth Rate and Key Drivers
This graph highlights how the Kenya Windows Market has steadily grown over the past five years, supported by major growth factors.
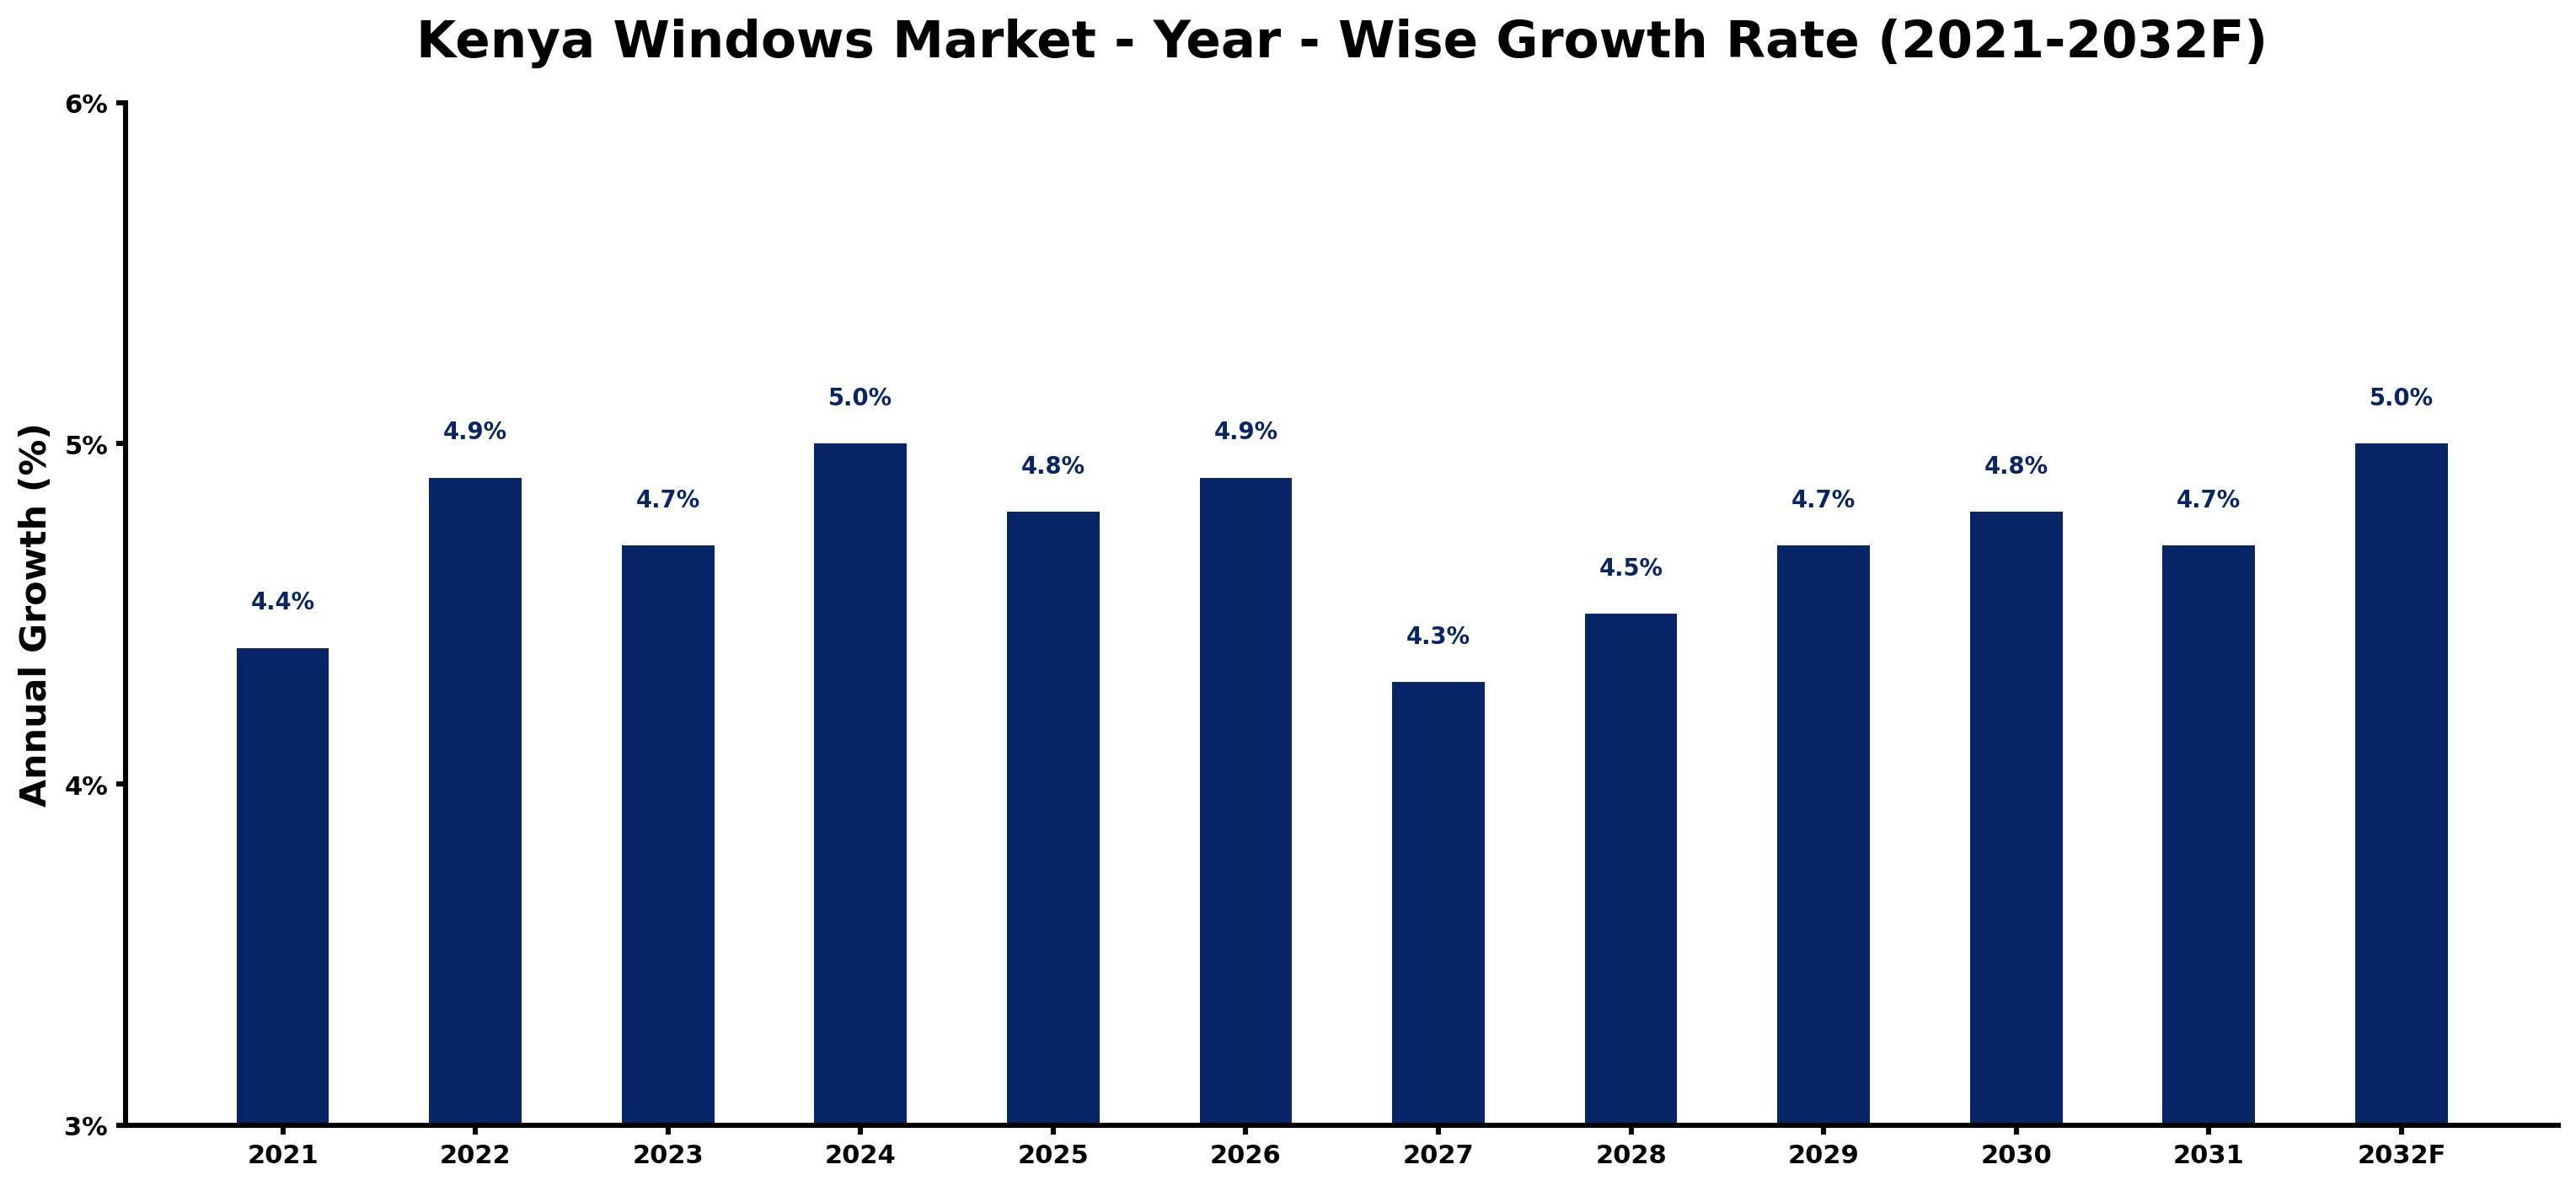
The table below presents the year wise growth rates along with the key drivers influencing the market
| Year | Growth Rate | Major Drivers |
| 2021 | 4.4% | Post-pandemic recovery has stimulated housing projects across urban Kenya, boosting construction activities. |
| 2022 | 4.9% | The influx of foreign investment has enhanced the quality of building materials available locally. |
| 2023 | 4.7% | Increased urban migration leads to higher demand for affordable housing solutions in Nairobi. |
| 2024 | 5.0% | Technological advancements in window manufacturing have improved energy efficiency and designs. |
| 2025 | 4.8% | Infrastructure developments in major cities create a favorable environment for new residential projects. |
| 2026 | 4.9% | Growing awareness of sustainable building practices encourages the use of eco-friendly windows. |
| 2027 | 4.3% | Market diversification strategies by local manufacturers are paving the way for innovative designs. |
| 2028 | 4.5% | Rising disposable incomes among middle-class households expand access to premium window options. |
| 2029 | 4.7% | Digitalization within the construction sector enhances procurement processes for window manufacturers. |
| 2030 | 4.8% | Increased competition leads to improved pricing strategies, benefiting consumers in urban areas. |
| 2031 | 4.7% | Partnerships between local firms and international brands enhance product offerings in the market. |
| 2032 | 5.0% | Emerging smart home trends inspire demand for advanced window technology, boosting sales. |
Note - Market size estimations and growth projections presented in this report are based on 6Wresearch's advanced forecasting approach, validated with industry datasets as of June 2026.
Kenya Windows Market Synopsis
The Kenya Windows Market is projected to reach 4.9% and witness significant growth during the forecast period (2026-2032). The market is currently bolstered by escalating construction activities and an increasing demand for energy-efficient building materials. Windows are integral to providing ventilation, natural lighting, and thermal comfort in buildings, making them a key component in both residential and commercial architecture.
Kenya Windows Market Growth Drivers
Several factors are contributing to the expansion of the Kenya windows market, reflecting broader construction trends and shifts in consumer preferences.
- The rapid urbanization in Kenya is driving the demand for new housing and commercial buildings, which in turn stimulates the windows market as integral components of construction.
- Technological advancements in window design and materials are enhancing the performance of windows, making them more appealing due to improved energy efficiency and sound insulation.
- The rising consumer awareness regarding sustainability is prompting builders and homeowners to prioritize energy-efficient windows, thereby increasing their adoption.
- Government initiatives aimed at promoting energy efficiency and sustainable construction practices are bolstering the market context, as they often lead to increased investment in new projects.
- Increased focus on aesthetics and lifestyle improvements has led to innovations in window designs that cater to both functionality and visual appeal, appealing to a wider range of consumers.
Kenya Windows Market Challenges and Restraints
Despite the promising growth trajectory of the Kenya windows market, several impediments hinder its potential.
- The prevalence of low-cost alternative materials can deter consumers from investing in higher-quality, energy-efficient windows, affecting overall market value.
- Limited consumer awareness about the long-term benefits of energy-efficient windows continues to pose a challenge for market players aiming to promote their products.
- Regulatory challenges and inconsistent enforcement of standards can lead to quality discrepancies in the market, undermining consumer confidence.
- Economic fluctuations and inflation may impact consumer spending power, resulting in prioritization of immediate costs over long-term savings associated with energy-efficient windows.
- The need for skilled labor to install advanced window technologies can also act as a constraint, as the market may face shortages in qualified installation professionals.
Kenya Windows Market Government Investment and Initiatives
The Kenyan government actively fosters the growth of the windows market through various policies and initiatives aimed at advancing sustainable construction practices.
- Tax incentives for manufacturers engaging in local window production are designed to stimulate domestic manufacturing and reduce dependency on imports.
- Subsidies are offered for research and development efforts focused on innovative construction materials, including energy-efficient windows.
- Government-mandated standards ensure product quality and safety, fostering trust among consumers and encouraging investments in higher-quality products.
- Promotion of locally sourced materials is part of broader efforts to enhance local supply chains and boost employment opportunities within the construction sector.
- Integration of sustainability principles in government projects serves as a model for private sector initiatives, driving demand for energy-efficient windows.
Kenya Windows Market Latest Developments (May 2025 - June 2026)
Throughout the period from May 2025 to June 2026, the Kenya windows market has experienced several notable developments, reflecting the sector's response to evolving consumer and regulatory dynamics.
- There has been a marked increase in collaborations between industry stakeholders and research institutions aimed at developing innovative window technologies that enhance energy efficiency.
- A growing number of construction projects have begun prioritizing sustainable materials, leading to increased demand for energy-efficient windows that meet international standards.
- The government has continued to roll out initiatives designed to improve public awareness about the benefits of energy-efficient windows, which have led to gradual shifts in consumer purchasing behaviors.
- Regulatory changes have been introduced to streamline the approval process for new building projects, indirectly boosting the windows market as a consequence of increased construction activities.
- Consumer demand for customized window solutions has risen, prompting manufacturers to diversify their product offerings to meet unique architectural requirements.
Kenya Windows Market - Key Attractiveness of the Report
- 10 Years of Market Numbers
- Historical Data Starting from 2022 to 2025
- Base Year: 2025
- Forecast Data until 2032
- Key Performance Indicators Impacting the Market
- Major Upcoming Developments and Projects
Key Highlights of the Report:
- Kenya Windows Market Outlook
- Market Size of Kenya Windows Market, 2025
- Forecast of Kenya Windows Market, 2032
- Historical Data and Forecast of Kenya Windows Revenues & Volume for the Period 2022-2032F
- Kenya Windows Market Trend Evolution
- Kenya Windows Market Drivers and Challenges
- Kenya Windows Price Trends
- Kenya Windows Porter's Five Forces
- Kenya Windows Industry Life Cycle
- Historical Data and Forecast of Kenya Windows Market Revenues & Volume By Material for the Period 2022-2032F
- Historical Data and Forecast of Kenya Windows Market Revenues & Volume By uPVC for the Period 2022-2032F
- Historical Data and Forecast of Kenya Windows Market Revenues & Volume By Wood for the Period 2022-2032F
- Historical Data and Forecast of Kenya Windows Market Revenues & Volume By Metal for the Period 2022-2032F
- Historical Data and Forecast of Kenya Windows Market Revenues & Volume By Others for the Period 2022-2032F
- Historical Data and Forecast of Kenya Windows Market Revenues & Volume By Application for the Period 2022-2032F
- Historical Data and Forecast of Kenya Windows Market Revenues & Volume By Residential for the Period 2022-2032F
- Historical Data and Forecast of Kenya Windows Market Revenues & Volume By Commercial for the Period 2022-2032F
- Kenya Windows Import Export Trade Statistics
- Market Opportunity Assessment By Material
- Market Opportunity Assessment By Application
- Kenya Windows Top Companies Market Share
- Kenya Windows Competitive Benchmarking By Technical and Operational Parameters
- Kenya Windows Company Profiles
- Kenya Windows Key Strategic Recommendations
Frequently Asked Questions About the Market Study (FAQs):
The growth of the Kenya windows market is driven by increasing construction activities, demand for energy-efficient materials, and government initiatives that support local manufacturing.
Challenges include competition from low-cost alternatives, limited consumer awareness, regulatory inconsistencies, and economic fluctuations impacting spending.
The government supports the windows market through tax incentives for local production, subsidies for R&D, and promotion of quality standards and sustainable practices.
Recent developments include increased collaborations for innovative technologies, a focus on sustainable materials in new projects, and enhanced consumer awareness initiatives.
6Wresearch actively monitors the Kenya Windows Market and publishes its comprehensive annual report, highlighting emerging trends, growth drivers, revenue analysis, and forecast outlook. Our insights help businesses to make data-backed strategic decisions with ongoing market dynamics. Our analysts track relevent industries related to the Kenya Windows Market, allowing our clients with actionable intelligence and reliable forecasts tailored to emerging regional needs.
Yes, we provide customisation as per your requirements. To learn more, feel free to contact us on sales@6wresearch.com
1 Executive Summary |
2 Introduction |
2.1 Key Highlights of the Report |
2.2 Report Description |
2.3 Market Scope & Segmentation |
2.4 Research Methodology |
2.5 Assumptions |
3 Kenya Windows Market Overview |
3.1 Kenya Country Macro Economic Indicators |
3.2 Kenya Windows Market Revenues & Volume, 2022 & 2032F |
3.3 Kenya Windows Market - Industry Life Cycle |
3.4 Kenya Windows Market - Porter's Five Forces |
3.5 Kenya Windows Market Revenues & Volume Share, By Material, 2022 & 2032F |
3.6 Kenya Windows Market Revenues & Volume Share, By Application, 2022 & 2032F |
4 Kenya Windows Market Dynamics |
4.1 Impact Analysis |
4.2 Market Drivers |
4.3 Market Restraints |
5 Kenya Windows Market Trends |
6 Kenya Windows Market, By Types |
6.1 Kenya Windows Market, By Material |
6.1.1 Overview and Analysis |
6.1.2 Kenya Windows Market Revenues & Volume, By Material, 2022-2032F |
6.1.3 Kenya Windows Market Revenues & Volume, By uPVC, 2022-2032F |
6.1.4 Kenya Windows Market Revenues & Volume, By Wood, 2022-2032F |
6.1.5 Kenya Windows Market Revenues & Volume, By Metal, 2022-2032F |
6.1.6 Kenya Windows Market Revenues & Volume, By Others, 2022-2032F |
6.2 Kenya Windows Market, By Application |
6.2.1 Overview and Analysis |
6.2.2 Kenya Windows Market Revenues & Volume, By Residential, 2022-2032F |
6.2.3 Kenya Windows Market Revenues & Volume, By Commercial, 2022-2032F |
7 Kenya Windows Market Import-Export Trade Statistics |
7.1 Kenya Windows Market Export to Major Countries |
7.2 Kenya Windows Market Imports from Major Countries |
8 Kenya Windows Market Key Performance Indicators |
9 Kenya Windows Market - Opportunity Assessment |
9.1 Kenya Windows Market Opportunity Assessment, By Material, 2022 & 2032F |
9.2 Kenya Windows Market Opportunity Assessment, By Application, 2022 & 2032F |
10 Kenya Windows Market - Competitive Landscape |
10.1 Kenya Windows Market Revenue Share, By Companies, 2025 |
10.2 Kenya Windows Market Competitive Benchmarking, By Operating and Technical Parameters |
11 Company Profiles |
12 Recommendations |
13 Disclaimer |
Global Go To Market Strategy - 2030
Export potential enables firms to identify high-growth global markets with greater confidence by combining advanced trade intelligence with a structured quantitative methodology. The framework analyzes emerging demand trends and country-level import patterns while integrating macroeconomic and trade datasets such as GDP and population forecasts, bilateral import–export flows, tariff structures, elasticity differentials between developed and developing economies, geographic distance, and import demand projections. Using weighted trade values from 2020–2024 as the base period to project country-to-country export potential for 2030, these inputs are operationalized through calculated drivers such as gravity model parameters, tariff impact factors, and projected GDP per-capita growth. Through an analysis of hidden potentials, demand hotspots, and market conditions that are most favorable to success, this method enables firms to focus on target countries, maximize returns, and global expansion with data, backed by accuracy.
By factoring in the projected importer demand gap that is currently unmet and could be potential opportunity, it identifies the potential for the Exporter (Country) among 190 countries, against the general trade analysis, which identifies the biggest importer or exporter.
To discover high-growth global markets and optimize your business strategy:
Click Here
Pricing
- Single User License$ 1,995
- Department License$ 2,400
- Site License$ 3,120
- Global License$ 3,795

Leadership Perspectives from Industry Events
Search
Thought Leadership and Analyst Meet


Our Clients
6WResearch In News
- India Air Conditioner Market Set for Strong Rebound in 2026 After Weather-Led Correction and GST-Driven Recovery: 6Wresearch
- ADAS in India: How Automatic Emergency Braking, Blind Spot Detection & Driver Monitoring are Transforming Road Safety
- Doha a strategic location for EV manufacturing hub: IPA Qatar
- Demand for luxury TVs surging in the GCC, says Samsung
- Empowering Growth: The Thriving Journey of Bangladesh’s Cable Industry
- Demand for luxury TVs surging in the GCC, says Samsung
Latest Reports
- Nicaragua RPG Gaming Market (2026-2032)
- New Zealand RPG Gaming Market (2026-2032)
- Netherlands RPG Gaming Market (2026-2032)
- Nauru RPG Gaming Market (2026-2032)
- Namibia RPG Gaming Market (2026-2032)
- Mozambique RPG Gaming Market (2026-2032)
- Montenegro RPG Gaming Market (2026-2032)
- Mongolia RPG Gaming Market (2026-2032)
- Monaco RPG Gaming Market (2026-2032)
- Micronesia RPG Gaming Market (2026-2032)
Industry Events and Analyst Meet

HIMTEX 2026

India Refining Summit 2026

India EV Show 2026

EV tech India Expo 2026

Auto Tech Asia 2026
Whitepaper
- Middle East & Africa Commercial Security Market Click here to view more.
- Middle East & Africa Fire Safety Systems & Equipment Market Click here to view more.
- GCC Drone Market Click here to view more.
- Middle East Lighting Fixture Market Click here to view more.
- GCC Physical & Perimeter Security Market Click here to view more.