Kenya Wood Preservatives Market (2026-2032) | Companies, Size, Trends, Share, Analysis, Revenue, Industry, Forecast, Growth, Outlook & Value
Market Forecast By Formulation (Water-Based Wood Preservatives, Solvent-Based Wood Preservatives, Oil-Based Wood Preservatives), By Application (Residential, Commercial, Industrial) And Competitive Landscape
| Product Code: ETC049170 | Publication Date: Jan 2021 | Updated Date: Jun 2026 | Product Type: Report | |
| Publisher: 6Wresearch | Author: Ravi Bhandari | No. of Pages: 70 | No. of Figures: 35 | No. of Tables: 5 |
Kenya Wood Preservatives Market Size, Share & Growth Rate
The Kenya Wood Preservatives Market was estimated at USD 381 Million in 2025 and is projected to reach USD 514 Million by 2032, growing at a CAGR of 4.4% from 2026 to 2032. This upward trajectory is propelled by the growing construction sector, alongside an increasing demand for durable wood products in furniture manufacturing. Additionally, stringent environmental regulations are fostering a shift towards eco-friendly preservatives, thereby shaping the market landscape.
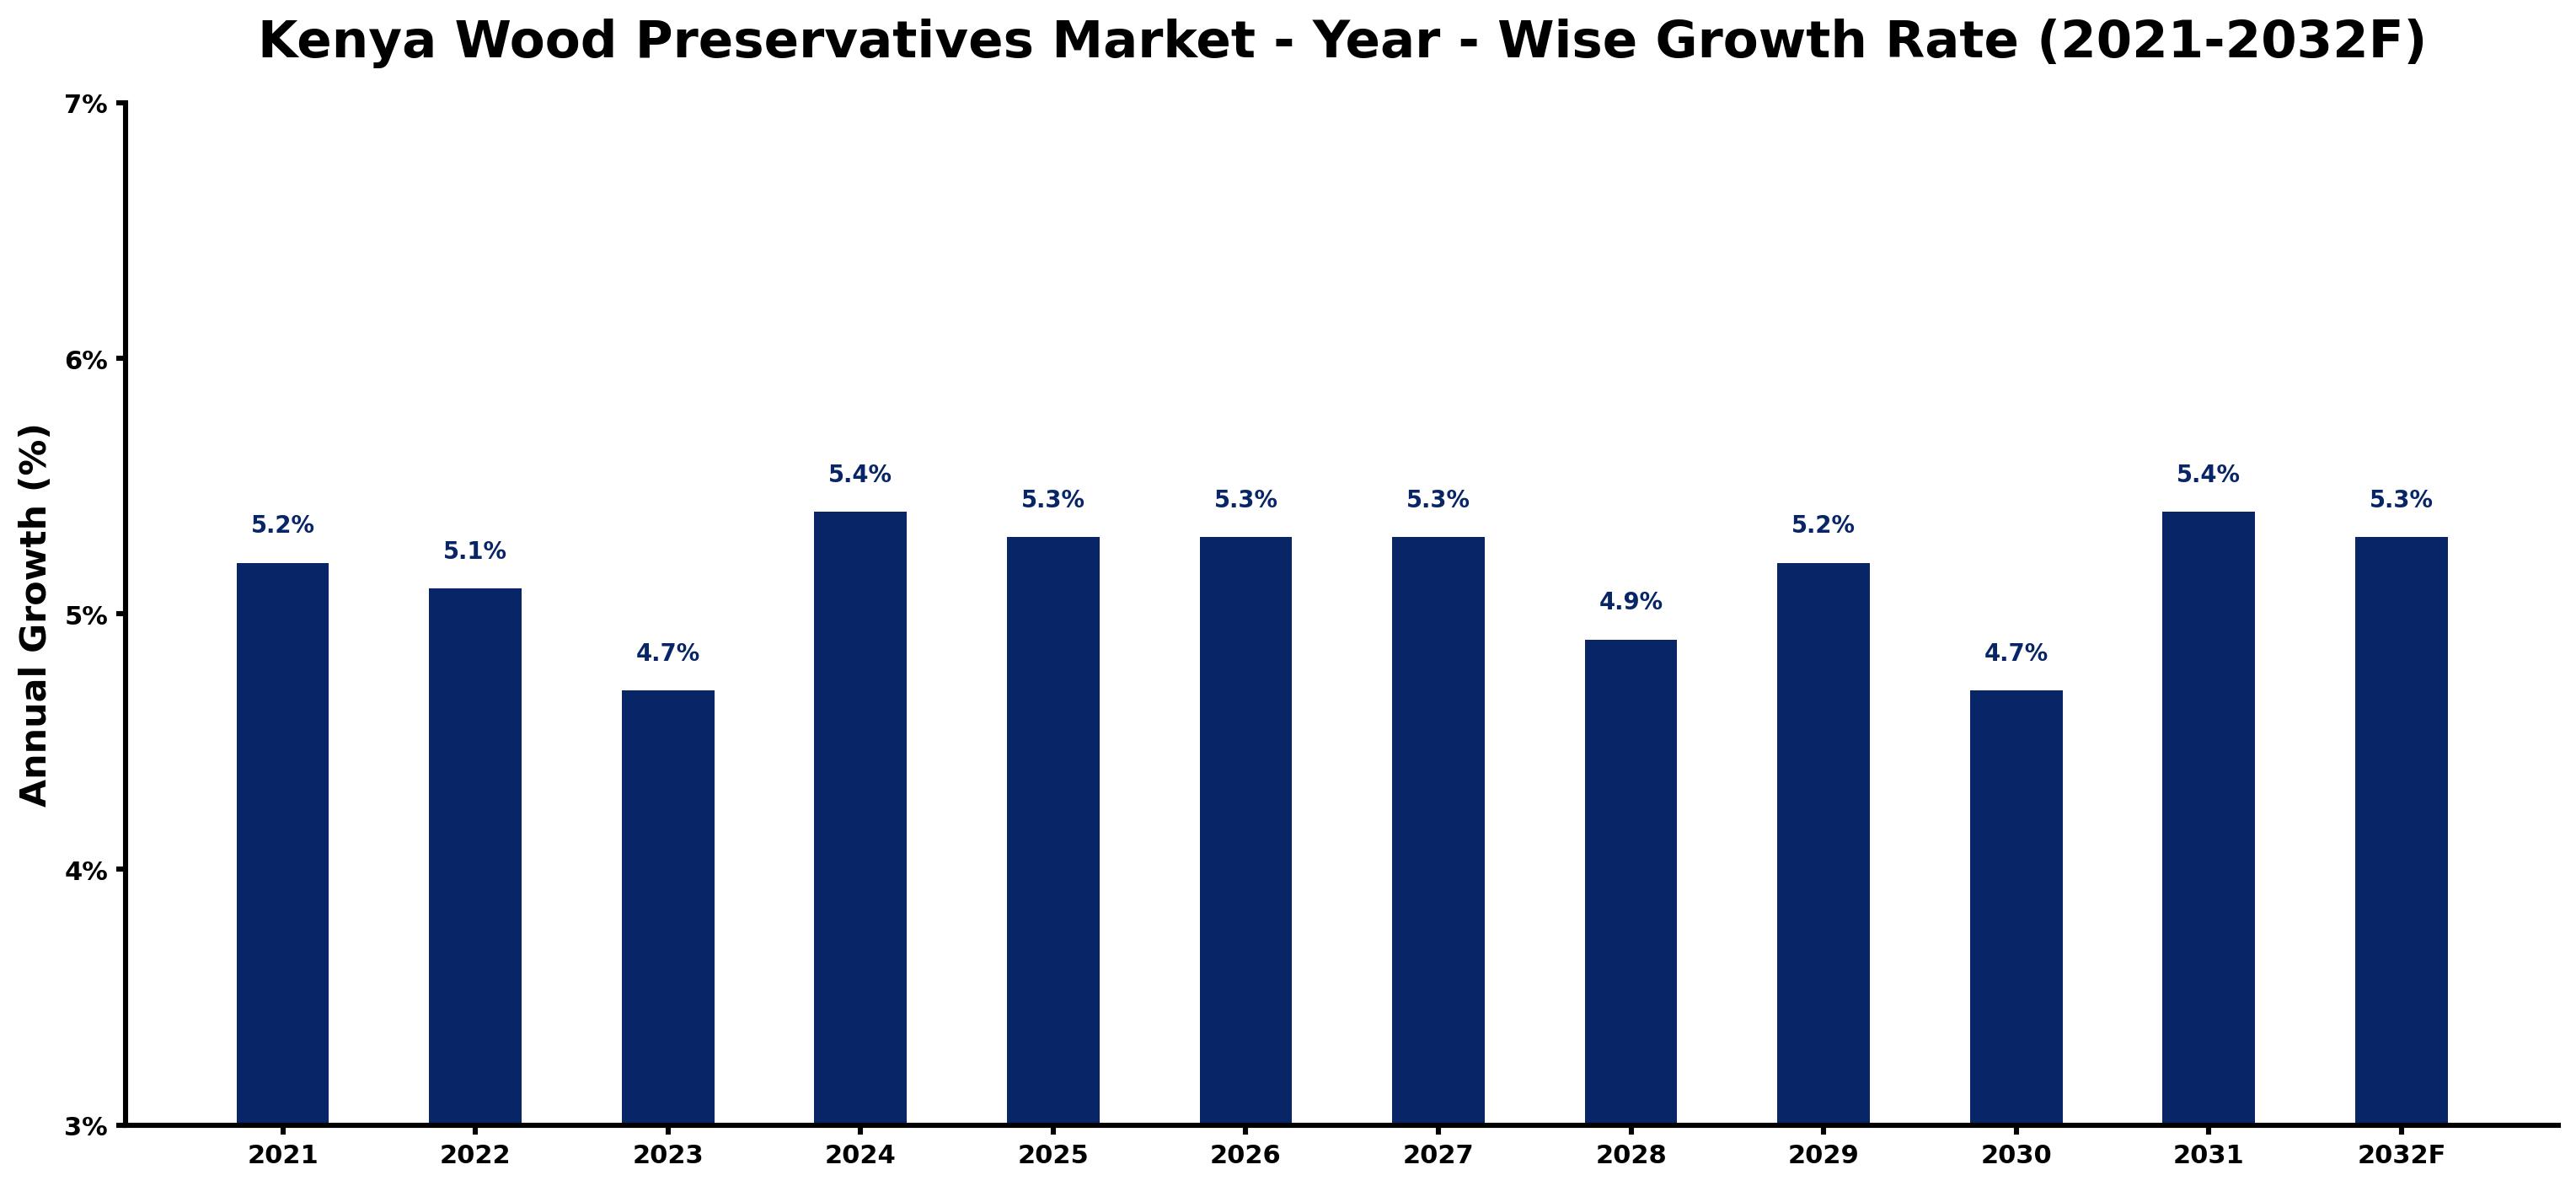
Kenya Wood Preservatives Market Growth Rate Analysis (2021-2032)
The Kenya wood preservatives market has exhibited a mix of stability and gradual fluctuations over the past few years. In 2021, growth was pegged at 5.2%, slightly declining to 5.1% in 2022, which can be attributed to supply chain disruptions and heightened raw material costs. However, 2024 sees a rebound with an anticipated growth of 5.4%, fueled by increased investments in sustainable building practices and rising consumer demand for eco-friendly products. This trend continues with stable growth rates of around 5.3% through 2027. As infrastructure projects ramp up and the country leans towards energy-efficient solutions, the wood preservatives market is projected to maintain its upward momentum, even in the face of a forecasted decline to 4.7% by 2030.
Kenya Wood Preservatives Market Year-wise Growth Rate and Key Drivers
This graph highlights how the Kenya Wood Preservatives Market has steadily grown over the past five years, supported by major growth factors.
The table below presents the year‑wise growth rates along with the key drivers influencing the market
| Year | Growth Rate | Major Drivers |
| 2021 | 5.2% | Government infrastructure modernization initiatives |
| 2022 | 5.1% | Expansion of transportation and logistics networks |
| 2023 | 4.7% | Increasing smart city development projects |
| 2024 | 5.4% | Expansion of transportation and logistics networks |
| 2025 | 5.3% | Rapid growth in telecom and data center sectors |
| 2026 | 5.3% | Expansion of commercial construction activities |
| 2027 | 5.3% | Increasing industrial infrastructure investments |
| 2028 | 4.9% | Increasing adoption of advanced technologies |
| 2029 | 5.2% | Increasing industrial automation investments |
| 2030 | 4.7% | Growing urbanization and commercial development |
| 2031 | 5.4% | Increasing adoption of advanced technologies |
| 2032 | 5.3% | Expansion of commercial construction activities |
Note - Market size estimations and growth projections presented in this report are based on 6Wresearch’s advanced forecasting approach, validated with industry datasets as of June 2026.
Kenya Wood Preservatives Market Synopsis
Currently, the wood preservatives market in Kenya is critical for both residential and commercial sectors. As urbanization accelerates and building standards evolve, there is a heightened necessity for protective solutions that extend the lifespan of wooden structures and furnishings.
The market thrives on its capacity to combat the detrimental effects of environmental factors, pests, and decay. With growing awareness surrounding sustainable practices, there is a distinct pivot towards innovative preservative solutions that not only serve functional purposes but also align with eco-conscious consumer preferences.
Kenya Wood Preservatives Market Key Takeaways
- The market is set for steady growth, driven by construction and furniture industry expansions.
- Environmental regulations are reshaping product formulations and application methodologies.
- There is a notable trend towards the development of sustainable and alternative wood preservatives.
- Concerns over health and safety are influencing consumer choices in the wood preservatives sector.
- Government initiatives are fostering innovation and compliance within the industry.
Evaluation of Restraints in Kenya Wood Preservatives Market
The Kenya Wood Preservatives Market faces significant constraints primarily due to environmental regulations that restrict the use of certain chemicals. These regulations, while crucial for public health, limit product availability and innovation in the market. Moreover, limited local production capabilities result in dependence on imports, which are often subject to high tariffs. This not only influences pricing but also creates potential disruptions in the supply chain, affecting market dynamics. Additionally, there is increasing scrutiny regarding the health implications of traditional preservatives, which may deter consumers from opting for certain products.
Kenya Wood Preservatives Market Trends
Emerging trends in the Kenya Wood Preservatives Market illustrate a clear shift towards sustainable practices. More manufacturers are developing eco-friendly products in response to consumer demand for environmentally safe options. Moreover, technological advancements are enhancing the effectiveness of preservatives, making them more reliable against fungi and insects. As sustainability becomes a core value for businesses and consumers alike, this trend is likely to reshape the product offerings significantly.
Kenya Wood Preservatives Market Opportunities
Significant growth and investment opportunities exist within the Kenya Wood Preservatives Market, particularly in the development of bio-based and non-toxic preservatives. Companies can capitalize on the rising demand for sustainable products by investing in research and development to innovate safer alternatives. Additionally, the growing construction and furniture industries present lucrative avenues for targeted marketing and supply chain enhancements to meet escalating demands.
Government Initiatives in the Kenya Wood Preservatives Market
The Kenyan government is actively involved in regulating the wood preservatives market to ensure product safety and efficacy. Policies are in place that restricts the use of harmful chemicals while promoting research into alternative preservatives. Furthermore, initiatives aimed at enhancing the application methods of wood treatments are being encouraged, emphasizing safety for both humans and the environment. The government's commitment to sustainable practices plays a vital role in shaping the future landscape of this market.
Future Insights of the Kenya Wood Preservatives Market
Looking ahead to the years 2026-2032, the Kenya Wood Preservatives Market is expected to witness robust growth fueled by continued urbanization and infrastructural development. As consumers become more aware of environmental issues, the demand for innovative and eco-friendly preservatives is set to rise. Additionally, as the regulatory landscape evolves, companies will need to adapt quickly to meet new standards while leveraging technological advancements to enhance product performance.
Kenya Wood Preservatives Market Latest Developments (May 2025 - June 2026)
In recent months, the Kenyan wood preservatives market has seen a notable push towards sustainability, with various companies announcing initiatives focused on developing environmentally friendly preservative solutions. Additionally, research institutions are increasingly collaborating with industry players to explore innovative treatments that comply with stringent regulations. These developments signal a proactive approach in addressing market challenges while aligning with global sustainability trends.
Kenya Wood Preservatives Market - Key Attractiveness of the Report
- 10 Years of Market Numbers
- Historical Data Starting from 2022 to 2025
- Base Year: 2025
- Forecast Data until 2032
- Key Performance Indicators Impacting the Market
- Major Upcoming Developments and Projects
Key Highlights of the Report:
- Kenya Wood Preservatives Market Outlook
- Market Size of Kenya Wood Preservatives Market, 2025
- Forecast of Kenya Wood Preservatives Market, 2032
- Historical Data and Forecast of Kenya Wood Preservatives Revenues & Volume for the Period 2022-2032F
- Kenya Wood Preservatives Market Trend Evolution
- Kenya Wood Preservatives Market Drivers and Challenges
- Kenya Wood Preservatives Price Trends
- Kenya Wood Preservatives Porter's Five Forces
- Kenya Wood Preservatives Industry Life Cycle
- Historical Data and Forecast of Kenya Wood Preservatives Market Revenues & Volume By Formulation for the Period 2022-2032F
- Historical Data and Forecast of Kenya Wood Preservatives Market Revenues & Volume By Water-Based Wood Preservatives for the Period 2022-2032F
- Historical Data and Forecast of Kenya Wood Preservatives Market Revenues & Volume By Solvent-Based Wood Preservatives for the Period 2022-2032F
- Historical Data and Forecast of Kenya Wood Preservatives Market Revenues & Volume By Oil-Based Wood Preservatives for the Period 2022-2032F
- Historical Data and Forecast of Kenya Wood Preservatives Market Revenues & Volume By Application for the Period 2022-2032F
- Historical Data and Forecast of Kenya Wood Preservatives Market Revenues & Volume By Residential for the Period 2022-2032F
- Historical Data and Forecast of Kenya Wood Preservatives Market Revenues & Volume By Commercial for the Period 2022-2032F
- Historical Data and Forecast of Kenya Wood Preservatives Market Revenues & Volume By Industrial for the Period 2022-2032F
- Kenya Wood Preservatives Import Export Trade Statistics
- Market Opportunity Assessment By Formulation
- Market Opportunity Assessment By Application
- Kenya Wood Preservatives Top Companies Market Share
- Kenya Wood Preservatives Competitive Benchmarking By Technical and Operational Parameters
- Kenya Wood Preservatives Company Profiles
- Kenya Wood Preservatives Key Strategic Recommendations
Kenya Wood Preservatives Market - Frequently Asked Questions
The market is anticipated to grow at a CAGR of 4.4% from 2026 to 2032, reaching USD 514 Million by 2032.
Environmental regulations play a crucial role by restricting harmful chemicals, thus influencing product development and application methods, ensuring consumer safety.
The construction sector and furniture manufacturing are the primary drivers, with both industries requiring treated wood products for durability and longevity.
Yes, there is a significant trend towards eco-friendly preservatives, as companies increasingly focus on developing sustainable solutions to meet evolving consumer preferences.
The market offers opportunities in developing bio-based preservatives and enhancing supply chains to meet the growing demand from the construction and furniture sectors.
6Wresearch actively monitors the Kenya Wood Preservatives Market and publishes its comprehensive annual report, highlighting emerging trends, growth drivers, revenue analysis, and forecast outlook. Our insights help businesses to make data-backed strategic decisions with ongoing market dynamics. Our analysts track relevent industries related to the Kenya Wood Preservatives Market, allowing our clients with actionable intelligence and reliable forecasts tailored to emerging regional needs.
Yes, we provide customisation as per your requirements. To learn more, feel free to contact us on sales@6wresearch.com
1 Executive Summary |
2 Introduction |
2.1 Key Highlights of the Report |
2.2 Report Description |
2.3 Market Scope & Segmentation |
2.4 Research Methodology |
2.5 Assumptions |
3 Kenya Wood Preservatives Market Overview |
3.1 Kenya Country Macro Economic Indicators |
3.2 Kenya Wood Preservatives Market Revenues & Volume, 2022 & 2032F |
3.3 Kenya Wood Preservatives Market - Industry Life Cycle |
3.4 Kenya Wood Preservatives Market - Porter's Five Forces |
3.5 Kenya Wood Preservatives Market Revenues & Volume Share, By Formulation, 2022 & 2032F |
3.6 Kenya Wood Preservatives Market Revenues & Volume Share, By Application, 2022 & 2032F |
4 Kenya Wood Preservatives Market Dynamics |
4.1 Impact Analysis |
4.2 Market Drivers |
4.3 Market Restraints |
5 Kenya Wood Preservatives Market Trends |
6 Kenya Wood Preservatives Market, By Types |
6.1 Kenya Wood Preservatives Market, By Formulation |
6.1.1 Overview and Analysis |
6.1.2 Kenya Wood Preservatives Market Revenues & Volume, By Formulation, 2022-2032F |
6.1.3 Kenya Wood Preservatives Market Revenues & Volume, By Water-Based Wood Preservatives, 2022-2032F |
6.1.4 Kenya Wood Preservatives Market Revenues & Volume, By Solvent-Based Wood Preservatives, 2022-2032F |
6.1.5 Kenya Wood Preservatives Market Revenues & Volume, By Oil-Based Wood Preservatives, 2022-2032F |
6.2 Kenya Wood Preservatives Market, By Application |
6.2.1 Overview and Analysis |
6.2.2 Kenya Wood Preservatives Market Revenues & Volume, By Residential, 2022-2032F |
6.2.3 Kenya Wood Preservatives Market Revenues & Volume, By Commercial, 2022-2032F |
6.2.4 Kenya Wood Preservatives Market Revenues & Volume, By Industrial, 2022-2032F |
7 Kenya Wood Preservatives Market Import-Export Trade Statistics |
7.1 Kenya Wood Preservatives Market Export to Major Countries |
7.2 Kenya Wood Preservatives Market Imports from Major Countries |
8 Kenya Wood Preservatives Market Key Performance Indicators |
9 Kenya Wood Preservatives Market - Opportunity Assessment |
9.1 Kenya Wood Preservatives Market Opportunity Assessment, By Formulation, 2022 & 2032F |
9.2 Kenya Wood Preservatives Market Opportunity Assessment, By Application, 2022 & 2032F |
10 Kenya Wood Preservatives Market - Competitive Landscape |
10.1 Kenya Wood Preservatives Market Revenue Share, By Companies, 2025 |
10.2 Kenya Wood Preservatives Market Competitive Benchmarking, By Operating and Technical Parameters |
11 Company Profiles |
12 Recommendations |
13 Disclaimer |
Global Go To Market Strategy - 2030
Export potential enables firms to identify high-growth global markets with greater confidence by combining advanced trade intelligence with a structured quantitative methodology. The framework analyzes emerging demand trends and country-level import patterns while integrating macroeconomic and trade datasets such as GDP and population forecasts, bilateral import–export flows, tariff structures, elasticity differentials between developed and developing economies, geographic distance, and import demand projections. Using weighted trade values from 2020–2024 as the base period to project country-to-country export potential for 2030, these inputs are operationalized through calculated drivers such as gravity model parameters, tariff impact factors, and projected GDP per-capita growth. Through an analysis of hidden potentials, demand hotspots, and market conditions that are most favorable to success, this method enables firms to focus on target countries, maximize returns, and global expansion with data, backed by accuracy.
By factoring in the projected importer demand gap that is currently unmet and could be potential opportunity, it identifies the potential for the Exporter (Country) among 190 countries, against the general trade analysis, which identifies the biggest importer or exporter.
To discover high-growth global markets and optimize your business strategy:
Click Here
Pricing
- Single User License$ 1,995
- Department License$ 2,400
- Site License$ 3,120
- Global License$ 3,795

Leadership Perspectives from Industry Events
Search
Thought Leadership and Analyst Meet


Our Clients
6WResearch In News
- India Air Conditioner Market Set for Strong Rebound in 2026 After Weather-Led Correction and GST-Driven Recovery: 6Wresearch
- ADAS in India: How Automatic Emergency Braking, Blind Spot Detection & Driver Monitoring are Transforming Road Safety
- Doha a strategic location for EV manufacturing hub: IPA Qatar
- Demand for luxury TVs surging in the GCC, says Samsung
- Empowering Growth: The Thriving Journey of Bangladesh’s Cable Industry
- Demand for luxury TVs surging in the GCC, says Samsung
Latest Reports
- Nicaragua RPG Gaming Market (2026-2032)
- New Zealand RPG Gaming Market (2026-2032)
- Netherlands RPG Gaming Market (2026-2032)
- Nauru RPG Gaming Market (2026-2032)
- Namibia RPG Gaming Market (2026-2032)
- Mozambique RPG Gaming Market (2026-2032)
- Montenegro RPG Gaming Market (2026-2032)
- Mongolia RPG Gaming Market (2026-2032)
- Monaco RPG Gaming Market (2026-2032)
- Micronesia RPG Gaming Market (2026-2032)
Industry Events and Analyst Meet

HIMTEX 2026

India Refining Summit 2026

India EV Show 2026

EV tech India Expo 2026

Auto Tech Asia 2026
Whitepaper
- Middle East & Africa Commercial Security Market Click here to view more.
- Middle East & Africa Fire Safety Systems & Equipment Market Click here to view more.
- GCC Drone Market Click here to view more.
- Middle East Lighting Fixture Market Click here to view more.
- GCC Physical & Perimeter Security Market Click here to view more.