Kuwait Non-Metallic Mineral Deposit Market (2026-2032) | Analysis, Companies, Outlook, Revenue, Trends, Forecast, Growth, Share, Size, Industry, Value & COVID-19 IMPACT
Market Forecast By Form Types (Powder Form, Liquid Form), By Applications (Construction, Jewellery, Iron & Ore) And Competitive Landscape
| Product Code: ETC008822 | Publication Date: Jun 2023 | Updated Date: Jun 2026 | Product Type: Report | |
| Publisher: 6Wresearch | Author: Ravi Bhandari | No. of Pages: 70 | No. of Figures: 35 | No. of Tables: 5 |
Kuwait Non-Metallic Mineral Deposit Market Summary
The kuwait non-metallic mineral deposit market was estimated at USD 736 Million in 2025 and is projected to reach USD 1339 Million by 2032, growing at a CAGR of 10.3% from 2026 to 2032.
Kuwait Non-Metallic Mineral Deposit Market Year-wise Growth Rate and Key Drivers
This graph highlights how the Kuwait Non-Metallic Mineral Deposit Market has steadily grown over the past five years, supported by major growth factors.
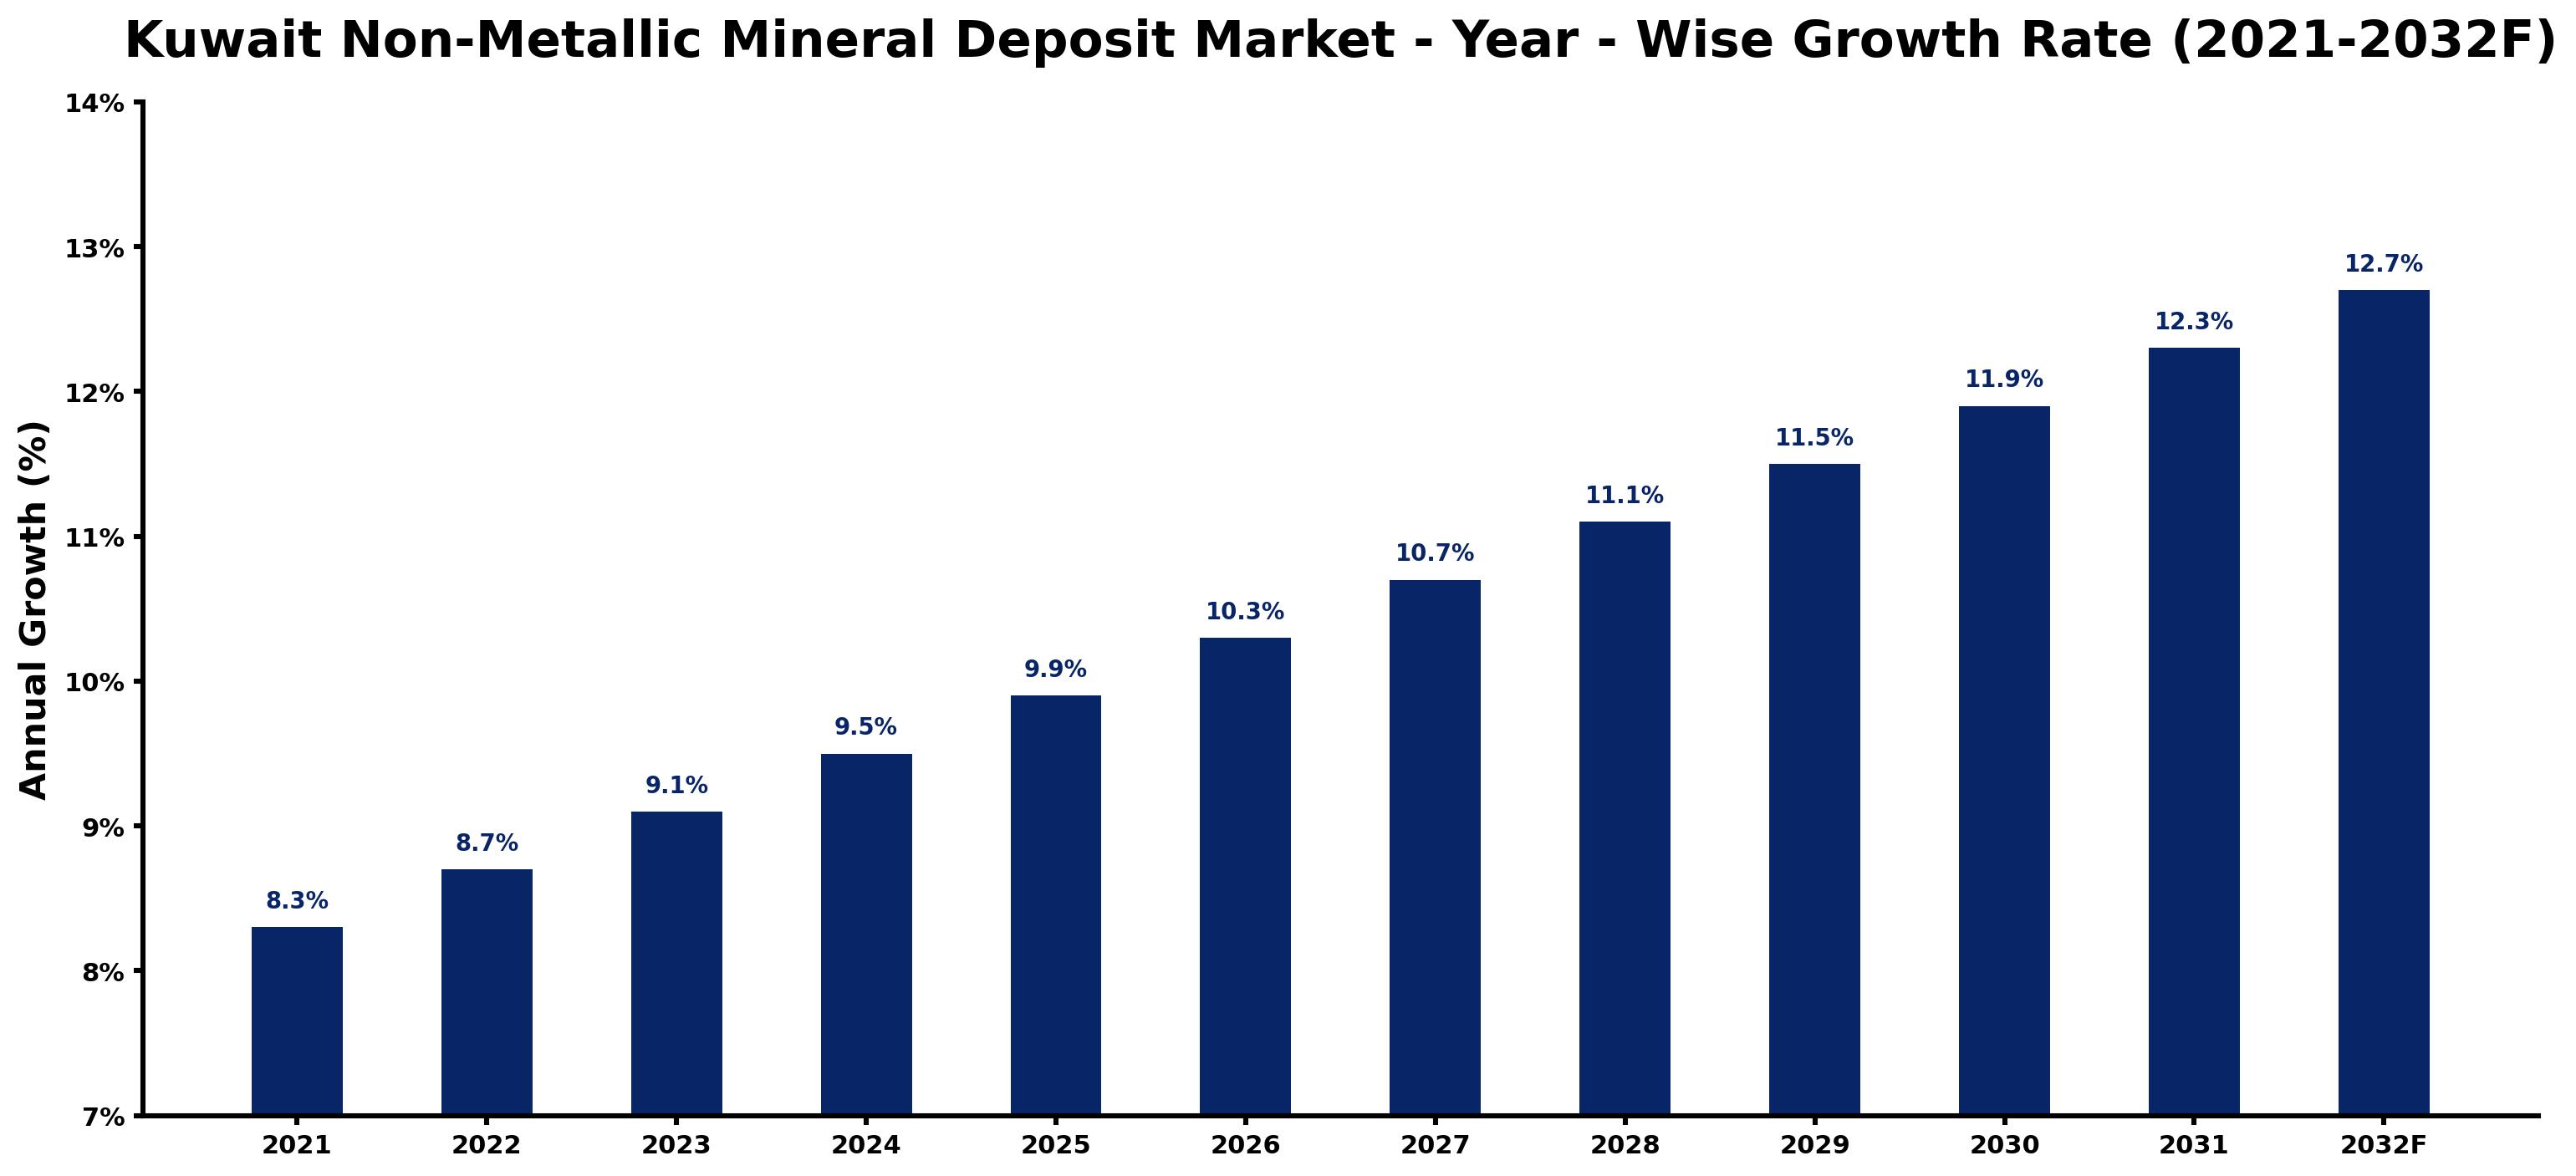
The table below presents the year wise growth rates along with the key drivers influencing the market
| Year | Growth Rate | Major Drivers |
| 2021 | 8.3% | Kuwait's construction sector rebounds, spurring demand for non-metallic minerals. |
| 2022 | 8.7% | Enhanced infrastructure projects focus on sustainable building materials, boosting mineral use. |
| 2023 | 9.1% | The global shift towards environmentally-friendly construction practices influences local sourcing trends. |
| 2024 | 9.5% | Municipal investments in public works increase, heightening non-metallic mineral requirements. |
| 2025 | 9.9% | Regional collaborations aim to establish local supply chains, reducing import dependencies. |
| 2026 | 10.3% | Technological disruptions in extraction improve efficiency and reduce production costs significantly. |
| 2027 | 10.7% | Middle Eastern economies diversify to minimize oil reliance, favoring mineral sector growth. |
| 2028 | 11.1% | Innovative building techniques drive the utilization of specialty non-metallic materials. |
| 2029 | 11.5% | Climate change adaptation strategies create demand for durable construction materials. |
| 2030 | 11.9% | Kuwait hosts major international events, escalating infrastructure development and mineral needs. |
| 2031 | 12.3% | Investment in renewable energy projects promotes mineral use in related technologies. |
| 2032 | 12.7% | The expansion of urban areas necessitates efficient non-metallic mineral applications in construction. |
Note - Market size estimations and growth projections presented in this report are based on 6Wresearch's advanced forecasting approach, validated with industry datasets as of June 2026.
Kuwait Non-Metallic Mineral Deposit Market Synopsis
The Kuwait Non-Metallic Mineral Deposit Market is projected to reach 10.3% and witness significant growth during the forecast period (2026-2032). This market is being propelled by a combination of factors, including increased urbanization, a surge in construction activities, and a growing demand for industrial minerals. As the construction industry expands, the need for various non-metallic minerals such as gypsum, clay, limestone, and quartzite continues to rise. These minerals are essential for various applications, including cement production and wall cladding.
Kuwait Non-Metallic Mineral Deposit Market Growth Drivers
The uptake of non-metallic minerals in Kuwait is driven by several key factors:
- The construction boom within the region is increasing the demand for non-metallic minerals, essential for various construction processes and materials.
- Government initiatives promoting sustainable mining practices are encouraging investments in non-metallic mineral exploration.
- Urbanization trends are leading to enhanced demand for building materials, which in turn necessitates a steady supply of non-metallic minerals.
- The market is experiencing intensified exploration activities, both by governmental agencies and private companies, enhancing the potential for new deposits to be utilized.
- Changing lifestyles and increased disposable income are facilitating a shift in consumer preferences toward modern construction, further driving demand for minerals like silica sand used in renewable energy projects.
Kuwait Non-Metallic Mineral Deposit Market Trends and Opportunities
The Kuwait Non-Metallic Mineral Deposit Market is witnessing various trends that signify its expansion:
- Enhanced focus on sustainability is influencing the shift towards non-metallic minerals that contribute to environmentally friendly construction practices.
- Adoption of advanced mining technologies is ensuring better extraction processes, leading to increased profitability and efficiency.
- Public-private partnerships are emerging as a viable strategy for funding exploration and development initiatives in the non-metallic sector.
- A growing emphasis on renewable energy sources is spurring demand for silica sand, which is crucial for solar panel manufacturing.
- International players are increasingly entering the Kuwaiti market, attracted by the potential for growth and investment opportunities.
Kuwait Non-Metallic Mineral Deposit Market Challenges and Restraints
Despite its growth potential, the Kuwait Non-Metallic Mineral Deposit Market faces certain challenges:
- Fluctuating prices due to political instability in the region could impact the economic viability of mining operations.
- Resource depletion poses a risk to the long-term sustainability of mineral operations, affecting overall supply chains.
- Intense competition from foreign players can pressure local companies, challenging their market positioning and profitability.
- Compliance with stringent environmental regulations necessitates investments in cleaner technologies, which may pose financial burdens.
- Lack of infrastructure and logistics may hinder effective distribution and exploitation of non-metallic mineral deposits.
Kuwait Non-Metallic Mineral Deposit Market Government Investment and Initiatives
The Kuwaiti government is actively investing in the development of its non-metallic mineral resources through various initiatives:
- Policies aimed at enhancing the mining sector are being implemented to attract foreign investments and expertise.
- Public funding for infrastructure improvements is crucial for unlocking the potential of non-metallic deposits, facilitating better access and extraction.
- Development plans focus on promoting sustainable practices in the mining industry, aligning with global environmental standards.
- Government incentives for companies involved in non-metallic mineral exploration are fostering innovation and increasing market participation.
- Training and educational programs aimed at developing a skilled workforce in the mining sector are being prioritized to ensure future growth.
Kuwait Non-Metallic Mineral Deposit Market Latest Developments (May 2025 - June 2026)
Recent developments in the Kuwait Non-Metallic Mineral Deposit Market highlight a dynamic industry landscape as companies adapt to evolving market conditions:
- Regulatory changes aimed at supporting the mining sector are encouraging more exploration activities, leading to the discovery of previously untapped resources.
- Technological advancements in mining techniques are resulting in more efficient extraction processes, minimizing waste and maximizing yield.
- The increase in construction projects throughout Kuwait is directly correlating with heightened demand for essential non-metallic minerals.
- Government-led initiatives promoting renewable energy installations are driving the need for specific minerals, such as silica sand.
- Collaborations between public and private sectors are becoming increasingly common, creating a synergistic approach to mineral extraction and utilization.
Kuwait Non-Metallic Mineral Deposit Market - Key Attractiveness of the Report
- 10 Years of Market Numbers
- Historical Data Starting from 2022 to 2025
- Base Year: 2025
- Forecast Data until 2032
- Key Performance Indicators Impacting the Market
- Major Upcoming Developments and Projects
Key Highlights of the Report:
- Kuwait Non-Metallic Mineral Deposit Market Outlook
- Market Size of Kuwait Non-Metallic Mineral Deposit Market, 2025
- Forecast of Kuwait Non-Metallic Mineral Deposit Market, 2032F
- Historical Data and Forecast of Kuwait Non-Metallic Mineral Deposit Revenues & Volume for the Period 2022-2032F
- Kuwait Non-Metallic Mineral Deposit Market Trend Evolution
- Kuwait Non-Metallic Mineral Deposit Market Drivers and Challenges
- Kuwait Non-Metallic Mineral Deposit Price Trends
- Kuwait Non-Metallic Mineral Deposit Porter's Five Forces
- Kuwait Non-Metallic Mineral Deposit Industry Life Cycle
- Historical Data and Forecast of Kuwait Non-Metallic Mineral Deposit Market Revenues & Volume By Form Types for the Period 2022-2032F
- Historical Data and Forecast of Kuwait Non-Metallic Mineral Deposit Market Revenues & Volume By Powder Form for the Period 2022-2032F
- Historical Data and Forecast of Kuwait Non-Metallic Mineral Deposit Market Revenues & Volume By Liquid Form for the Period 2022-2032F
- Historical Data and Forecast of Kuwait Non-Metallic Mineral Deposit Market Revenues & Volume By Applications for the Period 2022-2032F
- Historical Data and Forecast of Kuwait Non-Metallic Mineral Deposit Market Revenues & Volume By Construction for the Period 2022-2032F
- Historical Data and Forecast of Kuwait Non-Metallic Mineral Deposit Market Revenues & Volume By Jewellery for the Period 2022-2032F
- Historical Data and Forecast of Kuwait Non-Metallic Mineral Deposit Market Revenues & Volume By Iron & Ore for the Period 2022-2032F
- Kuwait Non-Metallic Mineral Deposit Import Export Trade Statistics
- Market Opportunity Assessment By Form Types
- Market Opportunity Assessment By Applications
- Kuwait Non-Metallic Mineral Deposit Top Companies Market Share
- Kuwait Non-Metallic Mineral Deposit Competitive Benchmarking By Technical and Operational Parameters
- Kuwait Non-Metallic Mineral Deposit Company Profiles
- Kuwait Non-Metallic Mineral Deposit Key Strategic Recommendations
Frequently Asked Questions About the Market Study (FAQs):
Kuwait has significant deposits of gypsum, clay, limestone, and quartzite, which are extensively used in various construction applications.
Government policies promoting sustainable mining practices and providing incentives for exploration are key drivers in the market.
The market encounters challenges such as fluctuating prices, resource depletion, and competition from foreign entities.
Urbanization is a significant driver of demand for non-metallic minerals, as growing populations require increased infrastructure and housing development.
6Wresearch actively monitors the Kuwait Non-Metallic Mineral Deposit Market and publishes its comprehensive annual report, highlighting emerging trends, growth drivers, revenue analysis, and forecast outlook. Our insights help businesses to make data-backed strategic decisions with ongoing market dynamics. Our analysts track relevent industries related to the Kuwait Non-Metallic Mineral Deposit Market, allowing our clients with actionable intelligence and reliable forecasts tailored to emerging regional needs.
Yes, we provide customisation as per your requirements. To learn more, feel free to contact us on sales@6wresearch.com
1 Executive Summary |
2 Introduction |
2.1 Key Highlights of the Report |
2.2 Report Description |
2.3 Market Scope & Segmentation |
2.4 Research Methodology |
2.5 Assumptions |
3 Kuwait Non-Metallic Mineral Deposit Market Overview |
3.1 Kuwait Country Macro Economic Indicators |
3.2 Kuwait Non-Metallic Mineral Deposit Market Revenues & Volume, 2022 & 2032F |
3.3 Kuwait Non-Metallic Mineral Deposit Market - Industry Life Cycle |
3.4 Kuwait Non-Metallic Mineral Deposit Market - Porter's Five Forces |
3.5 Kuwait Non-Metallic Mineral Deposit Market Revenues & Volume Share, By Form Types, 2022 & 2032F |
3.6 Kuwait Non-Metallic Mineral Deposit Market Revenues & Volume Share, By Applications, 2022 & 2032F |
4 Kuwait Non-Metallic Mineral Deposit Market Dynamics |
4.1 Impact Analysis |
4.2 Market Drivers |
4.3 Market Restraints |
5 Kuwait Non-Metallic Mineral Deposit Market Trends |
6 Kuwait Non-Metallic Mineral Deposit Market, By Types |
6.1 Kuwait Non-Metallic Mineral Deposit Market, By Form Types |
6.1.1 Overview and Analysis |
6.1.2 Kuwait Non-Metallic Mineral Deposit Market Revenues & Volume, By Form Types, 2022-2032F |
6.1.3 Kuwait Non-Metallic Mineral Deposit Market Revenues & Volume, By Powder Form, 2022-2032F |
6.1.4 Kuwait Non-Metallic Mineral Deposit Market Revenues & Volume, By Liquid Form, 2022-2032F |
6.2 Kuwait Non-Metallic Mineral Deposit Market, By Applications |
6.2.1 Overview and Analysis |
6.2.2 Kuwait Non-Metallic Mineral Deposit Market Revenues & Volume, By Construction, 2022-2032F |
6.2.3 Kuwait Non-Metallic Mineral Deposit Market Revenues & Volume, By Jewellery, 2022-2032F |
6.2.4 Kuwait Non-Metallic Mineral Deposit Market Revenues & Volume, By Iron & Ore, 2022-2032F |
7 Kuwait Non-Metallic Mineral Deposit Market Import-Export Trade Statistics |
7.1 Kuwait Non-Metallic Mineral Deposit Market Export to Major Countries |
7.2 Kuwait Non-Metallic Mineral Deposit Market Imports from Major Countries |
8 Kuwait Non-Metallic Mineral Deposit Market Key Performance Indicators |
9 Kuwait Non-Metallic Mineral Deposit Market - Opportunity Assessment |
9.1 Kuwait Non-Metallic Mineral Deposit Market Opportunity Assessment, By Form Types, 2022 & 2032F |
9.2 Kuwait Non-Metallic Mineral Deposit Market Opportunity Assessment, By Applications, 2022 & 2032F |
10 Kuwait Non-Metallic Mineral Deposit Market - Competitive Landscape |
10.1 Kuwait Non-Metallic Mineral Deposit Market Revenue Share, By Companies, 2025 |
10.2 Kuwait Non-Metallic Mineral Deposit Market Competitive Benchmarking, By Operating and Technical Parameters |
11 Company Profiles |
12 Recommendations |
13 Disclaimer |
Global Go To Market Strategy - 2030
Export potential enables firms to identify high-growth global markets with greater confidence by combining advanced trade intelligence with a structured quantitative methodology. The framework analyzes emerging demand trends and country-level import patterns while integrating macroeconomic and trade datasets such as GDP and population forecasts, bilateral import–export flows, tariff structures, elasticity differentials between developed and developing economies, geographic distance, and import demand projections. Using weighted trade values from 2020–2024 as the base period to project country-to-country export potential for 2030, these inputs are operationalized through calculated drivers such as gravity model parameters, tariff impact factors, and projected GDP per-capita growth. Through an analysis of hidden potentials, demand hotspots, and market conditions that are most favorable to success, this method enables firms to focus on target countries, maximize returns, and global expansion with data, backed by accuracy.
By factoring in the projected importer demand gap that is currently unmet and could be potential opportunity, it identifies the potential for the Exporter (Country) among 190 countries, against the general trade analysis, which identifies the biggest importer or exporter.
To discover high-growth global markets and optimize your business strategy:
Click Here
Pricing
- Single User License$ 1,995
- Department License$ 2,400
- Site License$ 3,120
- Global License$ 3,795

Leadership Perspectives from Industry Events
Search
Thought Leadership and Analyst Meet


Our Clients
6WResearch In News
- India Air Conditioner Market Set for Strong Rebound in 2026 After Weather-Led Correction and GST-Driven Recovery: 6Wresearch
- ADAS in India: How Automatic Emergency Braking, Blind Spot Detection & Driver Monitoring are Transforming Road Safety
- Doha a strategic location for EV manufacturing hub: IPA Qatar
- Demand for luxury TVs surging in the GCC, says Samsung
- Empowering Growth: The Thriving Journey of Bangladesh’s Cable Industry
- Demand for luxury TVs surging in the GCC, says Samsung
Latest Reports
- Nicaragua RPG Gaming Market (2026-2032)
- New Zealand RPG Gaming Market (2026-2032)
- Netherlands RPG Gaming Market (2026-2032)
- Nauru RPG Gaming Market (2026-2032)
- Namibia RPG Gaming Market (2026-2032)
- Mozambique RPG Gaming Market (2026-2032)
- Montenegro RPG Gaming Market (2026-2032)
- Mongolia RPG Gaming Market (2026-2032)
- Monaco RPG Gaming Market (2026-2032)
- Micronesia RPG Gaming Market (2026-2032)
Industry Events and Analyst Meet

EV India Expo 2026

HIMTEX 2026

India Refining Summit 2026

India EV Show 2026

EV tech India Expo 2026
Whitepaper
- Middle East & Africa Commercial Security Market Click here to view more.
- Middle East & Africa Fire Safety Systems & Equipment Market Click here to view more.
- GCC Drone Market Click here to view more.
- Middle East Lighting Fixture Market Click here to view more.
- GCC Physical & Perimeter Security Market Click here to view more.