Latvia Chloroform Market (2025-2031) | Trends, Share, Segmentation, Growth, Analysis, Outlook, Size, Companies, Forecast, Value, Revenue & Industry
Market Forecast By Grade (Technical Grade, Alcohol Stabilized Grade, Fluorocarbon Grade), By Application (Solvent, Intermediates, Reagent, Others), By End-users (Pharmaceutical, Agrochemical, Chemical Industry, Others) And Competitive Landscape
| Product Code: ETC4733923 | Publication Date: Nov 2023 | Updated Date: Apr 2026 | Product Type: Market Research Report | |
| Publisher: 6Wresearch | Author: Shubham Padhi | No. of Pages: 60 | No. of Figures: 30 | No. of Tables: 5 |
Latvia Chloroform Market Size (2020-2030)
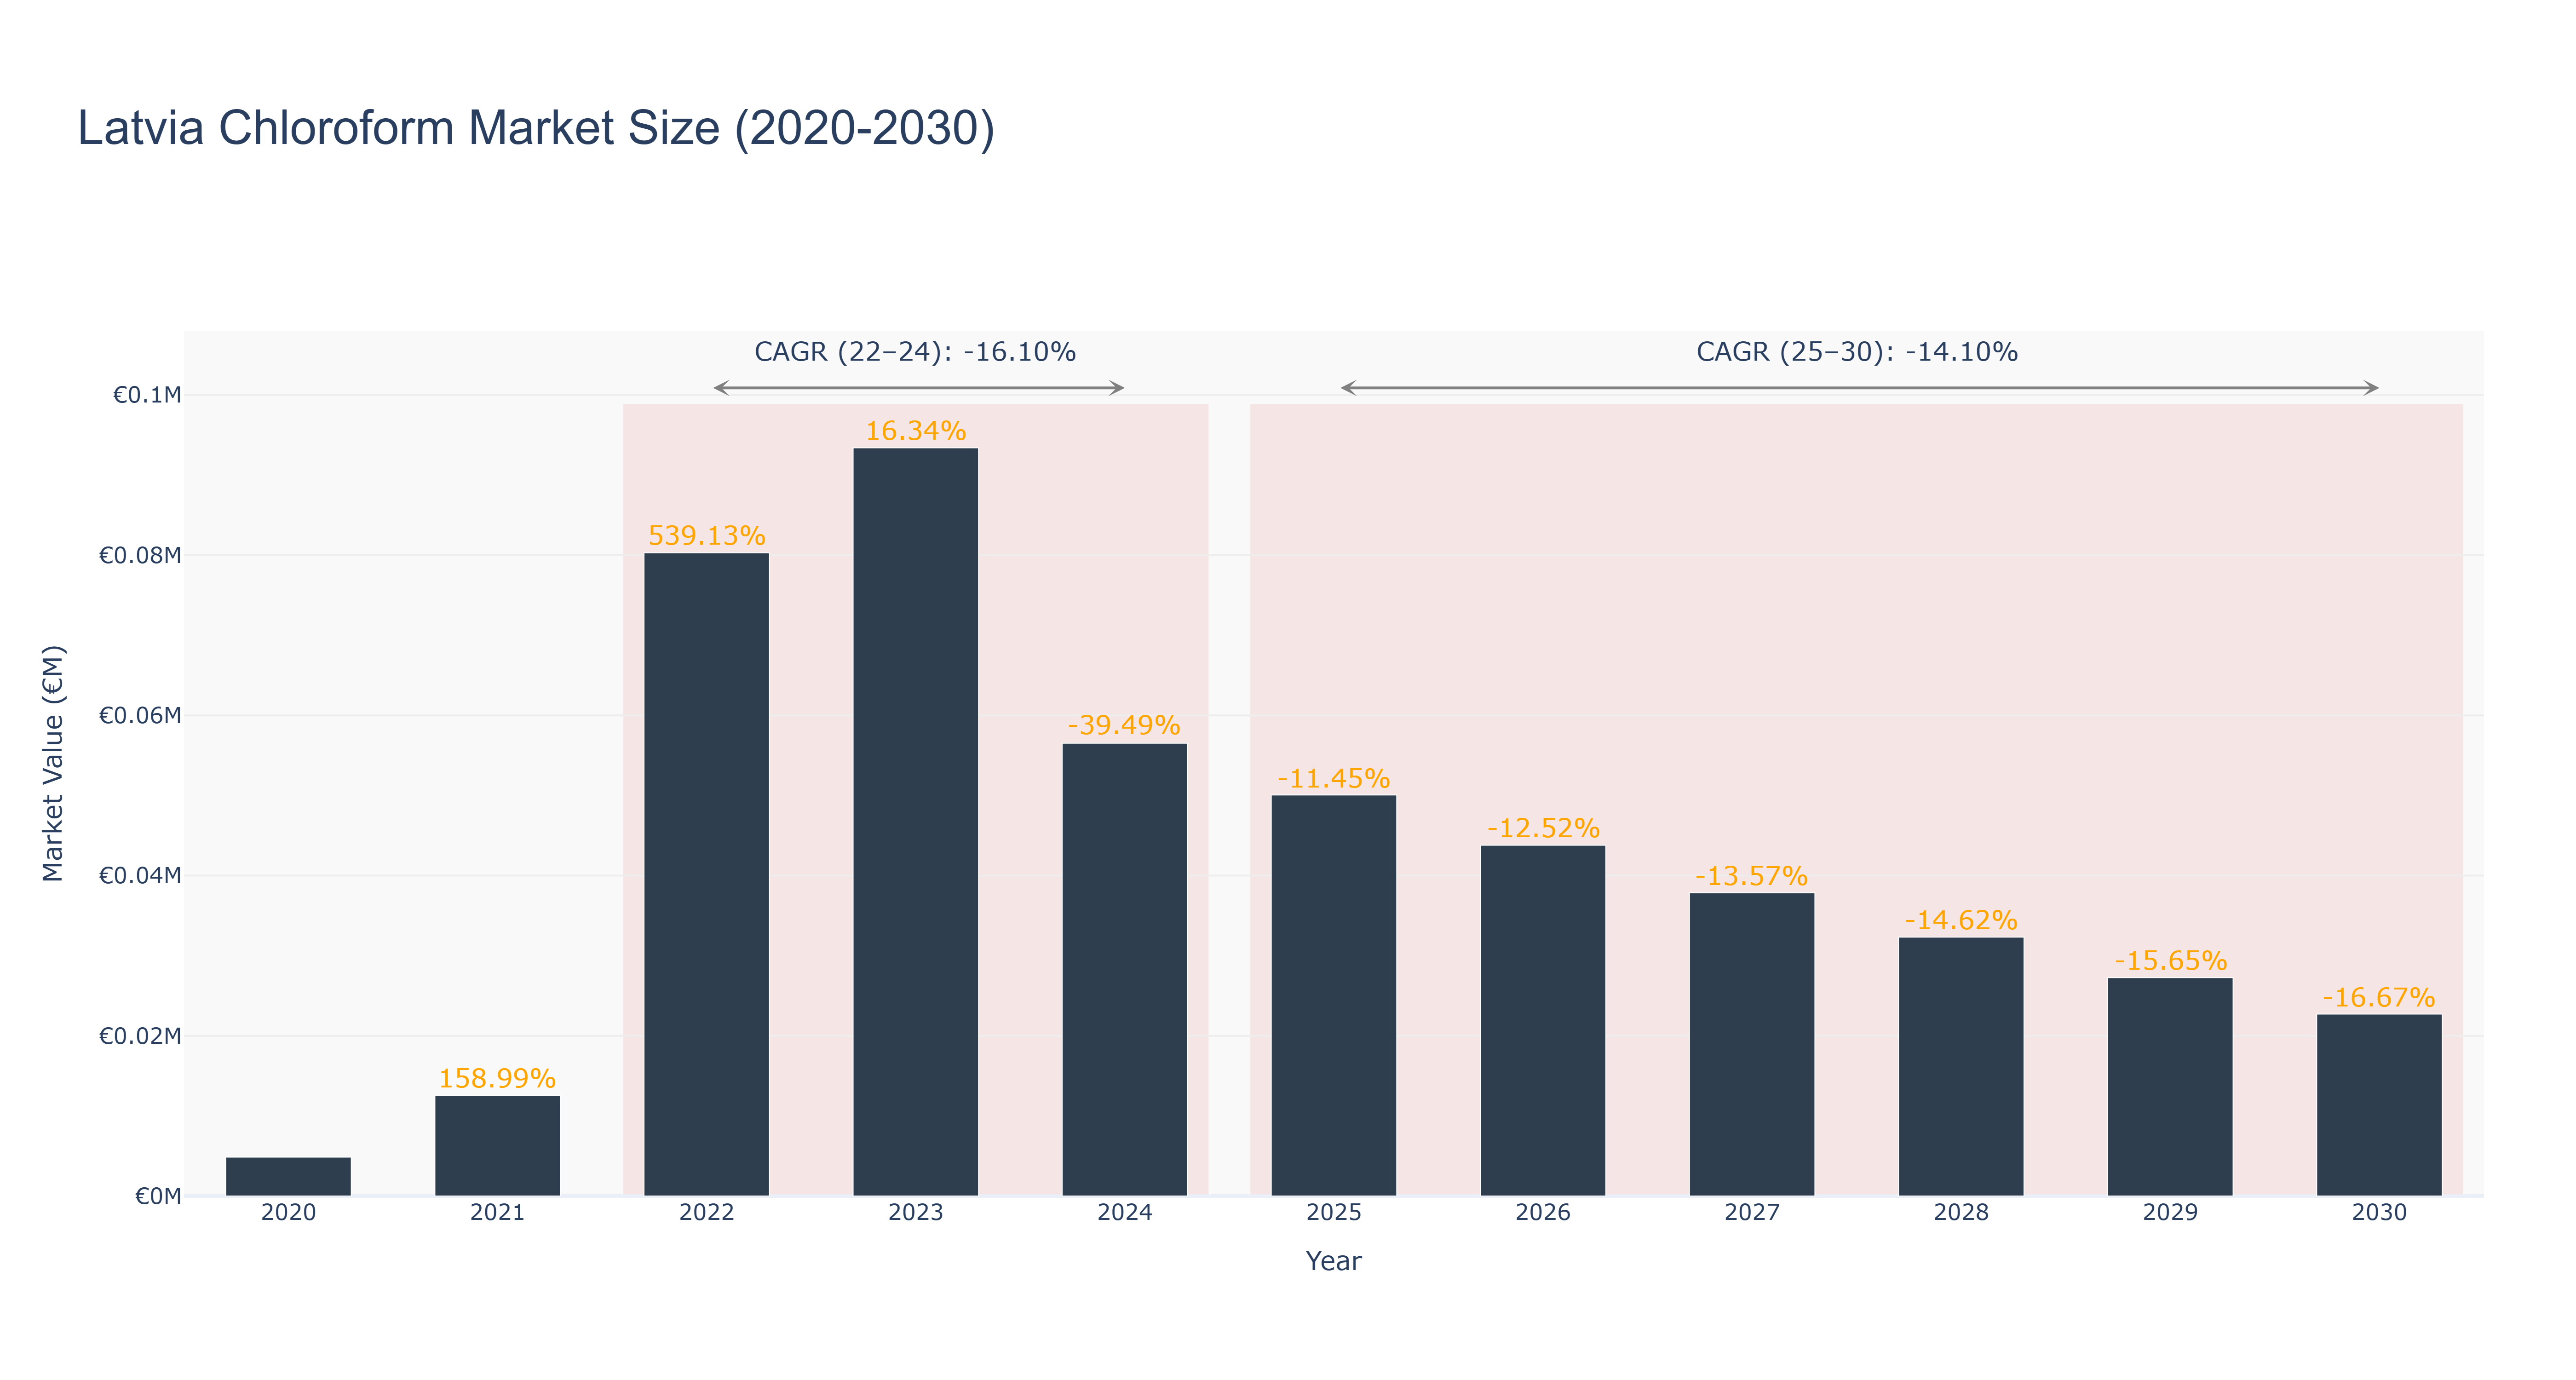
The Latvia Chloroform Market has experienced a volatile trajectory, peaking in 2022 with a market size of €80.29 thousand, following a remarkable growth rate of 539.13% from the previous year. The actual market size grew from €4.85 thousand in 2020 to €93.41 thousand in 2023, but is projected to decline sharply thereafter, with a forecasted market size of €22.72 thousand by 2030, reflecting a CAGR of -14.10% for the 2025-2030 period. The decline can be attributed to increasing regulatory pressures and a shift towards more sustainable alternatives in chemical production. While the actual CAGR from 2022 to 2024 stands at -16.10%, future prospects remain uncertain, with potential developments in chemical processing technologies being the only glimmer for stabilization in this declining market. Overall, the Latvia Chloroform Market faces significant challenges that could hinder recovery in the coming years.
Latvia Chloroform Market: Production & Trade Performance (2019-2025)
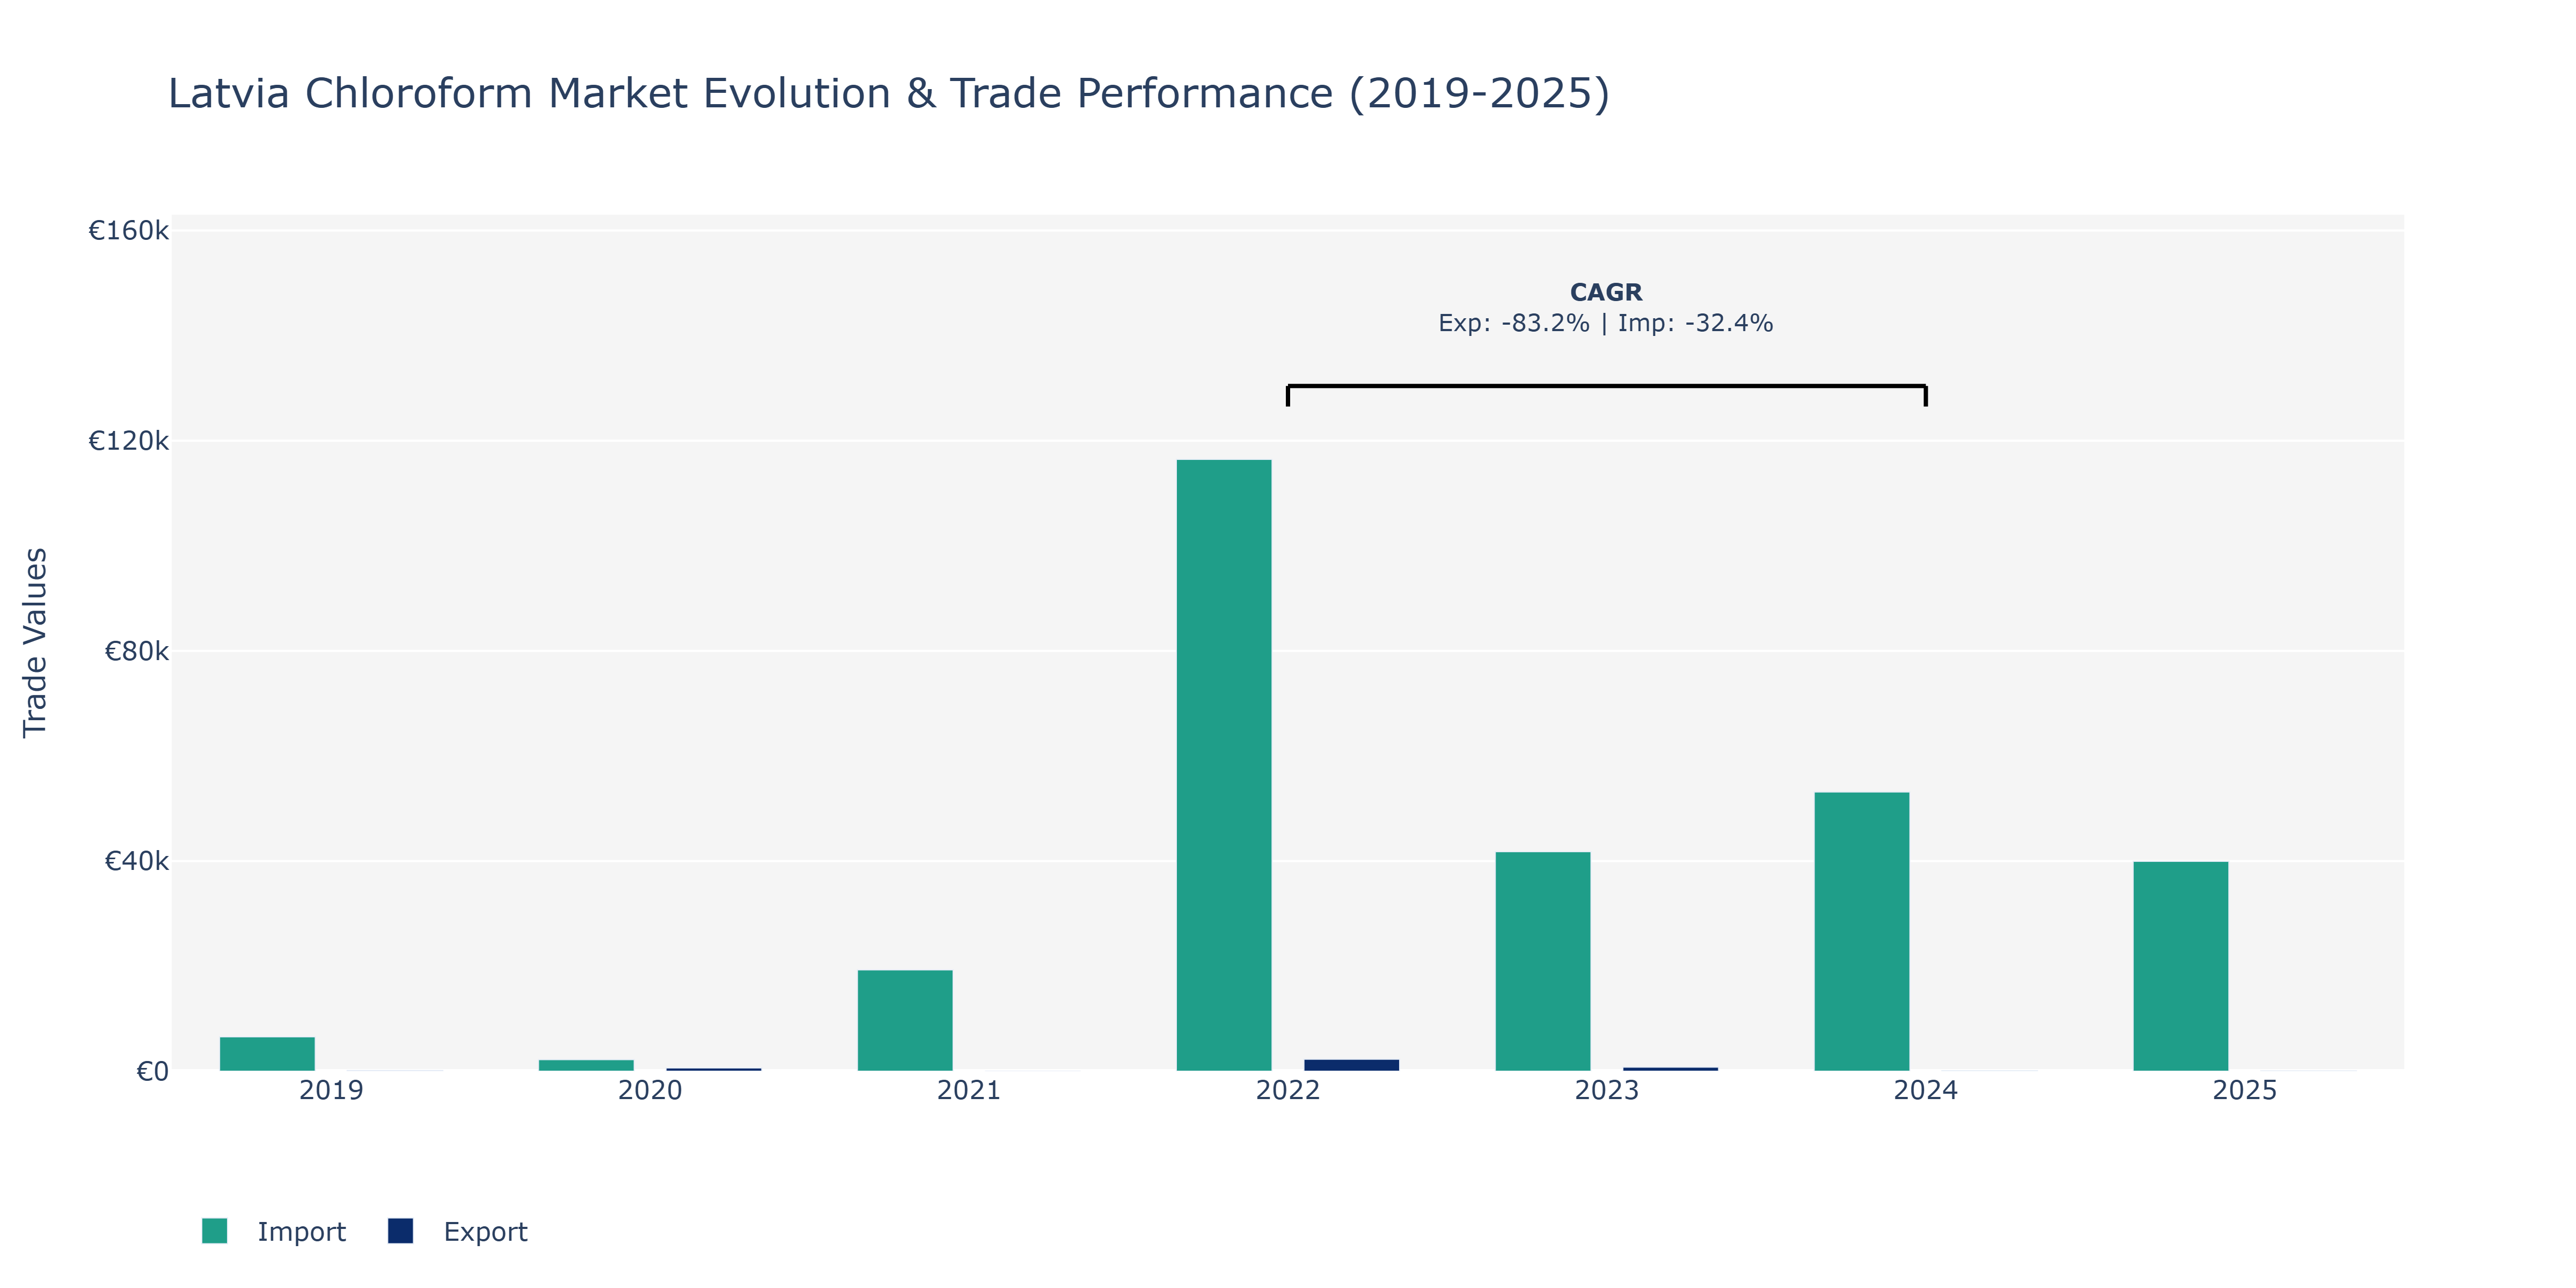
Between 2019 and 2025, the Latvia Chloroform Market showed varying trends in exports and imports. In 2019, exports started at €140, experiencing a substantial increase to €2.27 thousand in 2022, before declining significantly to €48 in 2025. Conversely, imports began at €6.53 thousand in 2019, saw a slight decrease in 2020, and spiked to €116.44 thousand in 2022, followed by a gradual decline to €39.95 thousand in 2025. These fluctuations can be attributed to changing global demand for chloroform-based products, economic conditions affecting trade flows, and regulatory changes impacting the chemical industry. The notable peak in imports in 2022 might indicate increased domestic consumption or a shift in manufacturing processes requiring higher chloroform imports. The subsequent decline in both exports and imports could reflect market adjustments, technological advancements reducing chloroform usage, or evolving environmental regulations affecting production and trade dynamics.
Key Highlights of the Report:
- Latvia Chloroform Market Outlook
- Market Size of Latvia Chloroform Market, 2024
- Forecast of Latvia Chloroform Market, 2031
- Historical Data and Forecast of Latvia Chloroform Revenues & Volume for the Period 2021-2031
- Latvia Chloroform Market Trend Evolution
- Latvia Chloroform Market Drivers and Challenges
- Latvia Chloroform Price Trends
- Latvia Chloroform Porter`s Five Forces
- Latvia Chloroform Industry Life Cycle
- Historical Data and Forecast of Latvia Chloroform Market Revenues & Volume By Grade for the Period 2021-2031
- Historical Data and Forecast of Latvia Chloroform Market Revenues & Volume By Technical Grade for the Period 2021-2031
- Historical Data and Forecast of Latvia Chloroform Market Revenues & Volume By Alcohol Stabilized Grade for the Period 2021-2031
- Historical Data and Forecast of Latvia Chloroform Market Revenues & Volume By Fluorocarbon Grade for the Period 2021-2031
- Historical Data and Forecast of Latvia Chloroform Market Revenues & Volume By Application for the Period 2021-2031
- Historical Data and Forecast of Latvia Chloroform Market Revenues & Volume By Solvent for the Period 2021-2031
- Historical Data and Forecast of Latvia Chloroform Market Revenues & Volume By Intermediates for the Period 2021-2031
- Historical Data and Forecast of Latvia Chloroform Market Revenues & Volume By Reagent for the Period 2021-2031
- Historical Data and Forecast of Latvia Chloroform Market Revenues & Volume By Others for the Period 2021-2031
- Historical Data and Forecast of Latvia Chloroform Market Revenues & Volume By End-users for the Period 2021-2031
- Historical Data and Forecast of Latvia Chloroform Market Revenues & Volume By Pharmaceutical for the Period 2021-2031
- Historical Data and Forecast of Latvia Chloroform Market Revenues & Volume By Agrochemical for the Period 2021-2031
- Historical Data and Forecast of Latvia Chloroform Market Revenues & Volume By Chemical Industry for the Period 2021-2031
- Historical Data and Forecast of Latvia Chloroform Market Revenues & Volume By Others for the Period 2021-2031
- Latvia Chloroform Import Export Trade Statistics
- Market Opportunity Assessment By Grade
- Market Opportunity Assessment By Application
- Market Opportunity Assessment By End-users
- Latvia Chloroform Top Companies Market Share
- Latvia Chloroform Competitive Benchmarking By Technical and Operational Parameters
- Latvia Chloroform Company Profiles
- Latvia Chloroform Key Strategic Recommendations
Frequently Asked Questions About the Market Study (FAQs):
6Wresearch actively monitors the Latvia Chloroform Market and publishes its comprehensive annual report, highlighting emerging trends, growth drivers, revenue analysis, and forecast outlook. Our insights help businesses to make data-backed strategic decisions with ongoing market dynamics. Our analysts track relevent industries related to the Latvia Chloroform Market, allowing our clients with actionable intelligence and reliable forecasts tailored to emerging regional needs.
Yes, we provide customisation as per your requirements. To learn more, feel free to contact us on sales@6wresearch.com
1 Executive Summary |
2 Introduction |
2.1 Key Highlights of the Report |
2.2 Report Description |
2.3 Market Scope & Segmentation |
2.4 Research Methodology |
2.5 Assumptions |
3 Latvia Chloroform Market Overview |
3.1 Latvia Country Macro Economic Indicators |
3.2 Latvia Chloroform Market Revenues & Volume, 2021 & 2031F |
3.3 Latvia Chloroform Market - Industry Life Cycle |
3.4 Latvia Chloroform Market - Porter's Five Forces |
3.5 Latvia Chloroform Market Revenues & Volume Share, By Grade, 2021 & 2031F |
3.6 Latvia Chloroform Market Revenues & Volume Share, By Application, 2021 & 2031F |
3.7 Latvia Chloroform Market Revenues & Volume Share, By End-users, 2021 & 2031F |
4 Latvia Chloroform Market Dynamics |
4.1 Impact Analysis |
4.2 Market Drivers |
4.2.1 Increasing demand for chloroform in the pharmaceutical industry for various applications such as solvent and reagent. |
4.2.2 Growing adoption of chloroform in the manufacturing sector for use in chemical synthesis and as a solvent. |
4.2.3 Rising research and development activities in the healthcare sector driving the demand for chloroform for laboratory purposes. |
4.3 Market Restraints |
4.3.1 Stringent regulations regarding the use and handling of chloroform due to its harmful effects on health and the environment. |
4.3.2 Fluctuating prices of raw materials used in the production of chloroform impacting the overall market pricing and profitability. |
5 Latvia Chloroform Market Trends |
6 Latvia Chloroform Market Segmentations |
6.1 Latvia Chloroform Market, By Grade |
6.1.1 Overview and Analysis |
6.1.2 Latvia Chloroform Market Revenues & Volume, By Technical Grade, 2021-2031F |
6.1.3 Latvia Chloroform Market Revenues & Volume, By Alcohol Stabilized Grade, 2021-2031F |
6.1.4 Latvia Chloroform Market Revenues & Volume, By Fluorocarbon Grade, 2021-2031F |
6.2 Latvia Chloroform Market, By Application |
6.2.1 Overview and Analysis |
6.2.2 Latvia Chloroform Market Revenues & Volume, By Solvent, 2021-2031F |
6.2.3 Latvia Chloroform Market Revenues & Volume, By Intermediates, 2021-2031F |
6.2.4 Latvia Chloroform Market Revenues & Volume, By Reagent, 2021-2031F |
6.2.5 Latvia Chloroform Market Revenues & Volume, By Others, 2021-2031F |
6.3 Latvia Chloroform Market, By End-users |
6.3.1 Overview and Analysis |
6.3.2 Latvia Chloroform Market Revenues & Volume, By Pharmaceutical, 2021-2031F |
6.3.3 Latvia Chloroform Market Revenues & Volume, By Agrochemical, 2021-2031F |
6.3.4 Latvia Chloroform Market Revenues & Volume, By Chemical Industry, 2021-2031F |
6.3.5 Latvia Chloroform Market Revenues & Volume, By Others, 2021-2031F |
7 Latvia Chloroform Market Import-Export Trade Statistics |
7.1 Latvia Chloroform Market Export to Major Countries |
7.2 Latvia Chloroform Market Imports from Major Countries |
8 Latvia Chloroform Market Key Performance Indicators |
8.1 Number of new applications of chloroform in different industries indicating market diversification. |
8.2 Research and development investments in chloroform-related projects showing potential for market growth. |
8.3 Environmental impact assessments and compliance measures taken by chloroform manufacturers demonstrating sustainability efforts. |
9 Latvia Chloroform Market - Opportunity Assessment |
9.1 Latvia Chloroform Market Opportunity Assessment, By Grade, 2021 & 2031F |
9.2 Latvia Chloroform Market Opportunity Assessment, By Application, 2021 & 2031F |
9.3 Latvia Chloroform Market Opportunity Assessment, By End-users, 2021 & 2031F |
10 Latvia Chloroform Market - Competitive Landscape |
10.1 Latvia Chloroform Market Revenue Share, By Companies, 2024 |
10.2 Latvia Chloroform Market Competitive Benchmarking, By Operating and Technical Parameters |
11 Company Profiles |
12 Recommendations | 13 Disclaimer |
Global Go To Market Strategy - 2030
Export potential enables firms to identify high-growth global markets with greater confidence by combining advanced trade intelligence with a structured quantitative methodology. The framework analyzes emerging demand trends and country-level import patterns while integrating macroeconomic and trade datasets such as GDP and population forecasts, bilateral import–export flows, tariff structures, elasticity differentials between developed and developing economies, geographic distance, and import demand projections. Using weighted trade values from 2020–2024 as the base period to project country-to-country export potential for 2030, these inputs are operationalized through calculated drivers such as gravity model parameters, tariff impact factors, and projected GDP per-capita growth. Through an analysis of hidden potentials, demand hotspots, and market conditions that are most favorable to success, this method enables firms to focus on target countries, maximize returns, and global expansion with data, backed by accuracy.
By factoring in the projected importer demand gap that is currently unmet and could be potential opportunity, it identifies the potential for the Exporter (Country) among 190 countries, against the general trade analysis, which identifies the biggest importer or exporter.
To discover high-growth global markets and optimize your business strategy:
Click Here
Pricing
- Single User License$ 1,995
- Department License$ 2,400
- Site License$ 3,120
- Global License$ 3,795

Leadership Perspectives from Industry Events
Search
Thought Leadership and Analyst Meet


Our Clients
6WResearch In News
- Doha a strategic location for EV manufacturing hub: IPA Qatar
- Demand for luxury TVs surging in the GCC, says Samsung
- Empowering Growth: The Thriving Journey of Bangladesh’s Cable Industry
- Demand for luxury TVs surging in the GCC, says Samsung
- Video call with a traditional healer? Once unthinkable, it’s now common in South Africa
- Intelligent Buildings To Smooth GCC’s Path To Net Zero
Latest Reports
- New Zealand Aseptic Manufacturing Market (2026-2032)
- Netherlands Aseptic Manufacturing Market (2026-2032)
- Nauru Aseptic Manufacturing Market (2026-2032)
- Namibia Aseptic Manufacturing Market (2026-2032)
- Mozambique Aseptic Manufacturing Market (2026-2032)
- Montenegro Aseptic Manufacturing Market (2026-2032)
- Mongolia Aseptic Manufacturing Market (2026-2032)
- Monaco Aseptic Manufacturing Market (2026-2032)
- Micronesia Aseptic Manufacturing Market (2026-2032)
- Mauritius Aseptic Manufacturing Market (2026-2032)
Industry Events and Analyst Meet

HIMTEX 2026

India Refining Summit 2026

India EV Show 2026

EV tech India Expo 2026

Auto Tech Asia 2026
Whitepaper
- Middle East & Africa Commercial Security Market Click here to view more.
- Middle East & Africa Fire Safety Systems & Equipment Market Click here to view more.
- GCC Drone Market Click here to view more.
- Middle East Lighting Fixture Market Click here to view more.
- GCC Physical & Perimeter Security Market Click here to view more.