Latvia Glass Vials Market (2026-2032) | Competitive Landscape, Industry, Segmentation, Growth, Companies, Forecast, Analysis, Size & Revenue, Trends, Value, Share, Outlook
Market Forecast By Glass Type (Borosilicate Glass, Fused Silica), By Capacity (Up to 2 ML, 3-10 ML, 11-20 ML, Above 20 ML), By End Use (Healthcare, Cosmetics & Personal Care, Chemicals) And Competitive Landscape
| Product Code: ETC7912131 | Publication Date: Sep 2024 | Updated Date: Apr 2026 | Product Type: Market Research Report | |
| Publisher: 6Wresearch | Author: Dhaval Chaurasia | No. of Pages: 75 | No. of Figures: 35 | No. of Tables: 20 |
Latvia Glass Vials Market Size (2020-2030)
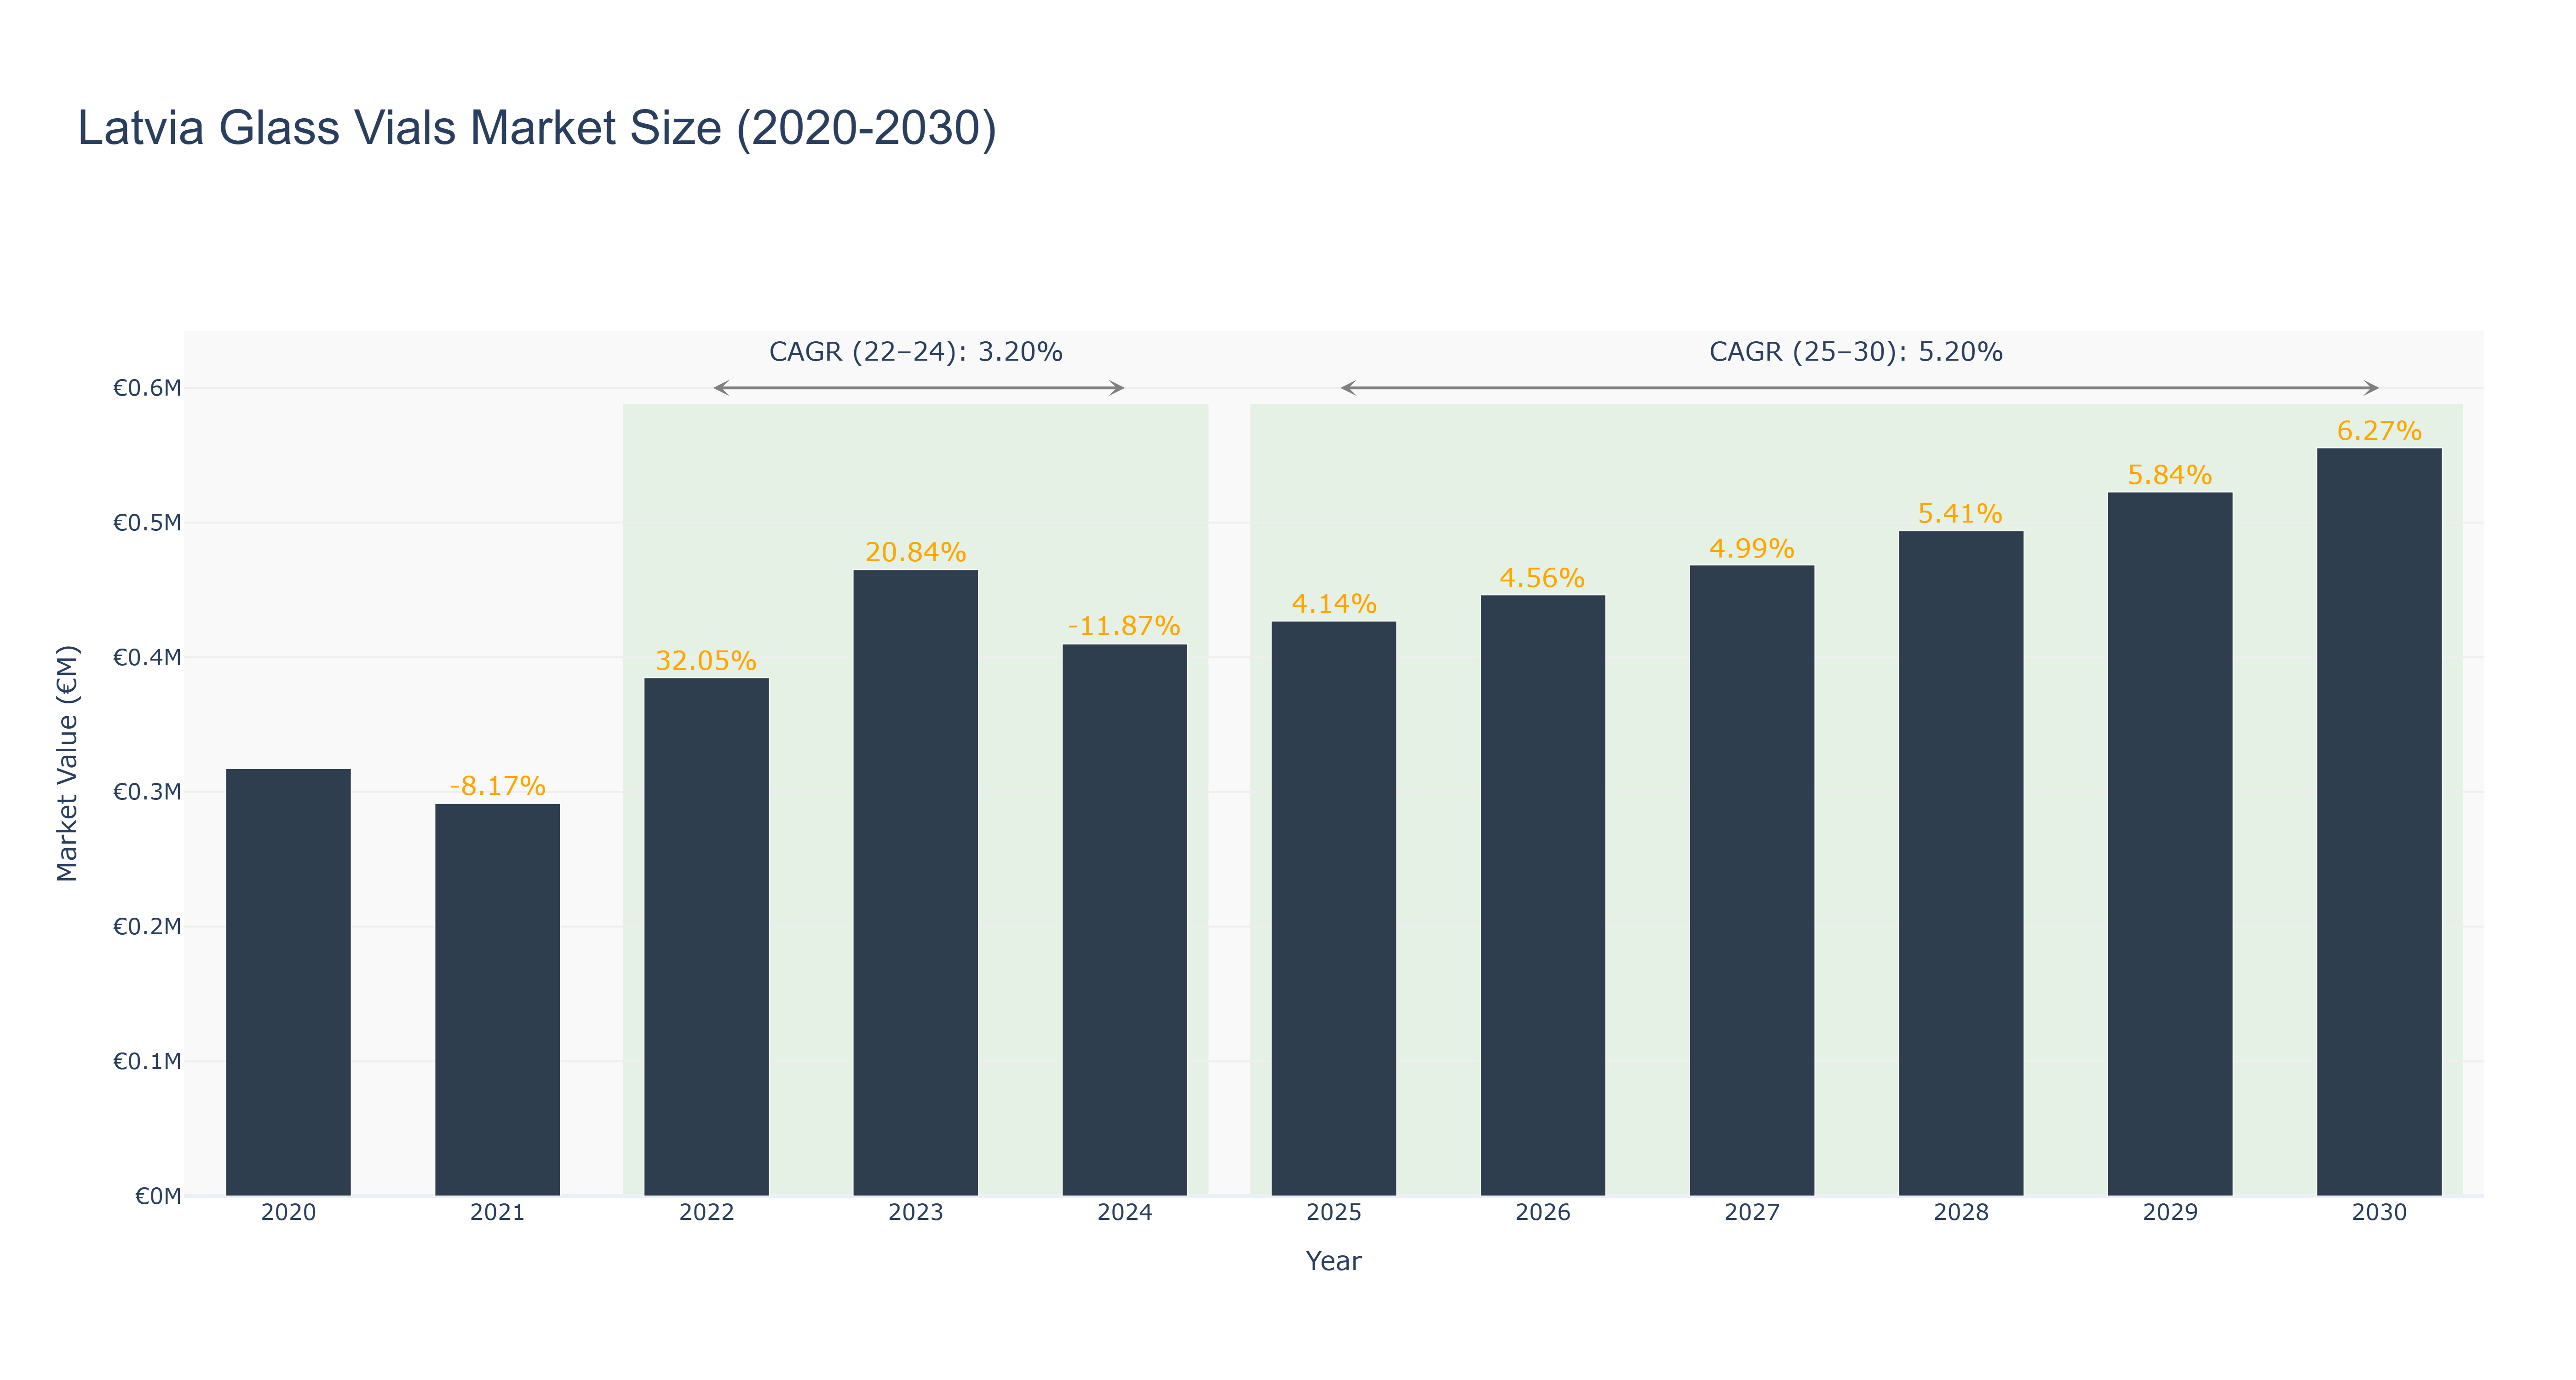
The Latvia Glass Vials Market exhibited notable fluctuations from 2020 to 2024, peaking in 2022 with a market size of €384.84 thousand, driven by increased demand in the pharmaceutical and cosmetic sectors. Following a decline in 2021, the market rebounded with substantial growth rates of 32.05% in 2022 and 20.84% in 2023, before experiencing a downturn to €409.85 thousand in 2024, reflecting a growth decline of -11.87%. The actual CAGR for this period stands at 3.20%. Looking ahead, the market is projected to recover, with forecasted growth rates averaging 5.20% from 2025 to 2030, culminating in a market size of €555.51 thousand by 2030. This anticipated growth is likely fueled by ongoing advancements in packaging technology and an increase in biopharmaceutical production, positioning Latvia as a vital player in the glass vials market in the Baltic region.
Latvia Glass Vials Market: Production & Trade Performance (2019-2025)
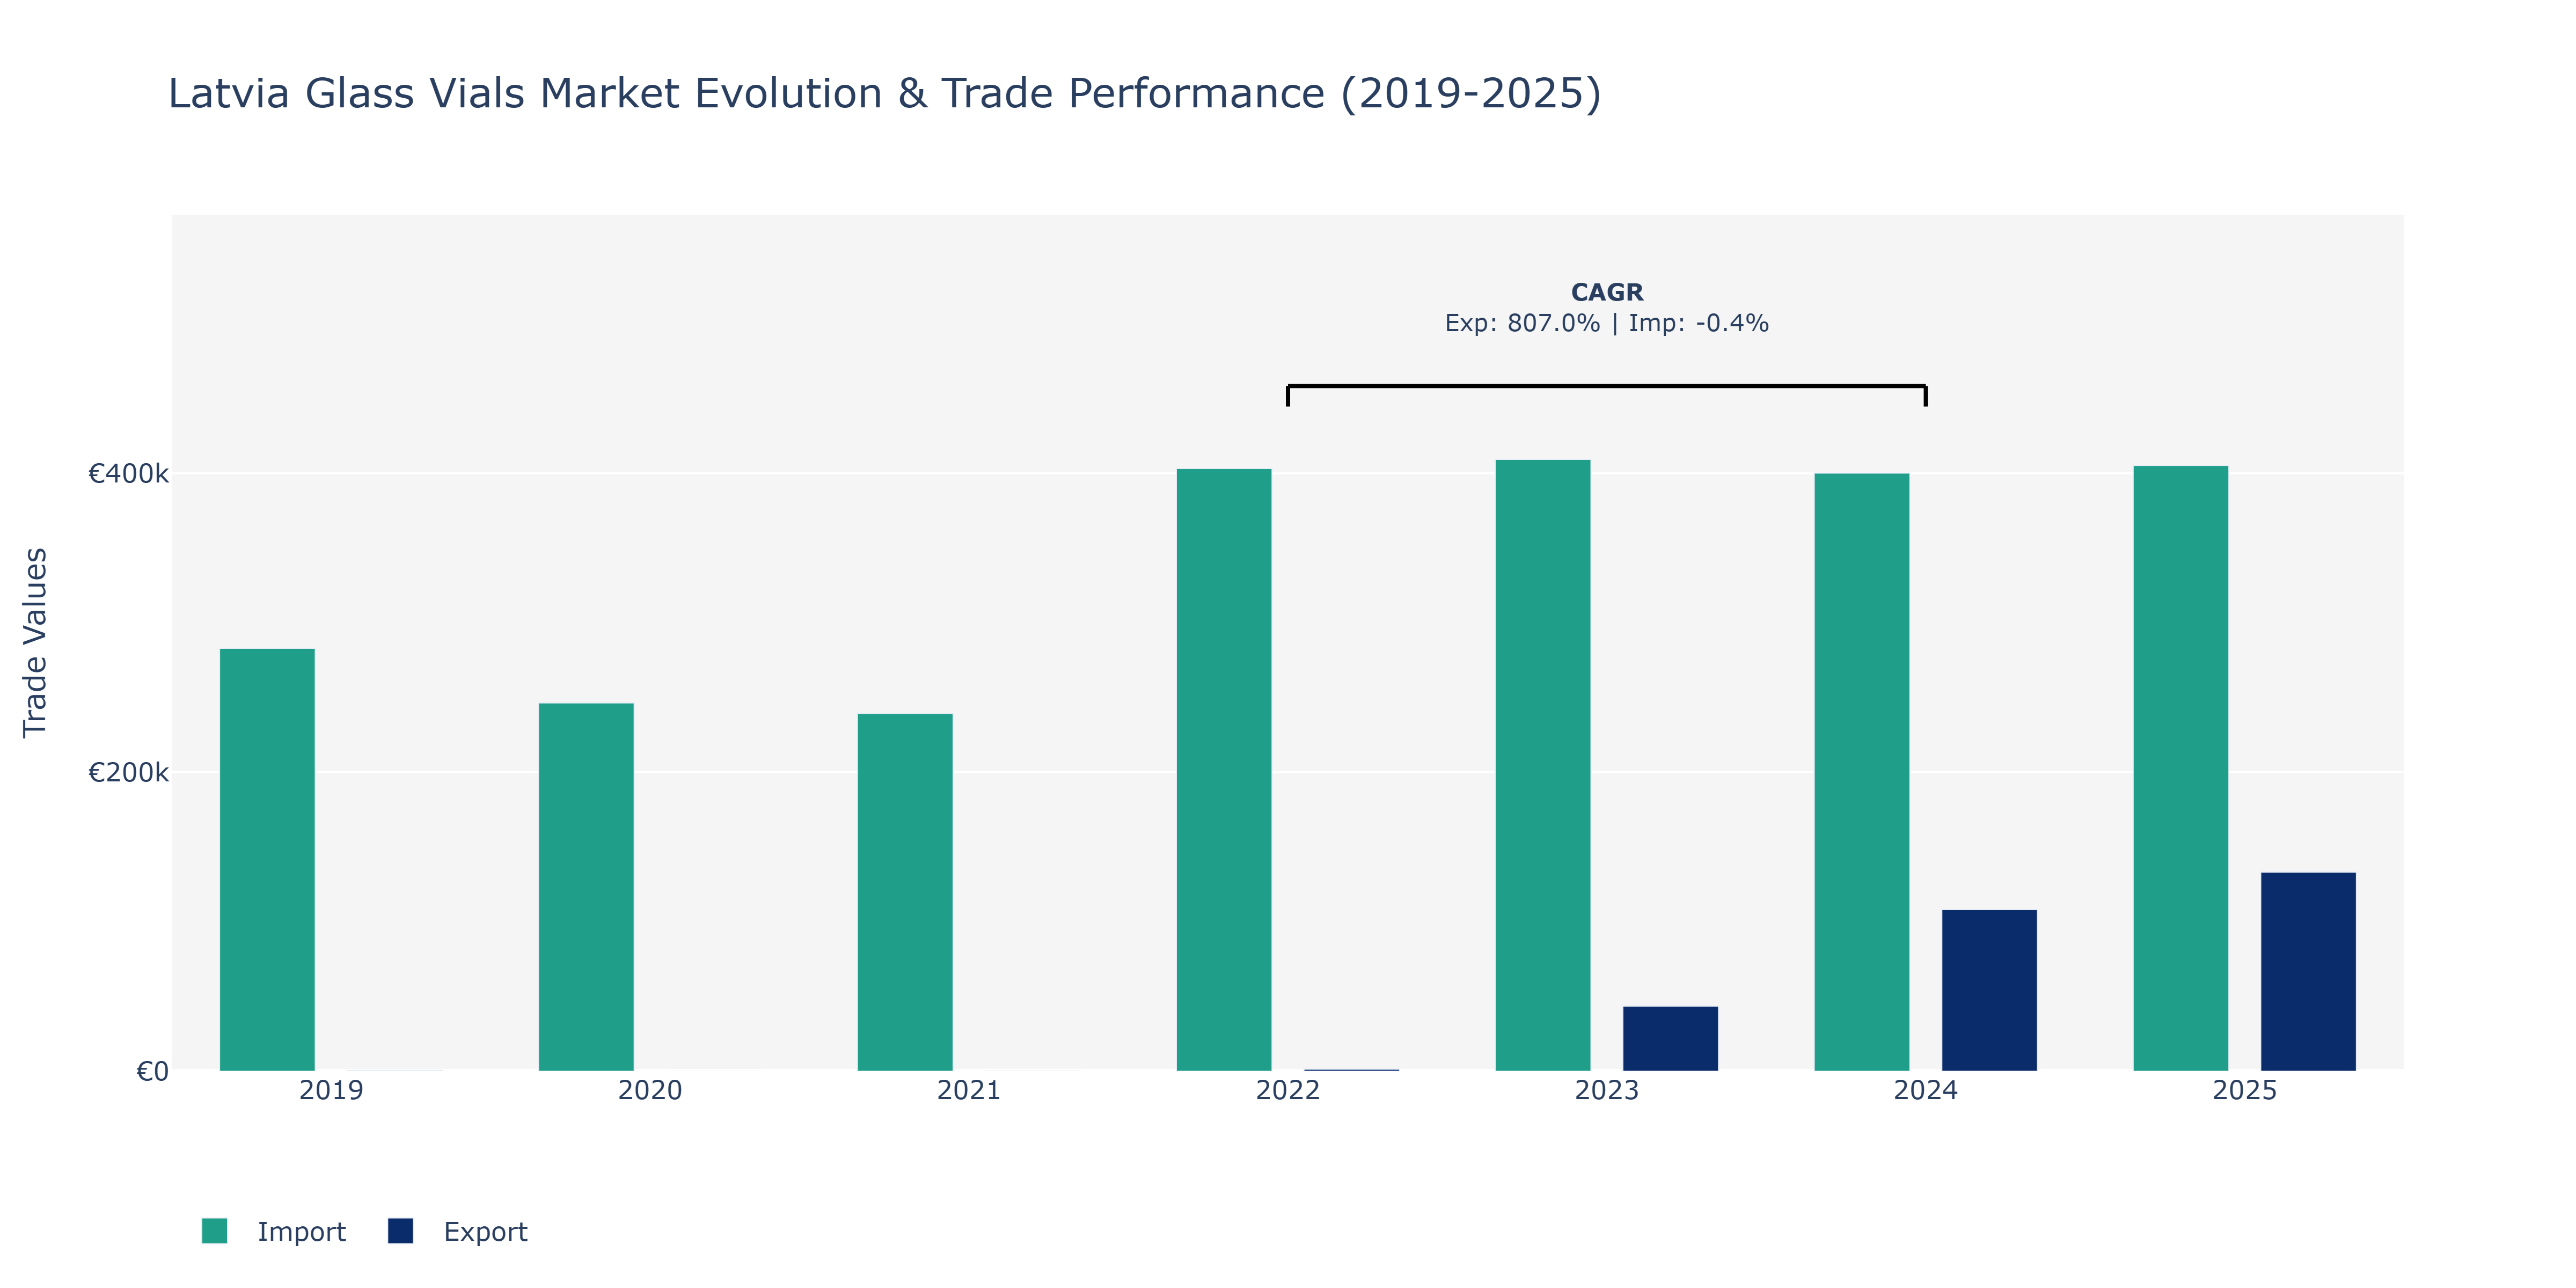
In the Latvia Glass Vials Market, exports exhibited a fluctuating trend over the provided years. Starting at €480 million in 2019, exports dropped significantly to €52 million in 2021 before gradually recovering in the subsequent years, reaching €133.25 million in 2025. Conversely, imports followed a more erratic path, decreasing from €282.92 thousand in 2019 to €246.41 thousand in 2020, then experiencing a slight increase in 2021 before peaking at €409.30 thousand in 2023. Thereafter, imports slightly declined to €405.28 thousand in 2025. The fluctuations in exports could be attributed to market demand variations, potentially influenced by global economic conditions and domestic production capacities. In contrast, the fluctuations in imports might reflect changes in raw material costs, international trade agreements, or shifts in manufacturing locations. To sustain growth, market players could focus on diversifying export markets and optimizing import costs through strategic sourcing decisions and operational efficiencies.
Key Highlights of the Report:
- Latvia Glass Vials Market Outlook
- Market Size of Latvia Glass Vials Market, 2025
- Forecast of Latvia Glass Vials Market, 2032
- Historical Data and Forecast of Latvia Glass Vials Revenues & Volume for the Period 2022 - 2032
- Latvia Glass Vials Market Trend Evolution
- Latvia Glass Vials Market Drivers and Challenges
- Latvia Glass Vials Price Trends
- Latvia Glass Vials Porter's Five Forces
- Latvia Glass Vials Industry Life Cycle
- Historical Data and Forecast of Latvia Glass Vials Market Revenues & Volume By Glass Type for the Period 2022 - 2032
- Historical Data and Forecast of Latvia Glass Vials Market Revenues & Volume By Borosilicate Glass for the Period 2022 - 2032
- Historical Data and Forecast of Latvia Glass Vials Market Revenues & Volume By Fused Silica for the Period 2022 - 2032
- Historical Data and Forecast of Latvia Glass Vials Market Revenues & Volume By Capacity for the Period 2022 - 2032
- Historical Data and Forecast of Latvia Glass Vials Market Revenues & Volume By Up to 2 ML for the Period 2022 - 2032
- Historical Data and Forecast of Latvia Glass Vials Market Revenues & Volume By 3-10 ML for the Period 2022 - 2032
- Historical Data and Forecast of Latvia Glass Vials Market Revenues & Volume By 11-20 ML for the Period 2022 - 2032
- Historical Data and Forecast of Latvia Glass Vials Market Revenues & Volume By Above 20 ML for the Period 2022 - 2032
- Historical Data and Forecast of Latvia Glass Vials Market Revenues & Volume By End Use for the Period 2022 - 2032
- Historical Data and Forecast of Latvia Glass Vials Market Revenues & Volume By Healthcare for the Period 2022 - 2032
- Historical Data and Forecast of Latvia Glass Vials Market Revenues & Volume By Cosmetics & Personal Care for the Period 2022 - 2032
- Historical Data and Forecast of Latvia Glass Vials Market Revenues & Volume By Chemicals for the Period 2022 - 2032
- Latvia Glass Vials Import Export Trade Statistics
- Market Opportunity Assessment By Glass Type
- Market Opportunity Assessment By Capacity
- Market Opportunity Assessment By End Use
- Latvia Glass Vials Top Companies Market Share
- Latvia Glass Vials Competitive Benchmarking By Technical and Operational Parameters
- Latvia Glass Vials Company Profiles
- Latvia Glass Vials Key Strategic Recommendations
Frequently Asked Questions About the Market Study (FAQs):
6Wresearch actively monitors the Latvia Glass Vials Market and publishes its comprehensive annual report, highlighting emerging trends, growth drivers, revenue analysis, and forecast outlook. Our insights help businesses to make data-backed strategic decisions with ongoing market dynamics. Our analysts track relevent industries related to the Latvia Glass Vials Market, allowing our clients with actionable intelligence and reliable forecasts tailored to emerging regional needs.
Yes, we provide customisation as per your requirements. To learn more, feel free to contact us on sales@6wresearch.com
1 Executive Summary |
2 Introduction |
2.1 Key Highlights of the Report |
2.2 Report Description |
2.3 Market Scope & Segmentation |
2.4 Research Methodology |
2.5 Assumptions |
3 Latvia Glass Vials Market Overview |
3.1 Latvia Country Macro Economic Indicators |
3.2 Latvia Glass Vials Market Revenues & Volume, 2022 & 2032F |
3.3 Latvia Glass Vials Market - Industry Life Cycle |
3.4 Latvia Glass Vials Market - Porter's Five Forces |
3.5 Latvia Glass Vials Market Revenues & Volume Share, By Glass Type, 2022 & 2032F |
3.6 Latvia Glass Vials Market Revenues & Volume Share, By Capacity, 2022 & 2032F |
3.7 Latvia Glass Vials Market Revenues & Volume Share, By End Use, 2022 & 2032F |
4 Latvia Glass Vials Market Dynamics |
4.1 Impact Analysis |
4.2 Market Drivers |
4.3 Market Restraints |
5 Latvia Glass Vials Market Trends |
6 Latvia Glass Vials Market, By Types |
6.1 Latvia Glass Vials Market, By Glass Type |
6.1.1 Overview and Analysis |
6.1.2 Latvia Glass Vials Market Revenues & Volume, By Glass Type, 2022 - 2032F |
6.1.3 Latvia Glass Vials Market Revenues & Volume, By Borosilicate Glass, 2022 - 2032F |
6.1.4 Latvia Glass Vials Market Revenues & Volume, By Fused Silica, 2022 - 2032F |
6.2 Latvia Glass Vials Market, By Capacity |
6.2.1 Overview and Analysis |
6.2.2 Latvia Glass Vials Market Revenues & Volume, By Up to 2 ML, 2022 - 2032F |
6.2.3 Latvia Glass Vials Market Revenues & Volume, By 3-10 ML, 2022 - 2032F |
6.2.4 Latvia Glass Vials Market Revenues & Volume, By 11-20 ML, 2022 - 2032F |
6.2.5 Latvia Glass Vials Market Revenues & Volume, By Above 20 ML, 2022 - 2032F |
6.3 Latvia Glass Vials Market, By End Use |
6.3.1 Overview and Analysis |
6.3.2 Latvia Glass Vials Market Revenues & Volume, By Healthcare, 2022 - 2032F |
6.3.3 Latvia Glass Vials Market Revenues & Volume, By Cosmetics & Personal Care, 2022 - 2032F |
6.3.4 Latvia Glass Vials Market Revenues & Volume, By Chemicals, 2022 - 2032F |
7 Latvia Glass Vials Market Import-Export Trade Statistics |
7.1 Latvia Glass Vials Market Export to Major Countries |
7.2 Latvia Glass Vials Market Imports from Major Countries |
8 Latvia Glass Vials Market Key Performance Indicators |
9 Latvia Glass Vials Market - Opportunity Assessment |
9.1 Latvia Glass Vials Market Opportunity Assessment, By Glass Type, 2022 & 2032F |
9.2 Latvia Glass Vials Market Opportunity Assessment, By Capacity, 2022 & 2032F |
9.3 Latvia Glass Vials Market Opportunity Assessment, By End Use, 2022 & 2032F |
10 Latvia Glass Vials Market - Competitive Landscape |
10.1 Latvia Glass Vials Market Revenue Share, By Companies, 2025 |
10.2 Latvia Glass Vials Market Competitive Benchmarking, By Operating and Technical Parameters |
11 Company Profiles |
12 Recommendations |
13 Disclaimer |
Export potential assessment - trade Analytics for 2030
Export potential enables firms to identify high-growth global markets with greater confidence by combining advanced trade intelligence with a structured quantitative methodology. The framework analyzes emerging demand trends and country-level import patterns while integrating macroeconomic and trade datasets such as GDP and population forecasts, bilateral import–export flows, tariff structures, elasticity differentials between developed and developing economies, geographic distance, and import demand projections. Using weighted trade values from 2020–2024 as the base period to project country-to-country export potential for 2030, these inputs are operationalized through calculated drivers such as gravity model parameters, tariff impact factors, and projected GDP per-capita growth. Through an analysis of hidden potentials, demand hotspots, and market conditions that are most favorable to success, this method enables firms to focus on target countries, maximize returns, and global expansion with data, backed by accuracy.
By factoring in the projected importer demand gap that is currently unmet and could be potential opportunity, it identifies the potential for the Exporter (Country) among 190 countries, against the general trade analysis, which identifies the biggest importer or exporter.
To discover high-growth global markets and optimize your business strategy:
Click Here
Pricing
- Single User License$ 1,995
- Department License$ 2,400
- Site License$ 3,120
- Global License$ 3,795

Search
Thought Leadership and Analyst Meet


Our Clients
Latest Reports
- India Ultrasonic Smart Water Meter Market (2026-2032) | Outlook, Competition, Drivers, Trends, Demand, Competitive, Strategic Insights, Companies, Challenges, Strategy, Consumer Insights, Analysis, Opportunities, Growth, Size, Share, Industry, Revenue, Segments, Value, Segmentation, Supply, Forecast, Restraints,
- India Electromagnetic Bulk Flow Meter Market (2026-2032) | Analysis, Challenges, Strategic Insights, Supply, Forecast, Growth, Share, Consumer Insights, Competitive, Value, Outlook, Size & Demand,
- India Battery Powered Bulk Flow Meter Market (2026-2032) | Outlook, Analysis, Competitive Landscape, Growth, Size, Trends, Value, Revenue, Companies, Segmentation, Share & Forecast
- Bosnia and Herzegovina Fuel-Efficient Winglets Market (2026-2032) | Growth, Competition, Strategy, Restraints, Trends, Challenges, segmentation, Value, Outlook, Investment Opportunities, Analysis, Revenue, Companies, Insights, Pricing, Size, Drivers, Demand, Share, Forecast
- Canada Cloud CFD Market (2026-2032) | Size & Revenue, Industry, Growth, Competitive Landscape, Forecast, Segmentation, Value, Outlook, Trends, Share, Analysis, Companies
- Taiwan Food Delivery Platform Market (2026-2032) | Companies, Outlook, Analysis, Trends, Value, Revenue, Segmentation, Share, Forecast, Competitive Landscape, Growth, Size & Forecast
- United Kingdom (UK) Long-term Care Insurance Market (2026-2032) | Growth, Share, Consumer Insights, Drivers, Opportunities, Competition, Pricing Analysis, Segments, Restraints, Companies, Competitive, Value, Outlook, Size, Demand, Analysis, Challenges, Strategic Insights, Investment Trends, Revenue, Trends, Supply, Forecast
- United Kingdom (UK) Long Term Care Market (2026-2032) | Companies, Outlook, Analysis, Trends, Value, Revenue, Segmentation, Share, Forecast, Competitive Landscape, Growth, Size & Forecast
- Iraq Insulation and Waterproofing Market (2026-2032) | Outlook, Drivers, Growth, Size, Share, Industry, Revenue, Trends, Demand, Competitive, Strategic Insights, Opportunities, Segments, Companies, Challenges, Strategy, Consumer Insights, Analysis, Investment Trends, Value, Segmentation, Forecast, Restraints
- India Switchgear Market Outlook (2026-2032) | Size, Share, Trends, Growth, Revenue, Forecast, Analysis, Value, Outlook
Industry Events and Analyst Meet

India EV Show 2026

EV tech India Expo 2026

Auto Tech Asia 2026

Battery Tech India 2026

Smart Production Solutions Guangzhou 2026
Whitepaper
- Middle East & Africa Commercial Security Market Click here to view more.
- Middle East & Africa Fire Safety Systems & Equipment Market Click here to view more.
- GCC Drone Market Click here to view more.
- Middle East Lighting Fixture Market Click here to view more.
- GCC Physical & Perimeter Security Market Click here to view more.
6WResearch In News
- Doha a strategic location for EV manufacturing hub: IPA Qatar
- Demand for luxury TVs surging in the GCC, says Samsung
- Empowering Growth: The Thriving Journey of Bangladesh’s Cable Industry
- Demand for luxury TVs surging in the GCC, says Samsung
- Video call with a traditional healer? Once unthinkable, it’s now common in South Africa
- Intelligent Buildings To Smooth GCC’s Path To Net Zero