Latvia Hydrazine Market (2026-2032) | Trends, Share, Analysis, Growth, Forecast, Outlook, Segmentation, Size, Value, Revenue, Companies & Industry
Market Forecast By Type (Hydrazine Hydrate, Hydrazine Nitrate, Hydrazine Sulfate, Other Types), By Application (Corrosion Inhibitor, Explosives, Medicinal Ingredient, Rocket Fuel, Precursor to Pesticides, Blowing Agent, Other Applications), By End-users (Pharmaceuticals, Agrochemicals, Industrial, Other End-user Industries) And Competitive Landscape
| Product Code: ETC4741504 | Publication Date: Nov 2023 | Updated Date: Apr 2026 | Product Type: Market Research Report | |
| Publisher: 6Wresearch | Author: Shubham Padhi | No. of Pages: 60 | No. of Figures: 30 | No. of Tables: 5 |
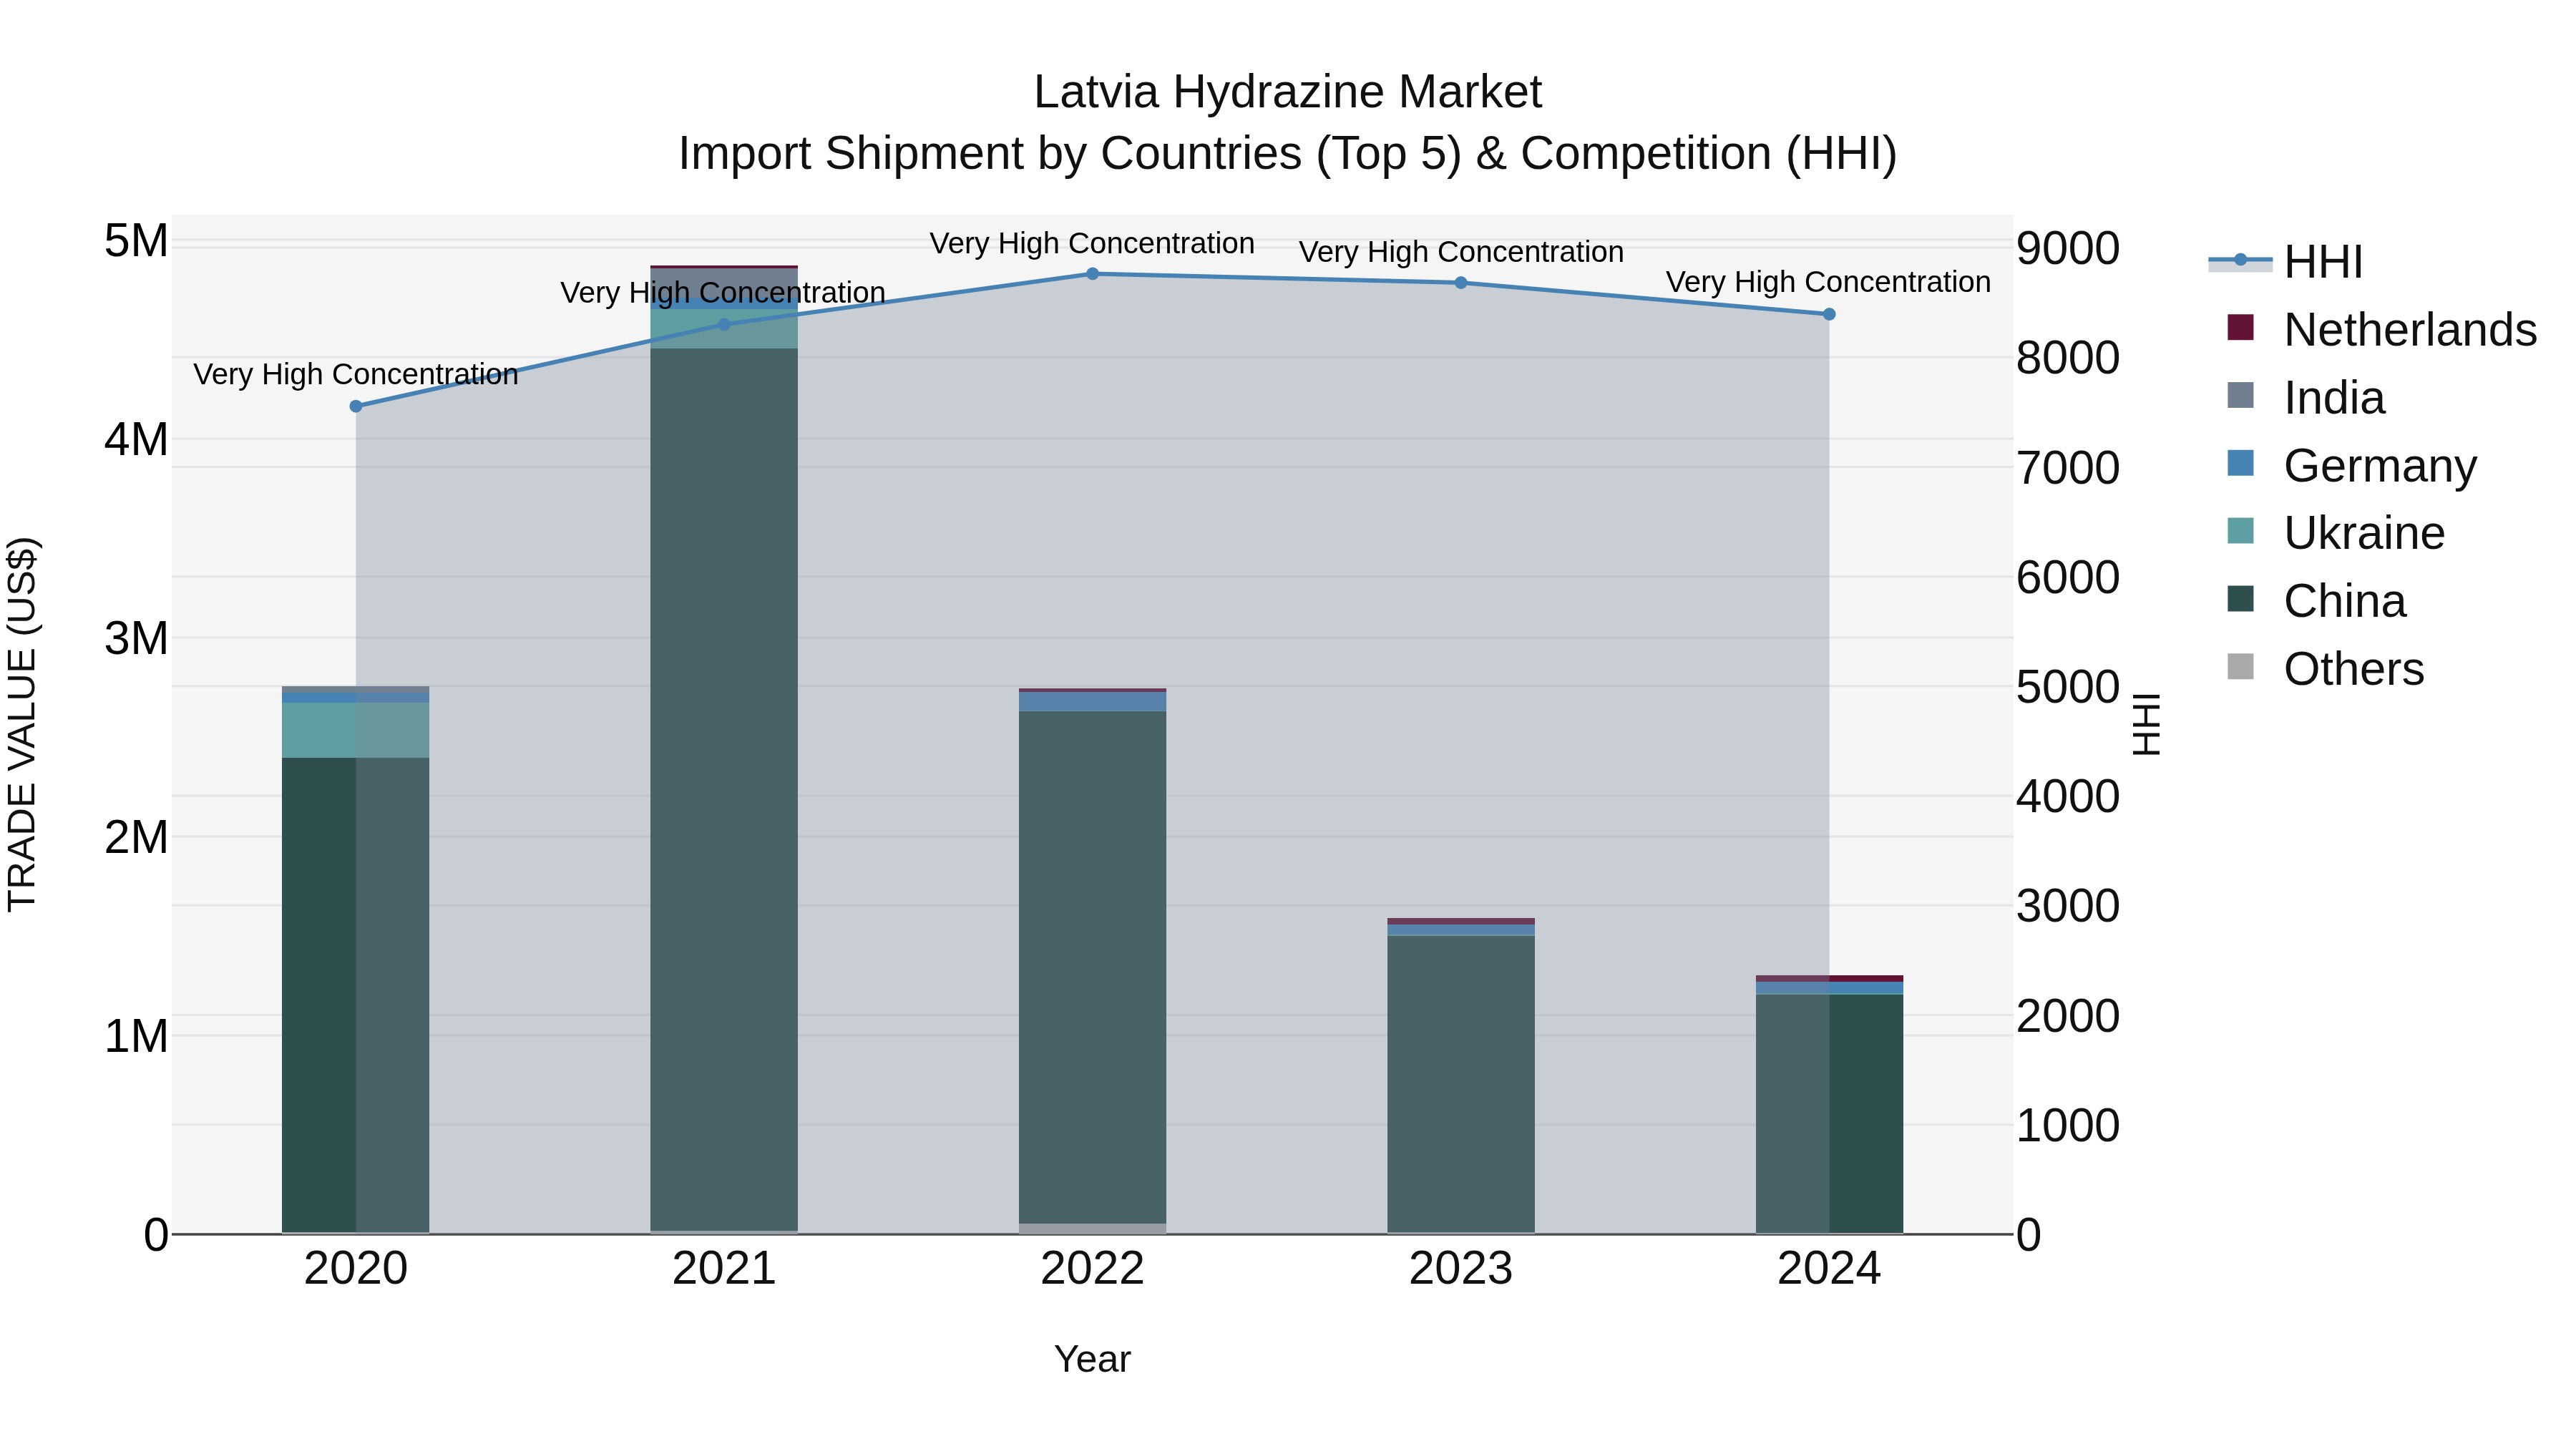
Latvia Hydrazine Market Top 5 Importing Countries and Market Competition (HHI) Analysis
In 2024, Latvia`s hydrazine import market continued to showcase high concentration with top exporters including China, Germany, Netherlands, Ukraine, and Metropolitan France. Despite a declining Compound Annual Growth Rate (CAGR) of -17.07% from 2020 to 2024, the market experienced a steep growth rate decrease of -17.99% in 2024 alone. This trend suggests a challenging environment for hydrazine importers in Latvia, indicating the need for strategic adjustments to navigate the evolving market dynamics and maintain competitiveness.
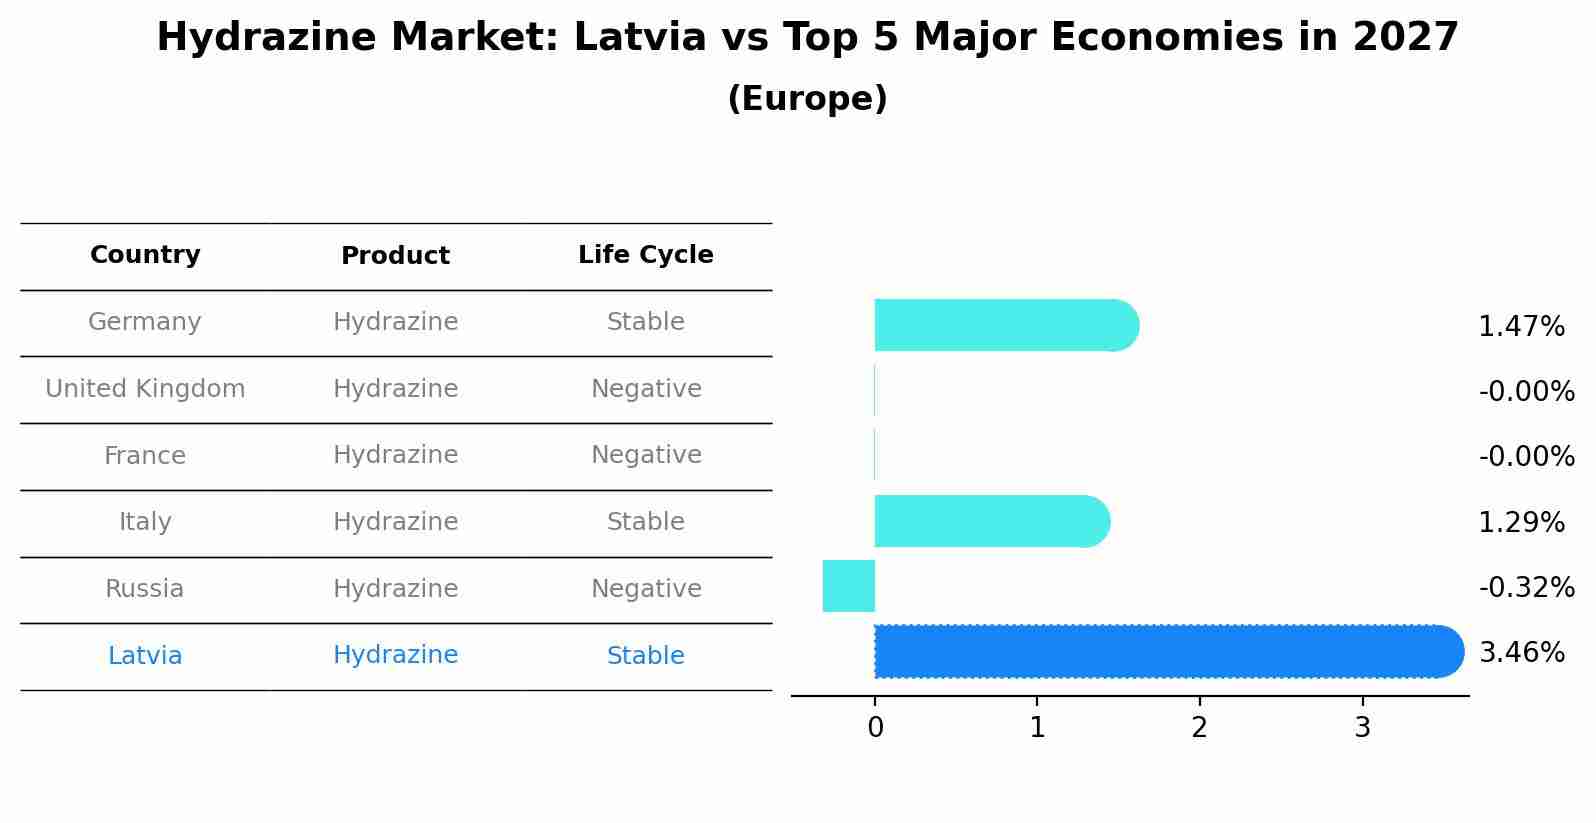
Hydrazine Market: Latvia vs Top 5 Major Economies in 2027 (Europe)
By 2027, the Hydrazine market in Latvia is anticipated to reach a growth rate of 3.46%, as part of an increasingly competitive Europe region, where Germany remains at the forefront, supported by United Kingdom, France, Italy and Russia, driving innovations and market adoption across sectors.
Key Highlights of the Report:
- Latvia Hydrazine Market Outlook
- Market Size of Latvia Hydrazine Market, 2025
- Forecast of Latvia Hydrazine Market, 2032
- Historical Data and Forecast of Latvia Hydrazine Revenues & Volume for the Period 2022 - 2032F
- Latvia Hydrazine Market Trend Evolution
- Latvia Hydrazine Market Drivers and Challenges
- Latvia Hydrazine Price Trends
- Latvia Hydrazine Porter`s Five Forces
- Latvia Hydrazine Industry Life Cycle
- Historical Data and Forecast of Latvia Hydrazine Market Revenues & Volume By Type for the Period 2022 - 2032F
- Historical Data and Forecast of Latvia Hydrazine Market Revenues & Volume By Hydrazine Hydrate for the Period 2022 - 2032F
- Historical Data and Forecast of Latvia Hydrazine Market Revenues & Volume By Hydrazine Nitrate for the Period 2022 - 2032F
- Historical Data and Forecast of Latvia Hydrazine Market Revenues & Volume By Hydrazine Sulfate for the Period 2022 - 2032F
- Historical Data and Forecast of Latvia Hydrazine Market Revenues & Volume By Other Types for the Period 2022 - 2032F
- Historical Data and Forecast of Latvia Hydrazine Market Revenues & Volume By Application for the Period 2022 - 2032F
- Historical Data and Forecast of Latvia Hydrazine Market Revenues & Volume By Corrosion Inhibitor for the Period 2022 - 2032F
- Historical Data and Forecast of Latvia Hydrazine Market Revenues & Volume By Explosives for the Period 2022 - 2032F
- Historical Data and Forecast of Latvia Hydrazine Market Revenues & Volume By Medicinal Ingredient for the Period 2022 - 2032F
- Historical Data and Forecast of Latvia Hydrazine Market Revenues & Volume By Rocket Fuel for the Period 2022 - 2032F
- Historical Data and Forecast of Latvia Hydrazine Market Revenues & Volume By Precursor to Pesticides for the Period 2022 - 2032F
- Historical Data and Forecast of Latvia Hydrazine Market Revenues & Volume By Blowing Agent for the Period 2022 - 2032F
- Historical Data and Forecast of Latvia Hydrazine Market Revenues & Volume By Other Applications for the Period 2022 - 2032F
- Historical Data and Forecast of Latvia Hydrazine Market Revenues & Volume By End-users for the Period 2022 - 2032F
- Historical Data and Forecast of Latvia Hydrazine Market Revenues & Volume By Pharmaceuticals for the Period 2022 - 2032F
- Historical Data and Forecast of Latvia Hydrazine Market Revenues & Volume By Agrochemicals for the Period 2022 - 2032F
- Historical Data and Forecast of Latvia Hydrazine Market Revenues & Volume By Industrial for the Period 2022 - 2032F
- Historical Data and Forecast of Latvia Hydrazine Market Revenues & Volume By Other End-user Industries for the Period 2022 - 2032F
- Latvia Hydrazine Import Export Trade Statistics
- Market Opportunity Assessment By Type
- Market Opportunity Assessment By Application
- Market Opportunity Assessment By End-users
- Latvia Hydrazine Top Companies Market Share
- Latvia Hydrazine Competitive Benchmarking By Technical and Operational Parameters
- Latvia Hydrazine Company Profiles
- Latvia Hydrazine Key Strategic Recommendations
Frequently Asked Questions About the Market Study (FAQs):
6Wresearch actively monitors the Latvia Hydrazine Market and publishes its comprehensive annual report, highlighting emerging trends, growth drivers, revenue analysis, and forecast outlook. Our insights help businesses to make data-backed strategic decisions with ongoing market dynamics. Our analysts track relevent industries related to the Latvia Hydrazine Market, allowing our clients with actionable intelligence and reliable forecasts tailored to emerging regional needs.
Yes, we provide customisation as per your requirements. To learn more, feel free to contact us on sales@6wresearch.com
1 Executive Summary |
2 Introduction |
2.1 Key Highlights of the Report |
2.2 Report Description |
2.3 Market Scope & Segmentation |
2.4 Research Methodology |
2.5 Assumptions |
3 Latvia Hydrazine Market Overview |
3.1 Latvia Country Macro Economic Indicators |
3.2 Latvia Hydrazine Market Revenues & Volume, 2022 & 2032F |
3.3 Latvia Hydrazine Market - Industry Life Cycle |
3.4 Latvia Hydrazine Market - Porter's Five Forces |
3.5 Latvia Hydrazine Market Revenues & Volume Share, By Type, 2022 & 2032F |
3.6 Latvia Hydrazine Market Revenues & Volume Share, By Application, 2022 & 2032F |
3.7 Latvia Hydrazine Market Revenues & Volume Share, By End-users, 2022 & 2032F |
4 Latvia Hydrazine Market Dynamics |
4.1 Impact Analysis |
4.2 Market Drivers |
4.2.1 Increasing demand for hydrazine in the aerospace industry for rocket fuel and satellite propulsion systems. |
4.2.2 Growing use of hydrazine in the pharmaceutical industry for the synthesis of pharmaceutical compounds. |
4.2.3 Rise in research and development activities for the use of hydrazine in water treatment and agriculture. |
4.3 Market Restraints |
4.3.1 Stringent regulations regarding the handling and disposal of hydrazine due to its toxic and hazardous nature. |
4.3.2 Volatility in raw material prices such as ammonia, which is a key ingredient in hydrazine production. |
4.3.3 Competition from alternative chemicals and technologies that offer similar functionalities but with lower risks. |
5 Latvia Hydrazine Market Trends |
6 Latvia Hydrazine Market Segmentations |
6.1 Latvia Hydrazine Market, By Type |
6.1.1 Overview and Analysis |
6.1.2 Latvia Hydrazine Market Revenues & Volume, By Hydrazine Hydrate, 2022 - 2032F |
6.1.3 Latvia Hydrazine Market Revenues & Volume, By Hydrazine Nitrate, 2022 - 2032F |
6.1.4 Latvia Hydrazine Market Revenues & Volume, By Hydrazine Sulfate, 2022 - 2032F |
6.1.5 Latvia Hydrazine Market Revenues & Volume, By Other Types, 2022 - 2032F |
6.2 Latvia Hydrazine Market, By Application |
6.2.1 Overview and Analysis |
6.2.2 Latvia Hydrazine Market Revenues & Volume, By Corrosion Inhibitor, 2022 - 2032F |
6.2.3 Latvia Hydrazine Market Revenues & Volume, By Explosives, 2022 - 2032F |
6.2.4 Latvia Hydrazine Market Revenues & Volume, By Medicinal Ingredient, 2022 - 2032F |
6.2.5 Latvia Hydrazine Market Revenues & Volume, By Rocket Fuel, 2022 - 2032F |
6.2.6 Latvia Hydrazine Market Revenues & Volume, By Precursor to Pesticides, 2022 - 2032F |
6.2.7 Latvia Hydrazine Market Revenues & Volume, By Blowing Agent, 2022 - 2032F |
6.3 Latvia Hydrazine Market, By End-users |
6.3.1 Overview and Analysis |
6.3.2 Latvia Hydrazine Market Revenues & Volume, By Pharmaceuticals, 2022 - 2032F |
6.3.3 Latvia Hydrazine Market Revenues & Volume, By Agrochemicals, 2022 - 2032F |
6.3.4 Latvia Hydrazine Market Revenues & Volume, By Industrial, 2022 - 2032F |
6.3.5 Latvia Hydrazine Market Revenues & Volume, By Other End-user Industries, 2022 - 2032F |
7 Latvia Hydrazine Market Import-Export Trade Statistics |
7.1 Latvia Hydrazine Market Export to Major Countries |
7.2 Latvia Hydrazine Market Imports from Major Countries |
8 Latvia Hydrazine Market Key Performance Indicators |
8.1 Research and development investment in hydrazine-based applications. |
8.2 Adoption rate of hydrazine in emerging industries such as renewable energy and electronics. |
8.3 Number of patents filed for new hydrazine formulations or applications. |
8.4 Environmental impact assessment metrics for hydrazine production and usage. |
8.5 Supplier diversification and supply chain resilience metrics. |
9 Latvia Hydrazine Market - Opportunity Assessment |
9.1 Latvia Hydrazine Market Opportunity Assessment, By Type, 2022 & 2032F |
9.2 Latvia Hydrazine Market Opportunity Assessment, By Application, 2022 & 2032F |
9.3 Latvia Hydrazine Market Opportunity Assessment, By End-users, 2022 & 2032F |
10 Latvia Hydrazine Market - Competitive Landscape |
10.1 Latvia Hydrazine Market Revenue Share, By Companies, 2025 |
10.2 Latvia Hydrazine Market Competitive Benchmarking, By Operating and Technical Parameters |
11 Company Profiles |
12 Recommendations | 13 Disclaimer |
Export potential assessment - trade Analytics for 2030
Export potential enables firms to identify high-growth global markets with greater confidence by combining advanced trade intelligence with a structured quantitative methodology. The framework analyzes emerging demand trends and country-level import patterns while integrating macroeconomic and trade datasets such as GDP and population forecasts, bilateral import–export flows, tariff structures, elasticity differentials between developed and developing economies, geographic distance, and import demand projections. Using weighted trade values from 2020–2024 as the base period to project country-to-country export potential for 2030, these inputs are operationalized through calculated drivers such as gravity model parameters, tariff impact factors, and projected GDP per-capita growth. Through an analysis of hidden potentials, demand hotspots, and market conditions that are most favorable to success, this method enables firms to focus on target countries, maximize returns, and global expansion with data, backed by accuracy.
By factoring in the projected importer demand gap that is currently unmet and could be potential opportunity, it identifies the potential for the Exporter (Country) among 190 countries, against the general trade analysis, which identifies the biggest importer or exporter.
To discover high-growth global markets and optimize your business strategy:
Click Here
Pricing
- Single User License$ 1,995
- Department License$ 2,400
- Site License$ 3,120
- Global License$ 3,795

Thought Leadership
Search
Thought Leadership and Analyst Meet


Our Clients
Latest Reports
- New Zealand Aseptic Manufacturing Market (2026-2032)
- Netherlands Aseptic Manufacturing Market (2026-2032)
- Nauru Aseptic Manufacturing Market (2026-2032)
- Namibia Aseptic Manufacturing Market (2026-2032)
- Mozambique Aseptic Manufacturing Market (2026-2032)
- Montenegro Aseptic Manufacturing Market (2026-2032)
- Mongolia Aseptic Manufacturing Market (2026-2032)
- Monaco Aseptic Manufacturing Market (2026-2032)
- Micronesia Aseptic Manufacturing Market (2026-2032)
- Mauritius Aseptic Manufacturing Market (2026-2032)
Industry Events and Analyst Meet

HIMTEX 2026

India Refining Summit 2026

India EV Show 2026

EV tech India Expo 2026

Auto Tech Asia 2026
Whitepaper
- Middle East & Africa Commercial Security Market Click here to view more.
- Middle East & Africa Fire Safety Systems & Equipment Market Click here to view more.
- GCC Drone Market Click here to view more.
- Middle East Lighting Fixture Market Click here to view more.
- GCC Physical & Perimeter Security Market Click here to view more.
6WResearch In News
- Doha a strategic location for EV manufacturing hub: IPA Qatar
- Demand for luxury TVs surging in the GCC, says Samsung
- Empowering Growth: The Thriving Journey of Bangladesh’s Cable Industry
- Demand for luxury TVs surging in the GCC, says Samsung
- Video call with a traditional healer? Once unthinkable, it’s now common in South Africa
- Intelligent Buildings To Smooth GCC’s Path To Net Zero