Latvia Microspheres Market (2026-2032) | Share, Value, Analysis, Forecast, Size, Growth, Revenue, Trends, Segmentation, Outlook, Industry & Companies
Market Forecast By Type (Hollow, Solid), By Raw Material (Glass, Ceramic, Fly Ash, Polymer, Metallic), By Application (Construction Composites, Medical Technology, Cosmetics & Personal Care, Automotive, Oil & Gas) And Competitive Landscape
| Product Code: ETC5706134 | Publication Date: Nov 2023 | Updated Date: Mar 2026 | Product Type: Market Research Report | |
| Publisher: 6Wresearch | Author: Ravi Bhandari | No. of Pages: 60 | No. of Figures: 30 | No. of Tables: 5 |
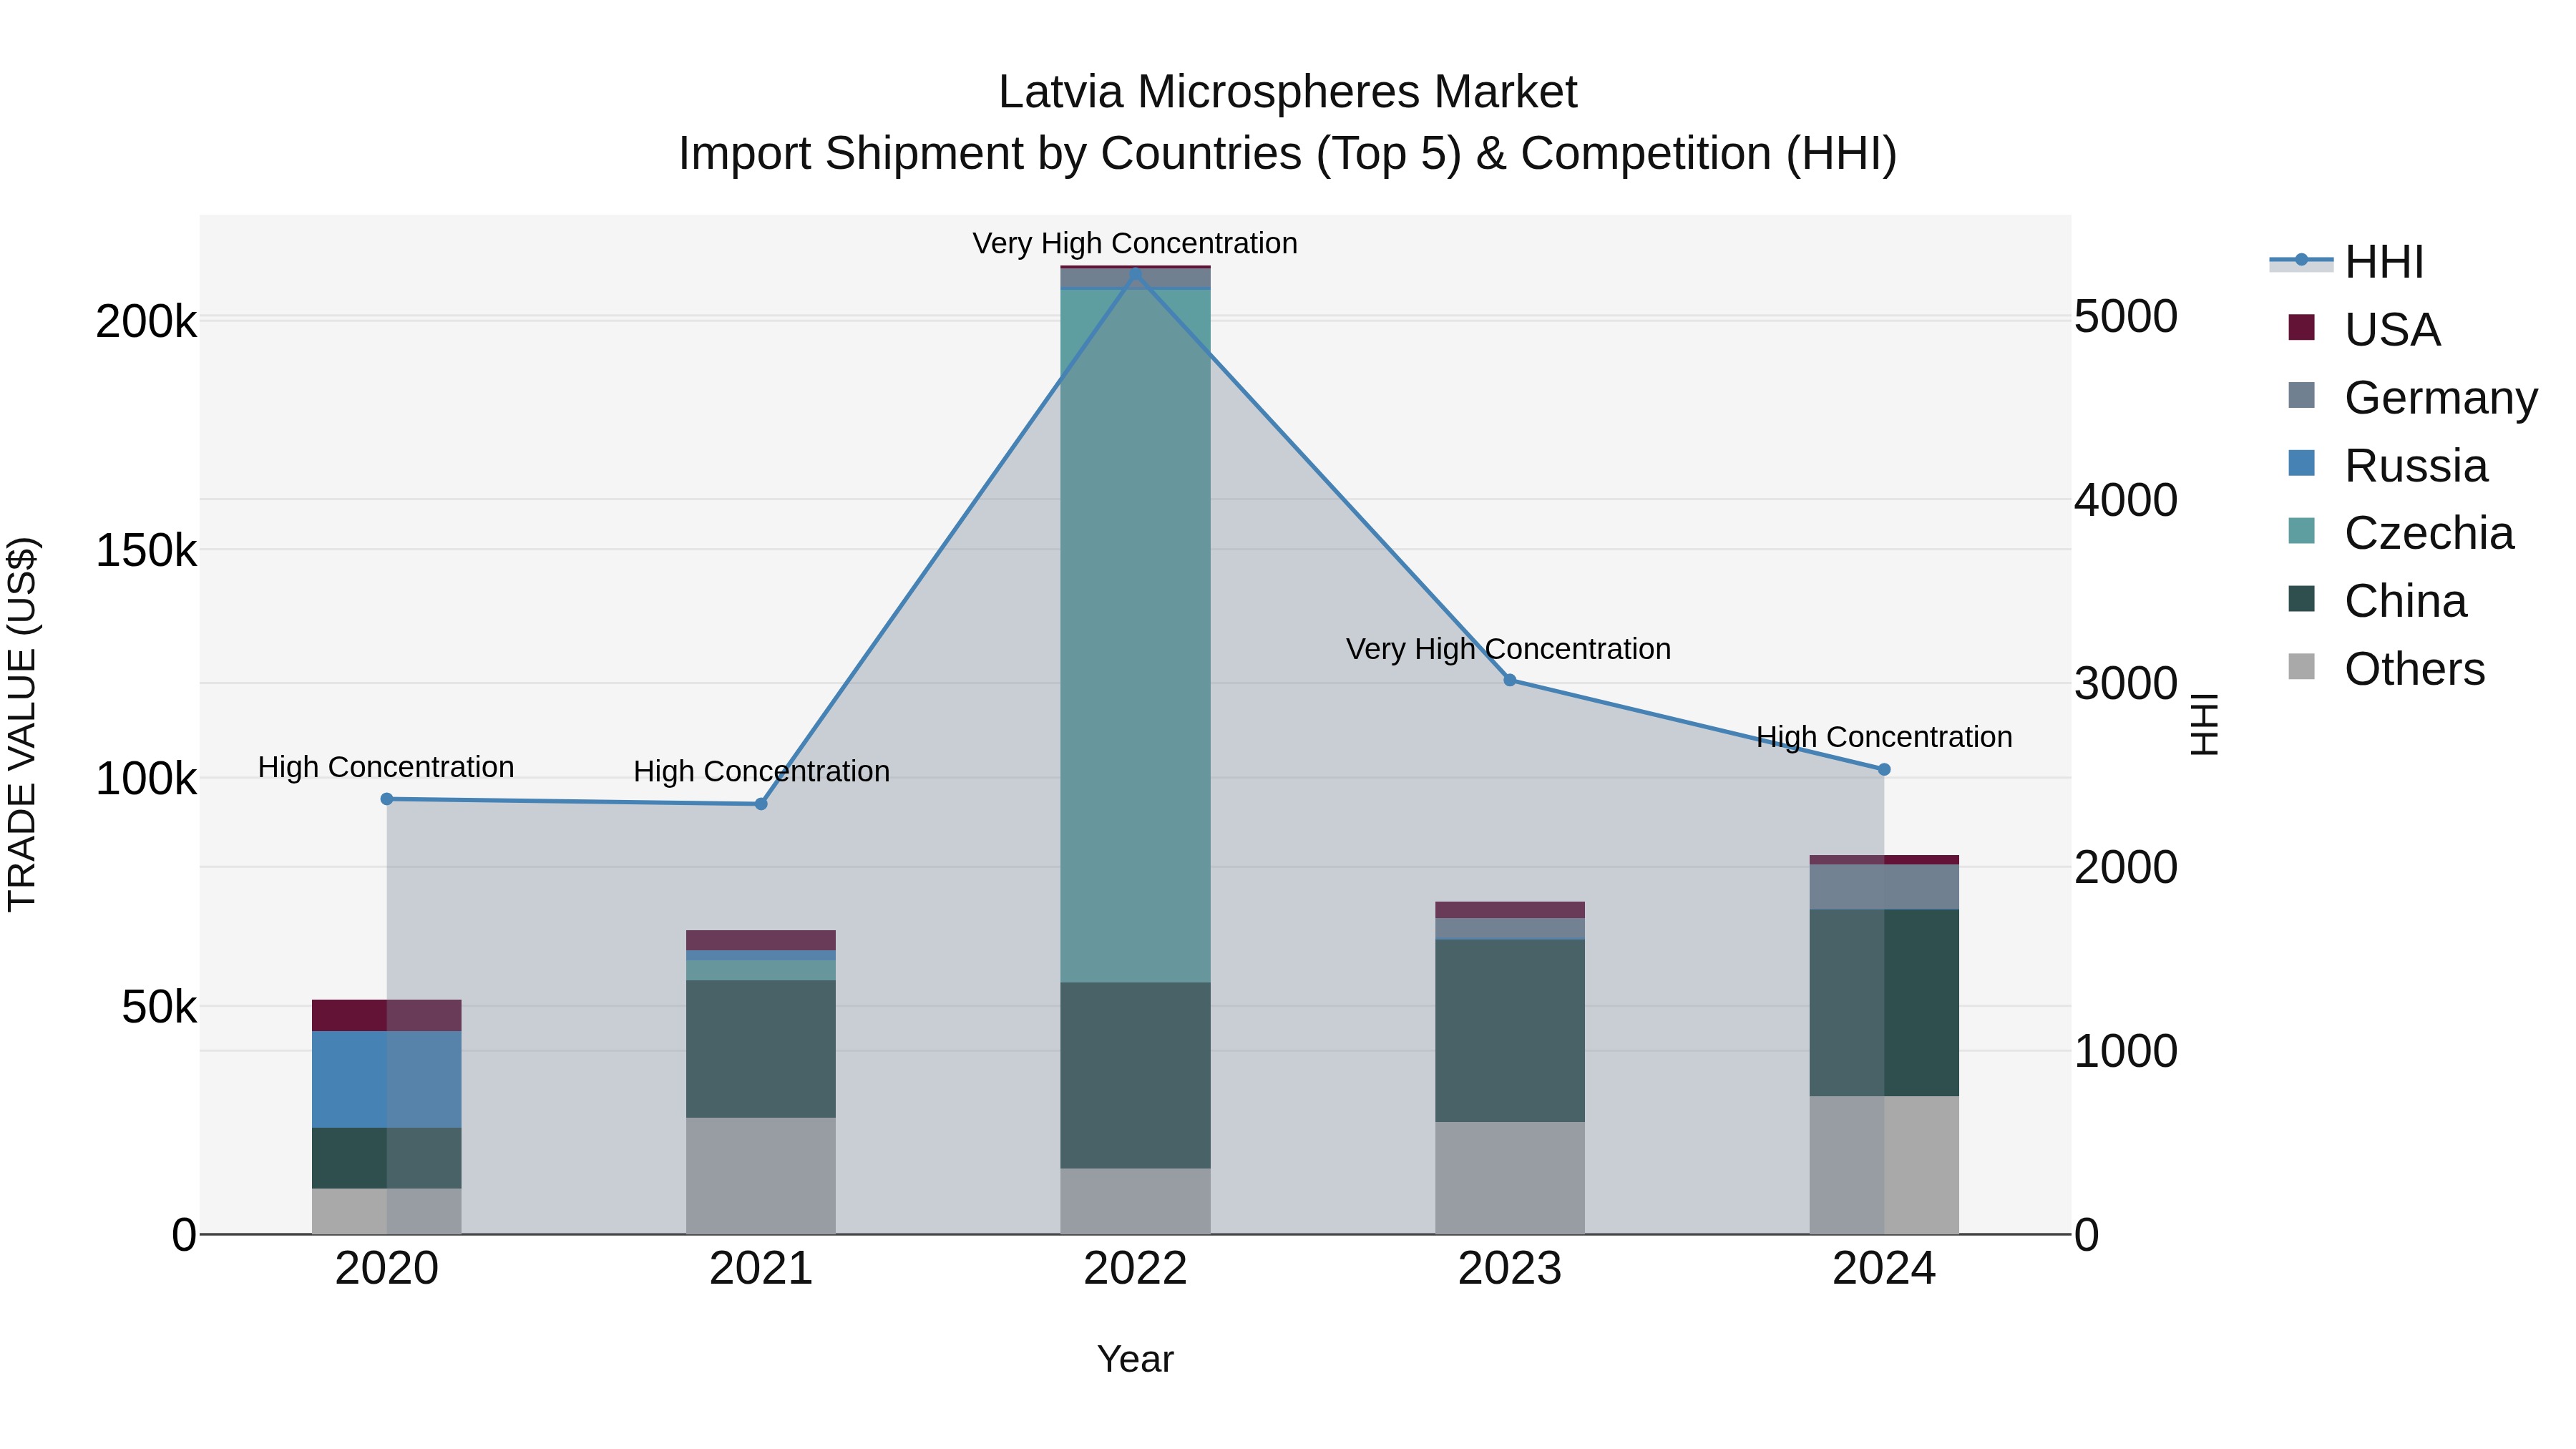
Latvia Microspheres Market Top 5 Importing Countries and Market Competition (HHI) Analysis
Latvia`s microspheres import market continued to show strong growth in 2024, with top exporting countries being China, Germany, Hong Kong, India, and the UK. The market concentration, as measured by the HHI, remained high in 2024 after a very high concentration in the previous year. The impressive CAGR of 12.76% from 2020 to 2024 and a remarkable growth rate of 14.04% from 2023 to 2024 indicate a thriving market with sustained momentum. This data suggests a positive outlook for the microspheres import market in Latvia.
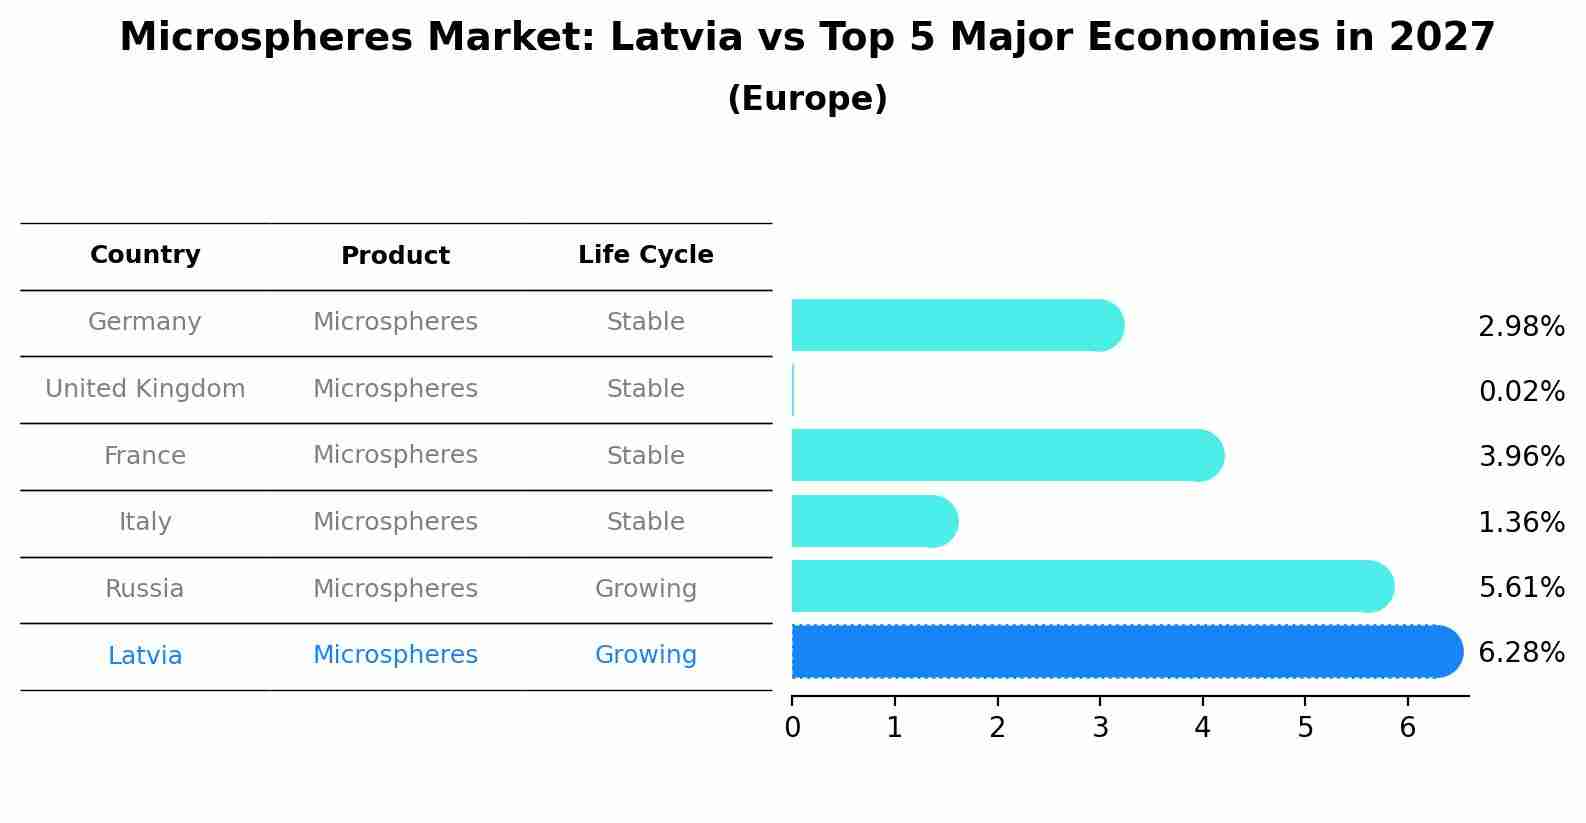
Microspheres Market: Latvia vs Top 5 Major Economies in 2027 (Europe)
The Microspheres market in Latvia is projected to grow at a growing growth rate of 6.28% by 2027, within the Europe region led by Germany, along with other countries like United Kingdom, France, Italy and Russia, collectively shaping a dynamic and evolving market environment driven by innovation and increasing adoption of emerging technologies.
Key Highlights of the Report:
- Latvia Microspheres Market Outlook
- Market Size of Latvia Microspheres Market, 2025
- Forecast of Latvia Microspheres Market, 2032
- Historical Data and Forecast of Latvia Microspheres Revenues & Volume for the Period 2022 - 2032F
- Latvia Microspheres Market Trend Evolution
- Latvia Microspheres Market Drivers and Challenges
- Latvia Microspheres Price Trends
- Latvia Microspheres Porter`s Five Forces
- Latvia Microspheres Industry Life Cycle
- Historical Data and Forecast of Latvia Microspheres Market Revenues & Volume By Type for the Period 2022 - 2032F
- Historical Data and Forecast of Latvia Microspheres Market Revenues & Volume By Hollow for the Period 2022 - 2032F
- Historical Data and Forecast of Latvia Microspheres Market Revenues & Volume By Solid for the Period 2022 - 2032F
- Historical Data and Forecast of Latvia Microspheres Market Revenues & Volume By Raw Material for the Period 2022 - 2032F
- Historical Data and Forecast of Latvia Microspheres Market Revenues & Volume By Glass for the Period 2022 - 2032F
- Historical Data and Forecast of Latvia Microspheres Market Revenues & Volume By Ceramic for the Period 2022 - 2032F
- Historical Data and Forecast of Latvia Microspheres Market Revenues & Volume By Fly Ash for the Period 2022 - 2032F
- Historical Data and Forecast of Latvia Microspheres Market Revenues & Volume By Polymer for the Period 2022 - 2032F
- Historical Data and Forecast of Latvia Microspheres Market Revenues & Volume By Metallic for the Period 2022 - 2032F
- Historical Data and Forecast of Latvia Microspheres Market Revenues & Volume By Application for the Period 2022 - 2032F
- Historical Data and Forecast of Latvia Microspheres Market Revenues & Volume By Construction Composites for the Period 2022 - 2032F
- Historical Data and Forecast of Latvia Microspheres Market Revenues & Volume By Medical Technology for the Period 2022 - 2032F
- Historical Data and Forecast of Latvia Microspheres Market Revenues & Volume By Cosmetics & Personal Care for the Period 2022 - 2032F
- Historical Data and Forecast of Latvia Microspheres Market Revenues & Volume By Automotive for the Period 2022 - 2032F
- Historical Data and Forecast of Latvia Microspheres Market Revenues & Volume By Oil & Gas for the Period 2022 - 2032F
- Latvia Microspheres Import Export Trade Statistics
- Market Opportunity Assessment By Type
- Market Opportunity Assessment By Raw Material
- Market Opportunity Assessment By Application
- Latvia Microspheres Top Companies Market Share
- Latvia Microspheres Competitive Benchmarking By Technical and Operational Parameters
- Latvia Microspheres Company Profiles
- Latvia Microspheres Key Strategic Recommendations
Frequently Asked Questions About the Market Study (FAQs):
6Wresearch actively monitors the Latvia Microspheres Market and publishes its comprehensive annual report, highlighting emerging trends, growth drivers, revenue analysis, and forecast outlook. Our insights help businesses to make data-backed strategic decisions with ongoing market dynamics. Our analysts track relevent industries related to the Latvia Microspheres Market, allowing our clients with actionable intelligence and reliable forecasts tailored to emerging regional needs.
Yes, we provide customisation as per your requirements. To learn more, feel free to contact us on sales@6wresearch.com
1 Executive Summary |
2 Introduction |
2.1 Key Highlights of the Report |
2.2 Report Description |
2.3 Market Scope & Segmentation |
2.4 Research Methodology |
2.5 Assumptions |
3 Latvia Microspheres Market Overview |
3.1 Latvia Country Macro Economic Indicators |
3.2 Latvia Microspheres Market Revenues & Volume, 2022 & 2032F |
3.3 Latvia Microspheres Market - Industry Life Cycle |
3.4 Latvia Microspheres Market - Porter's Five Forces |
3.5 Latvia Microspheres Market Revenues & Volume Share, By Type, 2022 & 2032F |
3.6 Latvia Microspheres Market Revenues & Volume Share, By Raw Material, 2022 & 2032F |
3.7 Latvia Microspheres Market Revenues & Volume Share, By Application, 2022 & 2032F |
4 Latvia Microspheres Market Dynamics |
4.1 Impact Analysis |
4.2 Market Drivers |
4.2.1 Increasing demand for lightweight materials in various industries such as construction, automotive, and healthcare, boosting the use of microspheres. |
4.2.2 Growing focus on sustainability and eco-friendly products, driving the adoption of bio-based microspheres. |
4.2.3 Technological advancements leading to the development of innovative applications for microspheres in different sectors. |
4.3 Market Restraints |
4.3.1 High production costs associated with manufacturing microspheres, limiting their widespread adoption. |
4.3.2 Stringent regulations and standards related to the use of microspheres in certain industries, hindering market growth. |
4.3.3 Lack of awareness about the benefits and applications of microspheres among end-users, resulting in slower market penetration. |
5 Latvia Microspheres Market Trends |
6 Latvia Microspheres Market Segmentations |
6.1 Latvia Microspheres Market, By Type |
6.1.1 Overview and Analysis |
6.1.2 Latvia Microspheres Market Revenues & Volume, By Hollow, 2022 - 2032F |
6.1.3 Latvia Microspheres Market Revenues & Volume, By Solid, 2022 - 2032F |
6.2 Latvia Microspheres Market, By Raw Material |
6.2.1 Overview and Analysis |
6.2.2 Latvia Microspheres Market Revenues & Volume, By Glass, 2022 - 2032F |
6.2.3 Latvia Microspheres Market Revenues & Volume, By Ceramic, 2022 - 2032F |
6.2.4 Latvia Microspheres Market Revenues & Volume, By Fly Ash, 2022 - 2032F |
6.2.5 Latvia Microspheres Market Revenues & Volume, By Polymer, 2022 - 2032F |
6.2.6 Latvia Microspheres Market Revenues & Volume, By Metallic, 2022 - 2032F |
6.3 Latvia Microspheres Market, By Application |
6.3.1 Overview and Analysis |
6.3.2 Latvia Microspheres Market Revenues & Volume, By Construction Composites, 2022 - 2032F |
6.3.3 Latvia Microspheres Market Revenues & Volume, By Medical Technology, 2022 - 2032F |
6.3.4 Latvia Microspheres Market Revenues & Volume, By Cosmetics & Personal Care, 2022 - 2032F |
6.3.5 Latvia Microspheres Market Revenues & Volume, By Automotive, 2022 - 2032F |
6.3.6 Latvia Microspheres Market Revenues & Volume, By Oil & Gas, 2022 - 2032F |
7 Latvia Microspheres Market Import-Export Trade Statistics |
7.1 Latvia Microspheres Market Export to Major Countries |
7.2 Latvia Microspheres Market Imports from Major Countries |
8 Latvia Microspheres Market Key Performance Indicators |
8.1 Research and development investment in new microsphere technologies. |
8.2 Number of patents filed for microsphere innovations. |
8.3 Adoption rate of microspheres in emerging industries such as cosmetics or agriculture. |
8.4 Environmental impact assessments of microsphere production processes. |
8.5 Number of collaborations between manufacturers and end-users for customized microsphere solutions. |
9 Latvia Microspheres Market - Opportunity Assessment |
9.1 Latvia Microspheres Market Opportunity Assessment, By Type, 2022 & 2032F |
9.2 Latvia Microspheres Market Opportunity Assessment, By Raw Material, 2022 & 2032F |
9.3 Latvia Microspheres Market Opportunity Assessment, By Application, 2022 & 2032F |
10 Latvia Microspheres Market - Competitive Landscape |
10.1 Latvia Microspheres Market Revenue Share, By Companies, 2025 |
10.2 Latvia Microspheres Market Competitive Benchmarking, By Operating and Technical Parameters |
11 Company Profiles |
12 Recommendations | 13 Disclaimer |
Export potential assessment - trade Analytics for 2030
Export potential enables firms to identify high-growth global markets with greater confidence by combining advanced trade intelligence with a structured quantitative methodology. The framework analyzes emerging demand trends and country-level import patterns while integrating macroeconomic and trade datasets such as GDP and population forecasts, bilateral import–export flows, tariff structures, elasticity differentials between developed and developing economies, geographic distance, and import demand projections. Using weighted trade values from 2020–2024 as the base period to project country-to-country export potential for 2030, these inputs are operationalized through calculated drivers such as gravity model parameters, tariff impact factors, and projected GDP per-capita growth. Through an analysis of hidden potentials, demand hotspots, and market conditions that are most favorable to success, this method enables firms to focus on target countries, maximize returns, and global expansion with data, backed by accuracy.
By factoring in the projected importer demand gap that is currently unmet and could be potential opportunity, it identifies the potential for the Exporter (Country) among 190 countries, against the general trade analysis, which identifies the biggest importer or exporter.
To discover high-growth global markets and optimize your business strategy:
Click Here
Pricing
- Single User License$ 1,995
- Department License$ 2,400
- Site License$ 3,120
- Global License$ 3,795

Search
Thought Leadership and Analyst Meet


Our Clients
Latest Reports
- Philippines Polyhydroxybutyrate-co-Hydroxyvalerate Market (2026-2032) | Trends, Insights, Challenges, Restraints, Competition, Size, Value, Forecast, Pricing, Share, Outlook, Revenue, Investment Opportunities, Strategy, Drivers, Demand, Growth, segmentation, Analysis, Companies
- Peru Polyhydroxybutyrate-co-Hydroxyvalerate Market (2026-2032) | Growth, Demand, Challenges, Share, Trends, Analysis, Pricing, Investment Opportunities, Drivers, Value, Forecast, Competition, Size, Companies, Insights, Outlook, Restraints, segmentation, Revenue, Strategy
- Pakistan Polyhydroxybutyrate-co-Hydroxyvalerate Market (2026-2032) | Restraints, segmentation, Pricing, Forecast, Share, Strategy, Competition, Trends, Insights, Drivers, Challenges, Growth, Revenue, Outlook, Value, Investment Opportunities, Companies, Size, Analysis, Demand
- Oman Polyhydroxybutyrate-co-Hydroxyvalerate Market (2026-2032) | Drivers, segmentation, Insights, Competition, Pricing, Outlook, Size, Revenue, Challenges, Forecast, Analysis, Growth, Value, Share, Trends, Investment Opportunities, Strategy, Restraints, Companies, Demand
- Nigeria Polyhydroxybutyrate-co-Hydroxyvalerate Market (2026-2032) | Value, Investment Opportunities, Analysis, Revenue, Restraints, Pricing, Outlook, Competition, Demand, Growth, Forecast, Companies, Trends, Challenges, segmentation, Drivers, Insights, Share, Size, Strategy
- Nepal Polyhydroxybutyrate-co-Hydroxyvalerate Market (2026-2032) | Insights, Analysis, Drivers, Share, Revenue, Demand, segmentation, Investment Opportunities, Competition, Forecast, Growth, Pricing, Companies, Strategy, Trends, Restraints, Challenges, Outlook, Size, Value
- Myanmar Polyhydroxybutyrate-co-Hydroxyvalerate Market (2026-2032) | Outlook, Revenue, Strategy, Restraints, Drivers, segmentation, Share, Forecast, Competition, Insights, Growth, Pricing, Size, Demand, Value, Companies, Trends, Challenges, Investment Opportunities, Analysis
- Morocco Polyhydroxybutyrate-co-Hydroxyvalerate Market (2026-2032) | Outlook, Investment Opportunities, Restraints, Strategy, Forecast, Challenges, Drivers, Growth, Companies, segmentation, Trends, Size, Competition, Revenue, Demand, Insights, Share, Analysis, Value, Pricing
- Mexico Polyhydroxybutyrate-co-Hydroxyvalerate Market (2026-2032) | Size, Drivers, Outlook, Share, Strategy, Growth, Pricing, Challenges, Companies, Demand, Value, Investment Opportunities, Restraints, Trends, Forecast, segmentation, Analysis, Insights, Competition, Revenue
- Malaysia Polyhydroxybutyrate-co-Hydroxyvalerate Market (2026-2032) | Share, segmentation, Size, Companies, Analysis, Insights, Forecast, Value, Revenue, Drivers, Restraints, Challenges, Investment Opportunities, Trends, Competition, Strategy, Demand, Growth, Outlook, Pricing
Industry Events and Analyst Meet

HIMTEX 2026

India Refining Summit 2026

India EV Show 2026

EV tech India Expo 2026

Auto Tech Asia 2026
Whitepaper
- Middle East & Africa Commercial Security Market Click here to view more.
- Middle East & Africa Fire Safety Systems & Equipment Market Click here to view more.
- GCC Drone Market Click here to view more.
- Middle East Lighting Fixture Market Click here to view more.
- GCC Physical & Perimeter Security Market Click here to view more.
6WResearch In News
- Doha a strategic location for EV manufacturing hub: IPA Qatar
- Demand for luxury TVs surging in the GCC, says Samsung
- Empowering Growth: The Thriving Journey of Bangladesh’s Cable Industry
- Demand for luxury TVs surging in the GCC, says Samsung
- Video call with a traditional healer? Once unthinkable, it’s now common in South Africa
- Intelligent Buildings To Smooth GCC’s Path To Net Zero