Latvia Potassium Fluorosilicate Market (2026-2032) | Segmentation, Forecast, Trends, Industry, Size, Value, Companies, Share, Outlook, Growth, Revenue & Analysis
Market Forecast By Type (0.98, Other), By Application (Metal industry (fluxing agents)., Glass industry (opacifying agent)., Construction industry (additive for concrete)) And Competitive Landscape
| Product Code: ETC4893789 | Publication Date: Nov 2023 | Updated Date: Apr 2026 | Product Type: Market Research Report | |
| Publisher: 6Wresearch | Author: Shubham Padhi | No. of Pages: 60 | No. of Figures: 30 | No. of Tables: 5 |
Latvia Potassium Fluorosilicate Market Size (2020-2030)
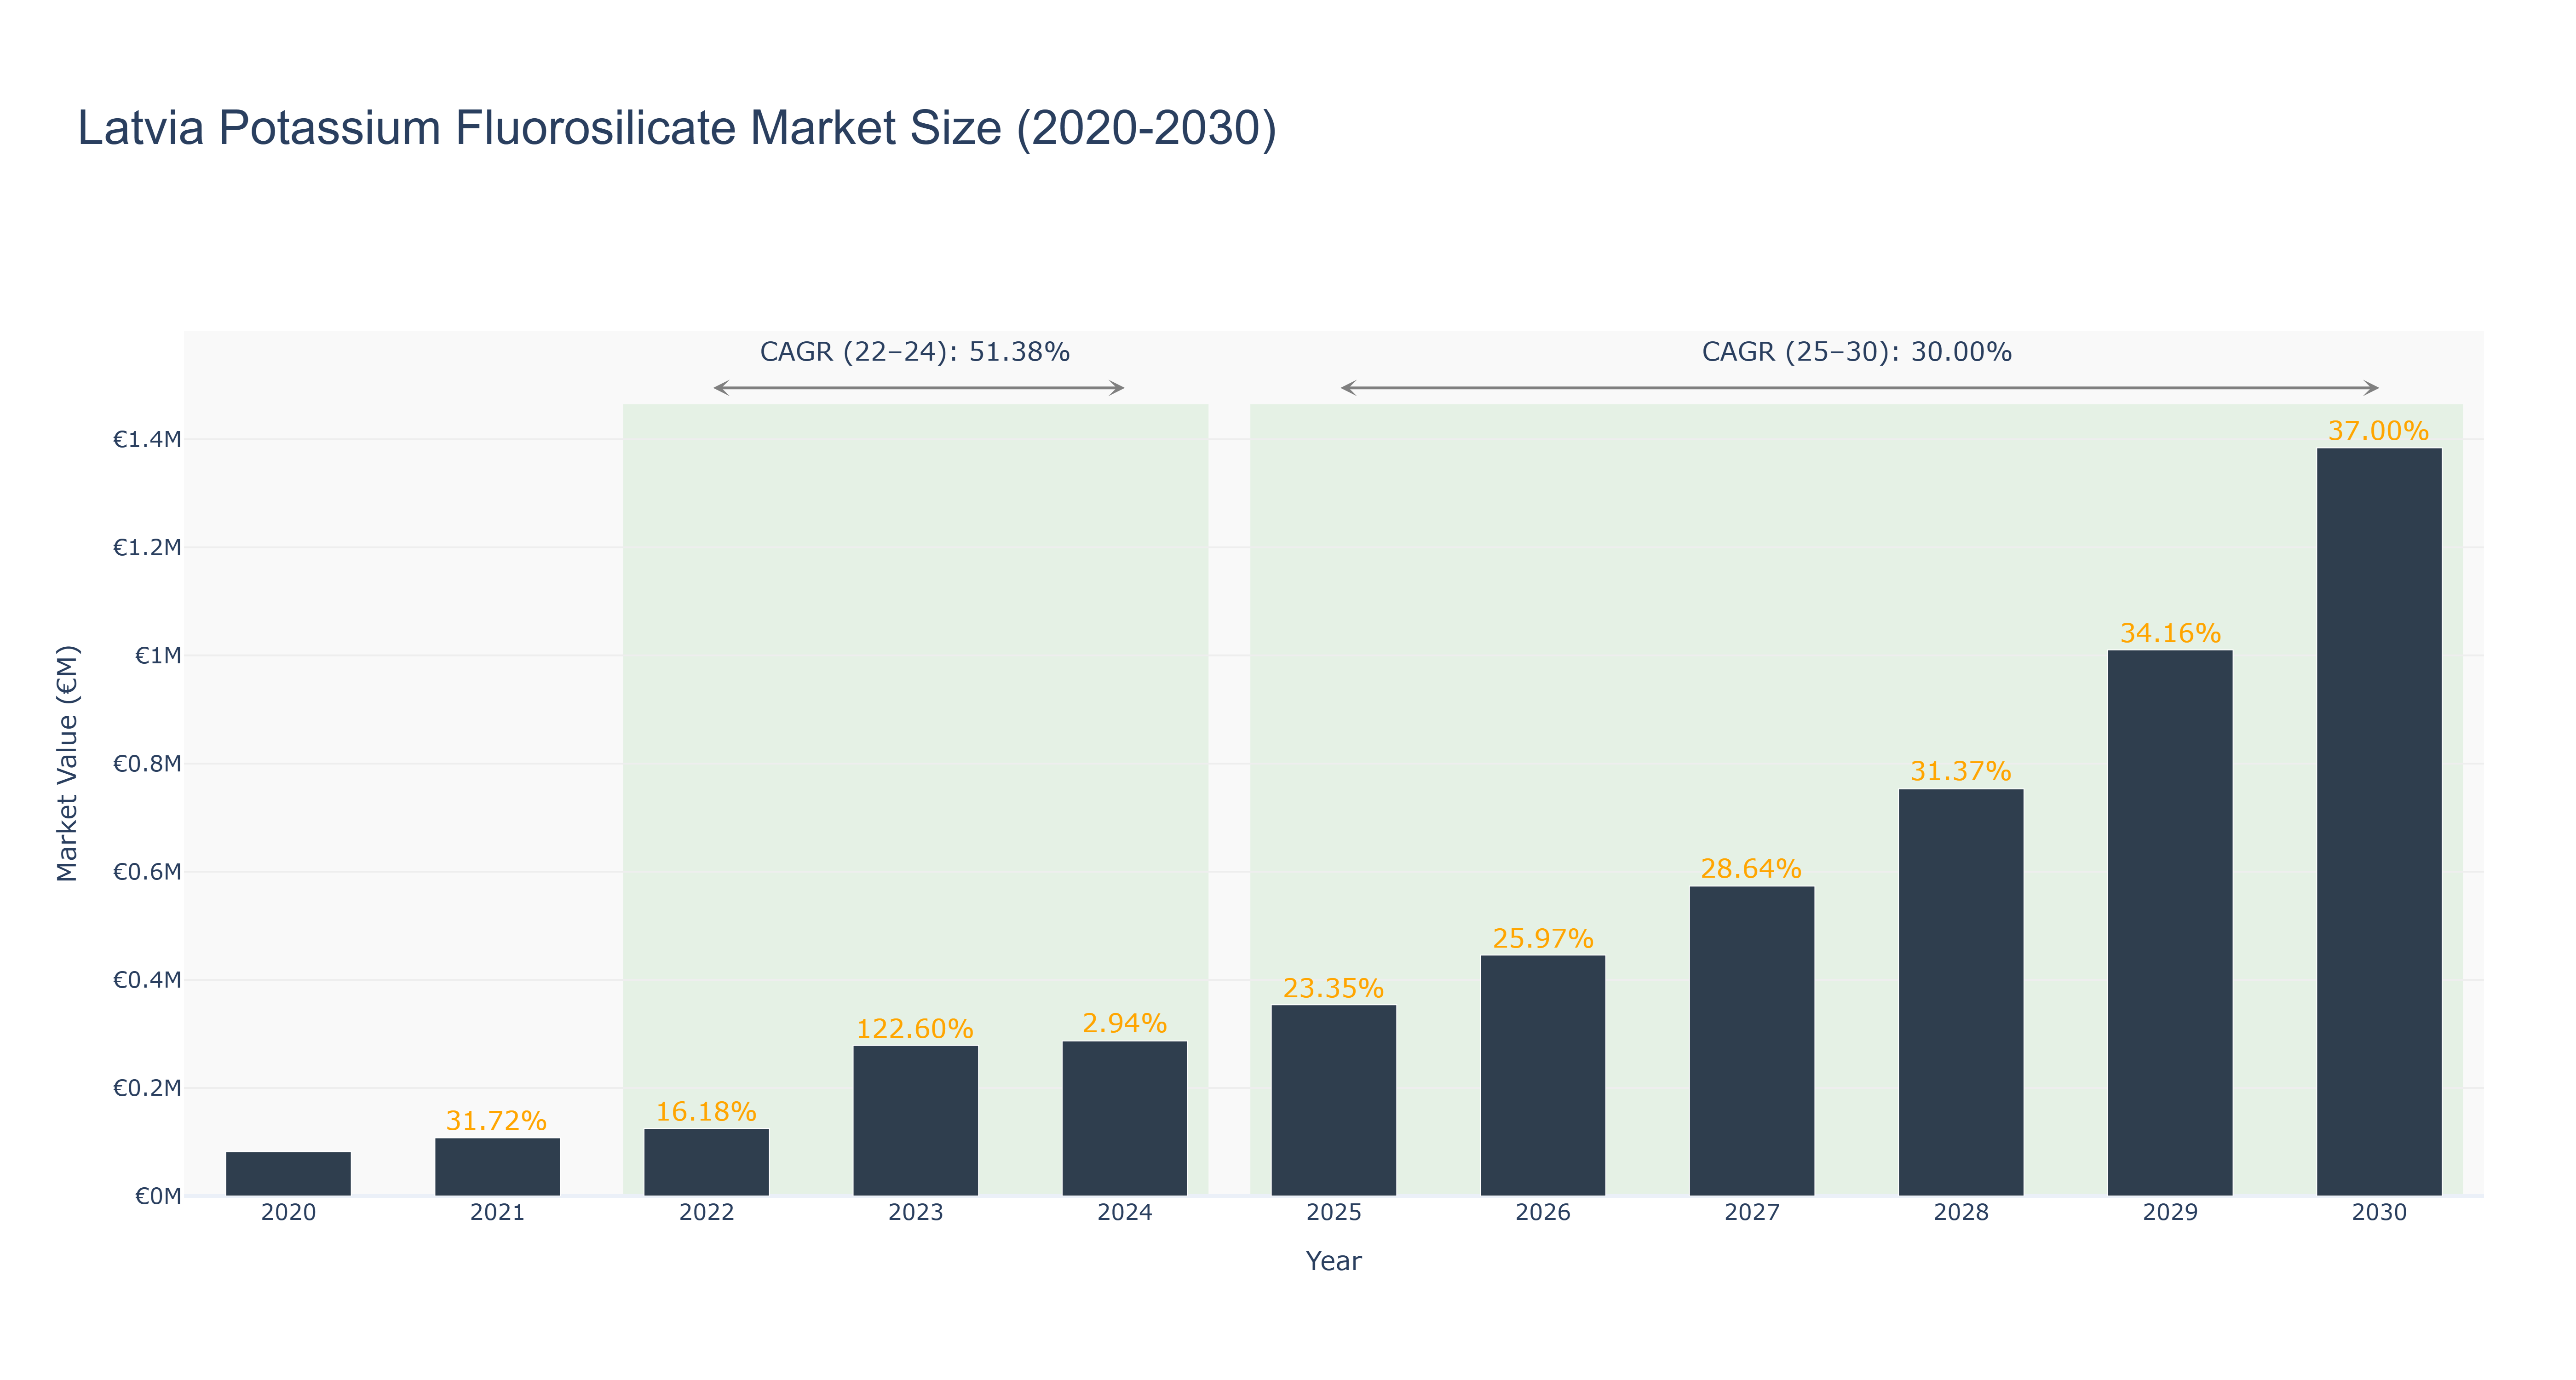
The Latvia Potassium Fluorosilicate Market has demonstrated significant growth, with the peak market size reaching €278.56 thousand in 2023, reflecting a remarkable growth rate of 122.60% from the previous year. From 2022 to 2024, the actual market experienced a compound annual growth rate (CAGR) of 51.38%, driven by increasing industrial applications and rising demand for high-performance materials. Looking ahead, the forecasted period from 2025 to 2030 anticipates continued expansion, with projected market sizes reaching €1.38 million by 2030, translating to a CAGR of 30.00%. This growth is likely fueled by advancements in manufacturing technologies and a growing emphasis on sustainable production processes, alongside potential regulatory support for environmentally friendly chemicals. As the market matures, stakeholders should remain vigilant to evolving industry trends and policies that may impact future demand dynamics.
Latvia Potassium Fluorosilicate Market: Production & Trade Performance (2019-2025)
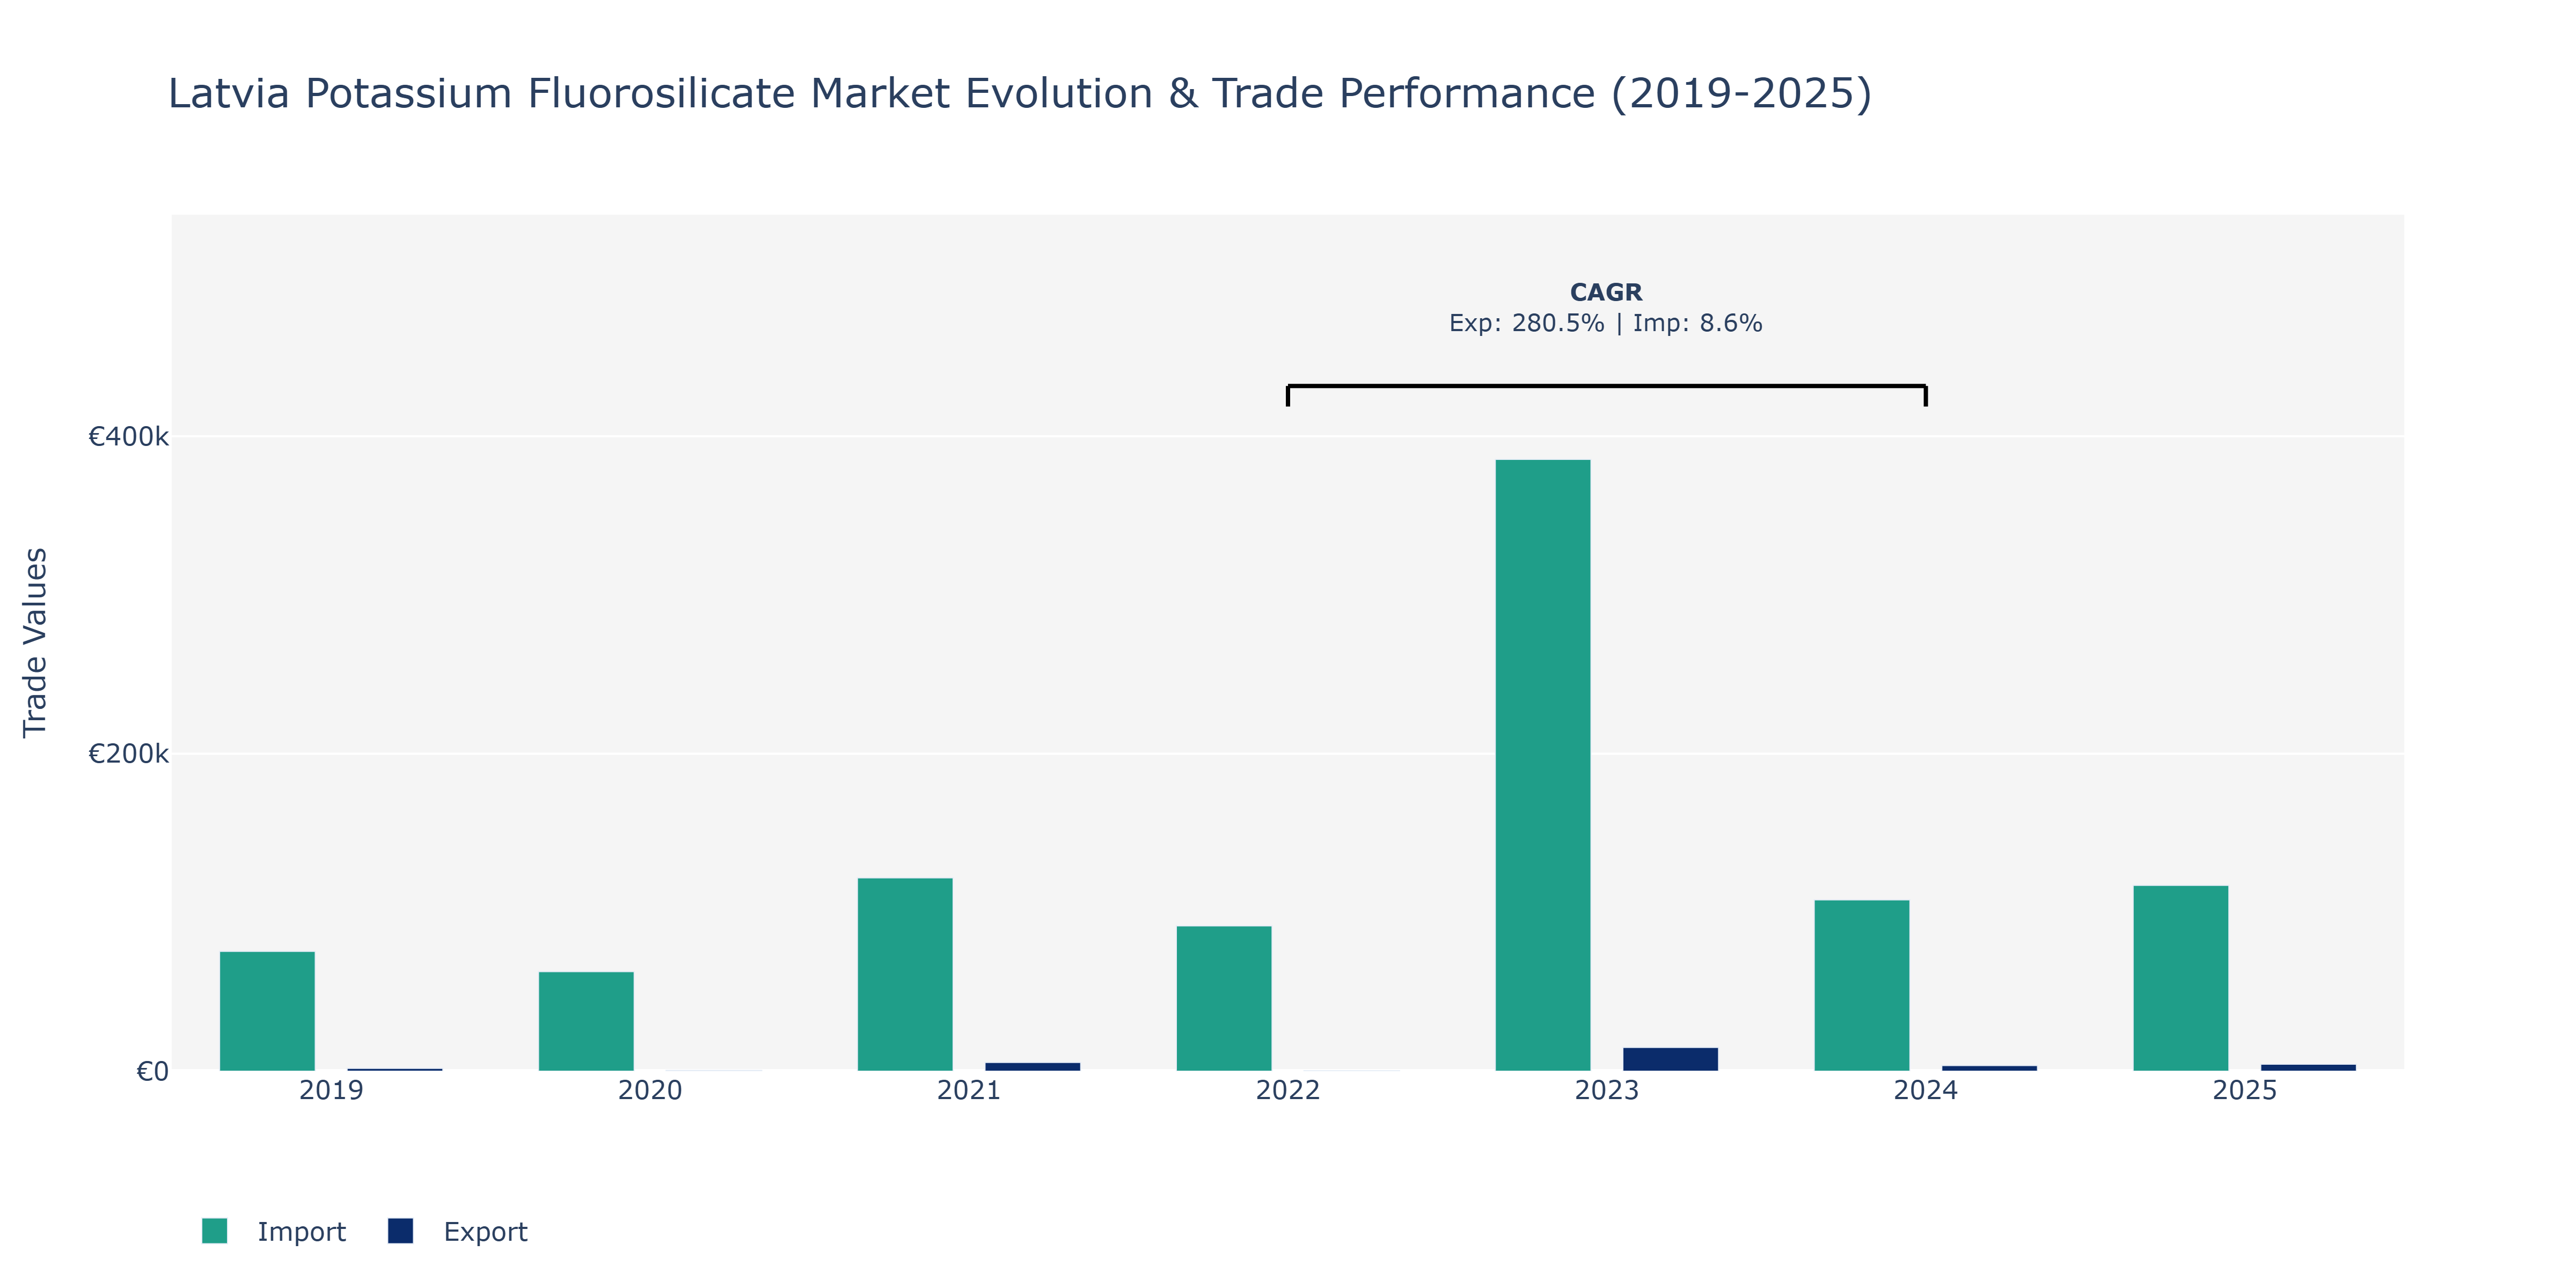
In the Latvia Potassium Fluorosilicate Market, exports demonstrated fluctuations over the years, starting at €1.79 thousand in 2019, declining sharply to €474 in 2020, before experiencing a notable surge to €14.98 thousand in 2023. This substantial increase could be attributed to increased global demand for potassium fluorosilicate products, potentially driven by advancements in industries such as ceramics, glass manufacturing, and chemical production. On the other hand, imports followed a similar trend, starting at €75.47 thousand in 2019, decreasing to €62.7 thousand in 2020, and then rising to €385.39 thousand in 2023. The peak in imports might signify heavy investments in infrastructure and manufacturing sectors within Latvia, requiring significant imports of potassium fluorosilicate. The market's volatility could be influenced by changes in international trade policies, shifts in consumer preferences, and evolving technological applications of potassium fluorosilicate in various industries.
Key Highlights of the Report:
- Latvia Potassium Fluorosilicate Market Outlook
- Market Size of Latvia Potassium Fluorosilicate Market, 2025
- Forecast of Latvia Potassium Fluorosilicate Market, 2032
- Historical Data and Forecast of Latvia Potassium Fluorosilicate Revenues & Volume for the Period 2022 - 2032F
- Latvia Potassium Fluorosilicate Market Trend Evolution
- Latvia Potassium Fluorosilicate Market Drivers and Challenges
- Latvia Potassium Fluorosilicate Price Trends
- Latvia Potassium Fluorosilicate Porter`s Five Forces
- Latvia Potassium Fluorosilicate Industry Life Cycle
- Historical Data and Forecast of Latvia Potassium Fluorosilicate Market Revenues & Volume By Type for the Period 2022 - 2032F
- Historical Data and Forecast of Latvia Potassium Fluorosilicate Market Revenues & Volume By 0.98 for the Period 2022 - 2032F
- Historical Data and Forecast of Latvia Potassium Fluorosilicate Market Revenues & Volume By Other for the Period 2022 - 2032F
- Historical Data and Forecast of Latvia Potassium Fluorosilicate Market Revenues & Volume By Application for the Period 2022 - 2032F
- Historical Data and Forecast of Latvia Potassium Fluorosilicate Market Revenues & Volume By Metal industry (fluxing agents). for the Period 2022 - 2032F
- Historical Data and Forecast of Latvia Potassium Fluorosilicate Market Revenues & Volume By Glass industry (opacifying agent). for the Period 2022 - 2032F
- Historical Data and Forecast of Latvia Potassium Fluorosilicate Market Revenues & Volume By Construction industry (additive for concrete) for the Period 2022 - 2032F
- Latvia Potassium Fluorosilicate Import Export Trade Statistics
- Market Opportunity Assessment By Type
- Market Opportunity Assessment By Application
- Latvia Potassium Fluorosilicate Top Companies Market Share
- Latvia Potassium Fluorosilicate Competitive Benchmarking By Technical and Operational Parameters
- Latvia Potassium Fluorosilicate Company Profiles
- Latvia Potassium Fluorosilicate Key Strategic Recommendations
Frequently Asked Questions About the Market Study (FAQs):
6Wresearch actively monitors the Latvia Potassium Fluorosilicate Market and publishes its comprehensive annual report, highlighting emerging trends, growth drivers, revenue analysis, and forecast outlook. Our insights help businesses to make data-backed strategic decisions with ongoing market dynamics. Our analysts track relevent industries related to the Latvia Potassium Fluorosilicate Market, allowing our clients with actionable intelligence and reliable forecasts tailored to emerging regional needs.
Yes, we provide customisation as per your requirements. To learn more, feel free to contact us on sales@6wresearch.com
1 Executive Summary |
2 Introduction |
2.1 Key Highlights of the Report |
2.2 Report Description |
2.3 Market Scope & Segmentation |
2.4 Research Methodology |
2.5 Assumptions |
3 Latvia Potassium Fluorosilicate Market Overview |
3.1 Latvia Country Macro Economic Indicators |
3.2 Latvia Potassium Fluorosilicate Market Revenues & Volume, 2022 & 2032F |
3.3 Latvia Potassium Fluorosilicate Market - Industry Life Cycle |
3.4 Latvia Potassium Fluorosilicate Market - Porter's Five Forces |
3.5 Latvia Potassium Fluorosilicate Market Revenues & Volume Share, By Type, 2022 & 2032F |
3.6 Latvia Potassium Fluorosilicate Market Revenues & Volume Share, By Application, 2022 & 2032F |
4 Latvia Potassium Fluorosilicate Market Dynamics |
4.1 Impact Analysis |
4.2 Market Drivers |
4.2.1 Increasing demand for potassium fluorosilicate in the glass and ceramics industry due to its properties like high melting point and resistance to thermal shock. |
4.2.2 Growth in the construction industry in Latvia leading to higher demand for potassium fluorosilicate in the production of specialty glass and ceramics. |
4.2.3 Rising focus on renewable energy sources driving the demand for solar panels, where potassium fluorosilicate is used in the manufacturing process. |
4.3 Market Restraints |
4.3.1 Fluctuations in raw material prices impacting the production cost of potassium fluorosilicate. |
4.3.2 Stringent regulations on environmental protection and waste disposal affecting the manufacturing processes of potassium fluorosilicate in Latvia. |
5 Latvia Potassium Fluorosilicate Market Trends |
6 Latvia Potassium Fluorosilicate Market Segmentations |
6.1 Latvia Potassium Fluorosilicate Market, By Type |
6.1.1 Overview and Analysis |
6.1.2 Latvia Potassium Fluorosilicate Market Revenues & Volume, By 0.98, 2022 - 2032F |
6.1.3 Latvia Potassium Fluorosilicate Market Revenues & Volume, By Other, 2022 - 2032F |
6.2 Latvia Potassium Fluorosilicate Market, By Application |
6.2.1 Overview and Analysis |
6.2.2 Latvia Potassium Fluorosilicate Market Revenues & Volume, By Metal industry (fluxing agents)., 2022 - 2032F |
6.2.3 Latvia Potassium Fluorosilicate Market Revenues & Volume, By Glass industry (opacifying agent)., 2022 - 2032F |
6.2.4 Latvia Potassium Fluorosilicate Market Revenues & Volume, By Construction industry (additive for concrete), 2022 - 2032F |
7 Latvia Potassium Fluorosilicate Market Import-Export Trade Statistics |
7.1 Latvia Potassium Fluorosilicate Market Export to Major Countries |
7.2 Latvia Potassium Fluorosilicate Market Imports from Major Countries |
8 Latvia Potassium Fluorosilicate Market Key Performance Indicators |
8.1 Average selling price of potassium fluorosilicate in the market. |
8.2 Percentage of market penetration for potassium fluorosilicate in different industries. |
8.3 Research and development investment in new applications and technologies related to potassium fluorosilicate. |
9 Latvia Potassium Fluorosilicate Market - Opportunity Assessment |
9.1 Latvia Potassium Fluorosilicate Market Opportunity Assessment, By Type, 2022 & 2032F |
9.2 Latvia Potassium Fluorosilicate Market Opportunity Assessment, By Application, 2022 & 2032F |
10 Latvia Potassium Fluorosilicate Market - Competitive Landscape |
10.1 Latvia Potassium Fluorosilicate Market Revenue Share, By Companies, 2025 |
10.2 Latvia Potassium Fluorosilicate Market Competitive Benchmarking, By Operating and Technical Parameters |
11 Company Profiles |
12 Recommendations | 13 Disclaimer |
Global Go To Market Strategy - 2030
Export potential enables firms to identify high-growth global markets with greater confidence by combining advanced trade intelligence with a structured quantitative methodology. The framework analyzes emerging demand trends and country-level import patterns while integrating macroeconomic and trade datasets such as GDP and population forecasts, bilateral import–export flows, tariff structures, elasticity differentials between developed and developing economies, geographic distance, and import demand projections. Using weighted trade values from 2020–2024 as the base period to project country-to-country export potential for 2030, these inputs are operationalized through calculated drivers such as gravity model parameters, tariff impact factors, and projected GDP per-capita growth. Through an analysis of hidden potentials, demand hotspots, and market conditions that are most favorable to success, this method enables firms to focus on target countries, maximize returns, and global expansion with data, backed by accuracy.
By factoring in the projected importer demand gap that is currently unmet and could be potential opportunity, it identifies the potential for the Exporter (Country) among 190 countries, against the general trade analysis, which identifies the biggest importer or exporter.
To discover high-growth global markets and optimize your business strategy:
Click Here
Pricing
- Single User License$ 1,995
- Department License$ 2,400
- Site License$ 3,120
- Global License$ 3,795

Leadership Perspectives from Industry Events
Search
Thought Leadership and Analyst Meet


Our Clients
6WResearch In News
- Doha a strategic location for EV manufacturing hub: IPA Qatar
- Demand for luxury TVs surging in the GCC, says Samsung
- Empowering Growth: The Thriving Journey of Bangladesh’s Cable Industry
- Demand for luxury TVs surging in the GCC, says Samsung
- Video call with a traditional healer? Once unthinkable, it’s now common in South Africa
- Intelligent Buildings To Smooth GCC’s Path To Net Zero
Latest Reports
- New Zealand Aseptic Manufacturing Market (2026-2032)
- Netherlands Aseptic Manufacturing Market (2026-2032)
- Nauru Aseptic Manufacturing Market (2026-2032)
- Namibia Aseptic Manufacturing Market (2026-2032)
- Mozambique Aseptic Manufacturing Market (2026-2032)
- Montenegro Aseptic Manufacturing Market (2026-2032)
- Mongolia Aseptic Manufacturing Market (2026-2032)
- Monaco Aseptic Manufacturing Market (2026-2032)
- Micronesia Aseptic Manufacturing Market (2026-2032)
- Mauritius Aseptic Manufacturing Market (2026-2032)
Industry Events and Analyst Meet

HIMTEX 2026

India Refining Summit 2026

India EV Show 2026

EV tech India Expo 2026

Auto Tech Asia 2026
Whitepaper
- Middle East & Africa Commercial Security Market Click here to view more.
- Middle East & Africa Fire Safety Systems & Equipment Market Click here to view more.
- GCC Drone Market Click here to view more.
- Middle East Lighting Fixture Market Click here to view more.
- GCC Physical & Perimeter Security Market Click here to view more.