Latvia Wellness Water Market (2026-2032) | Supply, Strategic Insights, Drivers, Competitive, Analysis, Consumer Insights, Restraints, Segments, Value, Investment Trends, Revenue, Demand, Pricing Analysis, Competition, Share, Industry, Opportunities, Outlook, Challenges, Forecast, Growth, Strategy, Segmentation, Companies, Trends, Size
Market Forecast By Type (Alkaline Water, Vitamin-Infused Water, Hydrogen Water, Detox Water, Others), By Ingredients (Minerals, Vitamins and Electrolytes, Antioxidants, Herbal Extracts, Custom Blends), By Benefits (pH Balance, Hydration Boost, Anti-Aging, Toxin Removal, Immunity Support), By End Use (Retail Stores, Fitness Centers, Beauty and Wellness, Health Enthusiasts, Restaurants and Cafes), By End Use (Professional Tattooing, Tattoo Studios) And Competitive Landscape
| Product Code: ETC11267125 | Publication Date: Apr 2025 | Updated Date: Apr 2026 | Product Type: Market Research Report | |
| Publisher: 6Wresearch | Author: Bhawna Singh | No. of Pages: 65 | No. of Figures: 34 | No. of Tables: 19 |
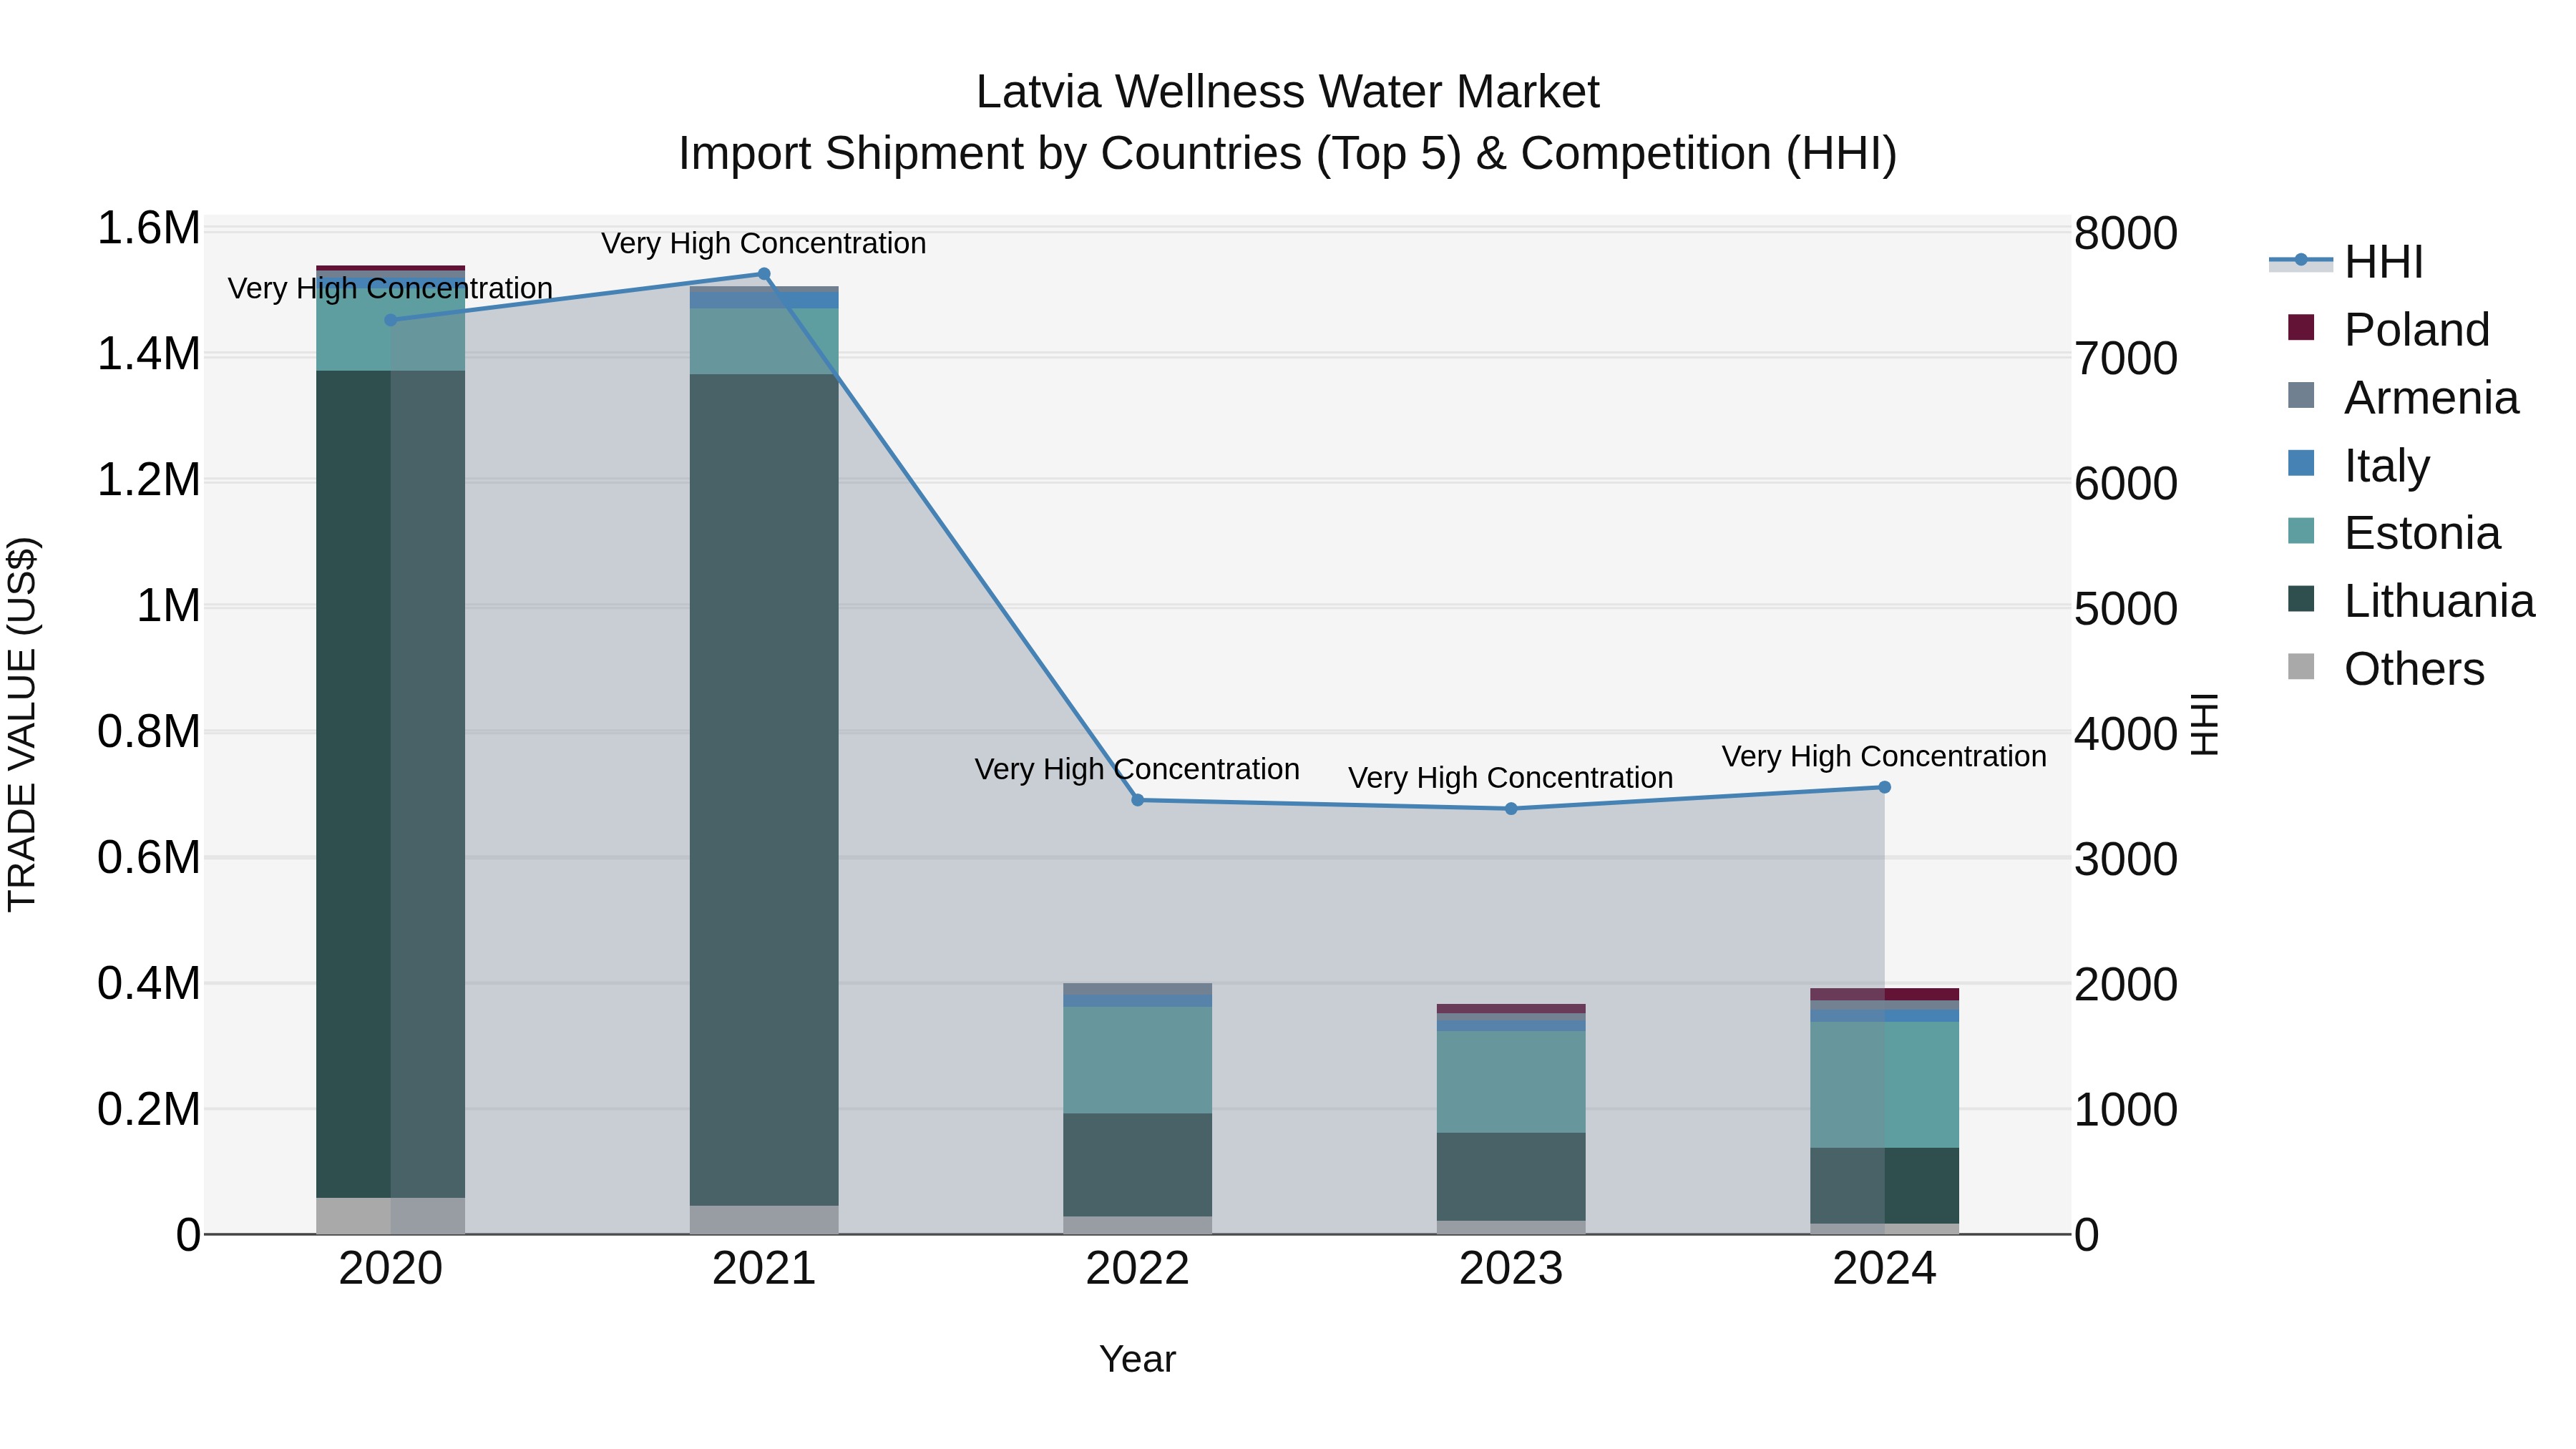
Latvia Wellness Water Market Top 5 Importing Countries and Market Competition (HHI) Analysis
The import of wellness water in Latvia continued to be dominated by neighboring countries such as Estonia, Lithuania, and Poland in 2024, with Italy and Armenia also making significant contributions. Despite a declining CAGR of -28.99% from 2020 to 2024, there was a positive growth rate of 6.96% from 2023 to 2024. The high concentration of the Herfindahl-Hirschman Index (HHI) suggests a competitive market landscape for wellness water imports in Latvia, highlighting the importance of strategic market positioning for exporters.
Key Highlights of the Report:
- Latvia Wellness Water Market Outlook
- Market Size of Latvia Wellness Water Market, 2025
- Forecast of Latvia Wellness Water Market, 2032
- Historical Data and Forecast of Latvia Wellness Water Revenues & Volume for the Period 2022 - 2032F
- Latvia Wellness Water Market Trend Evolution
- Latvia Wellness Water Market Drivers and Challenges
- Latvia Wellness Water Price Trends
- Latvia Wellness Water Porter's Five Forces
- Latvia Wellness Water Industry Life Cycle
- Historical Data and Forecast of Latvia Wellness Water Market Revenues & Volume By Type for the Period 2022 - 2032F
- Historical Data and Forecast of Latvia Wellness Water Market Revenues & Volume By Alkaline Water for the Period 2022 - 2032F
- Historical Data and Forecast of Latvia Wellness Water Market Revenues & Volume By Vitamin-Infused Water for the Period 2022 - 2032F
- Historical Data and Forecast of Latvia Wellness Water Market Revenues & Volume By Hydrogen Water for the Period 2022 - 2032F
- Historical Data and Forecast of Latvia Wellness Water Market Revenues & Volume By Detox Water for the Period 2022 - 2032F
- Historical Data and Forecast of Latvia Wellness Water Market Revenues & Volume By Others for the Period 2022 - 2032F
- Historical Data and Forecast of Latvia Wellness Water Market Revenues & Volume By Ingredients for the Period 2022 - 2032F
- Historical Data and Forecast of Latvia Wellness Water Market Revenues & Volume By Minerals for the Period 2022 - 2032F
- Historical Data and Forecast of Latvia Wellness Water Market Revenues & Volume By Vitamins and Electrolytes for the Period 2022 - 2032F
- Historical Data and Forecast of Latvia Wellness Water Market Revenues & Volume By Antioxidants for the Period 2022 - 2032F
- Historical Data and Forecast of Latvia Wellness Water Market Revenues & Volume By Herbal Extracts for the Period 2022 - 2032F
- Historical Data and Forecast of Latvia Wellness Water Market Revenues & Volume By Custom Blends for the Period 2022 - 2032F
- Historical Data and Forecast of Latvia Wellness Water Market Revenues & Volume By Benefits for the Period 2022 - 2032F
- Historical Data and Forecast of Latvia Wellness Water Market Revenues & Volume By pH Balance for the Period 2022 - 2032F
- Historical Data and Forecast of Latvia Wellness Water Market Revenues & Volume By Hydration Boost for the Period 2022 - 2032F
- Historical Data and Forecast of Latvia Wellness Water Market Revenues & Volume By Anti-Aging for the Period 2022 - 2032F
- Historical Data and Forecast of Latvia Wellness Water Market Revenues & Volume By Toxin Removal for the Period 2022 - 2032F
- Historical Data and Forecast of Latvia Wellness Water Market Revenues & Volume By Immunity Support for the Period 2022 - 2032F
- Historical Data and Forecast of Latvia Wellness Water Market Revenues & Volume By End Use for the Period 2022 - 2032F
- Historical Data and Forecast of Latvia Wellness Water Market Revenues & Volume By Retail Stores for the Period 2022 - 2032F
- Historical Data and Forecast of Latvia Wellness Water Market Revenues & Volume By Fitness Centers for the Period 2022 - 2032F
- Historical Data and Forecast of Latvia Wellness Water Market Revenues & Volume By Beauty and Wellness for the Period 2022 - 2032F
- Historical Data and Forecast of Latvia Wellness Water Market Revenues & Volume By Health Enthusiasts for the Period 2022 - 2032F
- Historical Data and Forecast of Latvia Wellness Water Market Revenues & Volume By Restaurants and Cafes for the Period 2022 - 2032F
- Historical Data and Forecast of Latvia Wellness Water Market Revenues & Volume By End Use for the Period 2022 - 2032F
- Historical Data and Forecast of Latvia Wellness Water Market Revenues & Volume By Professional Tattooing for the Period 2022 - 2032F
- Historical Data and Forecast of Latvia Wellness Water Market Revenues & Volume By Tattoo Studios for the Period 2022 - 2032F
- Latvia Wellness Water Import Export Trade Statistics
- Market Opportunity Assessment By Type
- Market Opportunity Assessment By Ingredients
- Market Opportunity Assessment By Benefits
- Market Opportunity Assessment By End Use
- Market Opportunity Assessment By End Use
- Latvia Wellness Water Top Companies Market Share
- Latvia Wellness Water Competitive Benchmarking By Technical and Operational Parameters
- Latvia Wellness Water Company Profiles
- Latvia Wellness Water Key Strategic Recommendations
Frequently Asked Questions About the Market Study (FAQs):
6Wresearch actively monitors the Latvia Wellness Water Market and publishes its comprehensive annual report, highlighting emerging trends, growth drivers, revenue analysis, and forecast outlook. Our insights help businesses to make data-backed strategic decisions with ongoing market dynamics. Our analysts track relevent industries related to the Latvia Wellness Water Market, allowing our clients with actionable intelligence and reliable forecasts tailored to emerging regional needs.
Yes, we provide customisation as per your requirements. To learn more, feel free to contact us on sales@6wresearch.com
1 Executive Summary |
2 Introduction |
2.1 Key Highlights of the Report |
2.2 Report Description |
2.3 Market Scope & Segmentation |
2.4 Research Methodology |
2.5 Assumptions |
3 Latvia Wellness Water Market Overview |
3.1 Latvia Country Macro Economic Indicators |
3.2 Latvia Wellness Water Market Revenues & Volume, 2022 & 2032F |
3.3 Latvia Wellness Water Market - Industry Life Cycle |
3.4 Latvia Wellness Water Market - Porter's Five Forces |
3.5 Latvia Wellness Water Market Revenues & Volume Share, By Type, 2022 & 2032F |
3.6 Latvia Wellness Water Market Revenues & Volume Share, By Ingredients, 2022 & 2032F |
3.7 Latvia Wellness Water Market Revenues & Volume Share, By Benefits, 2022 & 2032F |
3.8 Latvia Wellness Water Market Revenues & Volume Share, By End Use, 2022 & 2032F |
4 Latvia Wellness Water Market Dynamics |
4.1 Impact Analysis |
4.2 Market Drivers |
4.2.1 Increasing consumer awareness about health and wellness benefits of drinking water |
4.2.2 Growing trend towards healthy lifestyles and preventive healthcare |
4.2.3 Rising disposable income leading to higher spending on premium wellness products |
4.3 Market Restraints |
4.3.1 High competition from other beverage categories such as energy drinks and sports drinks |
4.3.2 Limited availability of specialized distribution channels for wellness water products |
4.3.3 Price sensitivity among certain consumer segments |
5 Latvia Wellness Water Market Trends |
6 Latvia Wellness Water Market, By Types |
6.1 Latvia Wellness Water Market, By Type |
6.1.1 Overview and Analysis |
6.1.2 Latvia Wellness Water Market Revenues & Volume, By Type, 2022 - 2032F |
6.1.3 Latvia Wellness Water Market Revenues & Volume, By Alkaline Water, 2022 - 2032F |
6.1.4 Latvia Wellness Water Market Revenues & Volume, By Vitamin-Infused Water, 2022 - 2032F |
6.1.5 Latvia Wellness Water Market Revenues & Volume, By Hydrogen Water, 2022 - 2032F |
6.1.6 Latvia Wellness Water Market Revenues & Volume, By Detox Water, 2022 - 2032F |
6.1.7 Latvia Wellness Water Market Revenues & Volume, By Others, 2022 - 2032F |
6.2 Latvia Wellness Water Market, By Ingredients |
6.2.1 Overview and Analysis |
6.2.2 Latvia Wellness Water Market Revenues & Volume, By Minerals, 2022 - 2032F |
6.2.3 Latvia Wellness Water Market Revenues & Volume, By Vitamins and Electrolytes, 2022 - 2032F |
6.2.4 Latvia Wellness Water Market Revenues & Volume, By Antioxidants, 2022 - 2032F |
6.2.5 Latvia Wellness Water Market Revenues & Volume, By Herbal Extracts, 2022 - 2032F |
6.2.6 Latvia Wellness Water Market Revenues & Volume, By Custom Blends, 2022 - 2032F |
6.3 Latvia Wellness Water Market, By Benefits |
6.3.1 Overview and Analysis |
6.3.2 Latvia Wellness Water Market Revenues & Volume, By pH Balance, 2022 - 2032F |
6.3.3 Latvia Wellness Water Market Revenues & Volume, By Hydration Boost, 2022 - 2032F |
6.3.4 Latvia Wellness Water Market Revenues & Volume, By Anti-Aging, 2022 - 2032F |
6.3.5 Latvia Wellness Water Market Revenues & Volume, By Toxin Removal, 2022 - 2032F |
6.3.6 Latvia Wellness Water Market Revenues & Volume, By Immunity Support, 2022 - 2032F |
6.4 Latvia Wellness Water Market, By End Use |
6.4.1 Overview and Analysis |
6.4.2 Latvia Wellness Water Market Revenues & Volume, By Retail Stores, 2022 - 2032F |
6.4.3 Latvia Wellness Water Market Revenues & Volume, By Fitness Centers, 2022 - 2032F |
6.4.4 Latvia Wellness Water Market Revenues & Volume, By Beauty and Wellness, 2022 - 2032F |
6.4.5 Latvia Wellness Water Market Revenues & Volume, By Health Enthusiasts, 2022 - 2032F |
6.4.6 Latvia Wellness Water Market Revenues & Volume, By Restaurants and Cafes, 2022 - 2032F |
7 Latvia Wellness Water Market Import-Export Trade Statistics |
7.1 Latvia Wellness Water Market Export to Major Countries |
7.2 Latvia Wellness Water Market Imports from Major Countries |
8 Latvia Wellness Water Market Key Performance Indicators |
8.1 Consumer engagement metrics such as social media followers, website traffic, and online reviews |
8.2 Repeat purchase rate and customer retention rate for wellness water products |
8.3 Distribution network expansion metrics like new retail partnerships, geographic coverage, and shelf placement in stores |
9 Latvia Wellness Water Market - Opportunity Assessment |
9.1 Latvia Wellness Water Market Opportunity Assessment, By Type, 2022 & 2032F |
9.2 Latvia Wellness Water Market Opportunity Assessment, By Ingredients, 2022 & 2032F |
9.3 Latvia Wellness Water Market Opportunity Assessment, By Benefits, 2022 & 2032F |
9.4 Latvia Wellness Water Market Opportunity Assessment, By End Use, 2022 & 2032F |
10 Latvia Wellness Water Market - Competitive Landscape |
10.1 Latvia Wellness Water Market Revenue Share, By Companies, 2025 |
10.2 Latvia Wellness Water Market Competitive Benchmarking, By Operating and Technical Parameters |
11 Company Profiles |
12 Recommendations |
13 Disclaimer |
Export potential assessment - trade Analytics for 2030
Export potential enables firms to identify high-growth global markets with greater confidence by combining advanced trade intelligence with a structured quantitative methodology. The framework analyzes emerging demand trends and country-level import patterns while integrating macroeconomic and trade datasets such as GDP and population forecasts, bilateral import–export flows, tariff structures, elasticity differentials between developed and developing economies, geographic distance, and import demand projections. Using weighted trade values from 2020–2024 as the base period to project country-to-country export potential for 2030, these inputs are operationalized through calculated drivers such as gravity model parameters, tariff impact factors, and projected GDP per-capita growth. Through an analysis of hidden potentials, demand hotspots, and market conditions that are most favorable to success, this method enables firms to focus on target countries, maximize returns, and global expansion with data, backed by accuracy.
By factoring in the projected importer demand gap that is currently unmet and could be potential opportunity, it identifies the potential for the Exporter (Country) among 190 countries, against the general trade analysis, which identifies the biggest importer or exporter.
To discover high-growth global markets and optimize your business strategy:
Click Here
Pricing
- Single User License$ 1,995
- Department License$ 2,400
- Site License$ 3,120
- Global License$ 3,795

Search
Thought Leadership and Analyst Meet


Our Clients
Latest Reports
- France Thermally Conductive Filler Dispersants Market (2026-2032) | Challenges, Restraints, Value, Share, Size, segmentation, Analysis, Trends, Investment Opportunities, Outlook, Pricing, Demand, Forecast, Revenue, Companies, Growth, Drivers, Strategy, Insights, Competition
- Egypt Thermally Conductive Filler Dispersants Market (2026-2032) | Competition, Forecast, Strategy, Value, Insights, Outlook, Investment Opportunities, Pricing, Demand, Share, segmentation, Drivers, Size, Companies, Restraints, Growth, Trends, Revenue, Challenges, Analysis
- Czech Republic Thermally Conductive Filler Dispersants Market (2026-2032) | Forecast, Pricing, Analysis, Drivers, Insights, Size, Demand, Growth, Challenges, segmentation, Competition, Outlook, Trends, Investment Opportunities, Companies, Strategy, Revenue, Share, Value, Restraints
- Colombia Thermally Conductive Filler Dispersants Market (2026-2032) | segmentation, Trends, Share, Drivers, Strategy, Companies, Demand, Insights, Size, Challenges, Value, Competition, Analysis, Growth, Revenue, Restraints, Forecast, Pricing, Outlook, Investment Opportunities
- China Thermally Conductive Filler Dispersants Market (2026-2032) | Restraints, Investment Opportunities, Pricing, Companies, Share, Size, Challenges, Trends, Outlook, Value, Analysis, Competition, Revenue, Drivers, Forecast, Demand, Insights, Growth, Strategy, segmentation
- Chile Thermally Conductive Filler Dispersants Market (2026-2032) | Investment Opportunities, Trends, Value, Restraints, Share, Companies, Forecast, segmentation, Pricing, Challenges, Demand, Size, Analysis, Drivers, Outlook, Growth, Competition, Strategy, Revenue, Insights
- Cambodia Thermally Conductive Filler Dispersants Market (2026-2032) | Analysis, Share, Outlook, Strategy, Pricing, Demand, Size, Growth, segmentation, Insights, Revenue, Forecast, Challenges, Competition, Companies, Investment Opportunities, Trends, Restraints, Value, Drivers
- Brazil Thermally Conductive Filler Dispersants Market (2026-2032) | Restraints, Forecast, Competition, Size, Revenue, Value, Investment Opportunities, Trends, Insights, Outlook, Growth, Analysis, Drivers, segmentation, Pricing, Challenges, Strategy, Share, Companies, Demand
- Bangladesh Thermally Conductive Filler Dispersants Market (2026-2032) | Restraints, Trends, Analysis, Competition, Insights, Forecast, Value, Investment Opportunities, Pricing, Share, Demand, Outlook, Revenue, segmentation, Companies, Drivers, Growth, Size, Challenges, Strategy
- Bahrain Thermally Conductive Filler Dispersants Market (2026-2032) | Trends, Outlook, Pricing, Demand, Value, Competition, Forecast, Growth, segmentation, Revenue, Companies, Analysis, Insights, Size, Drivers, Challenges, Strategy, Investment Opportunities, Share, Restraints
Industry Events and Analyst Meet

HIMTEX 2026

India Refining Summit 2026

India EV Show 2026

EV tech India Expo 2026

Auto Tech Asia 2026
Whitepaper
- Middle East & Africa Commercial Security Market Click here to view more.
- Middle East & Africa Fire Safety Systems & Equipment Market Click here to view more.
- GCC Drone Market Click here to view more.
- Middle East Lighting Fixture Market Click here to view more.
- GCC Physical & Perimeter Security Market Click here to view more.
6WResearch In News
- Doha a strategic location for EV manufacturing hub: IPA Qatar
- Demand for luxury TVs surging in the GCC, says Samsung
- Empowering Growth: The Thriving Journey of Bangladesh’s Cable Industry
- Demand for luxury TVs surging in the GCC, says Samsung
- Video call with a traditional healer? Once unthinkable, it’s now common in South Africa
- Intelligent Buildings To Smooth GCC’s Path To Net Zero