Lebanon Transport Packaging Market (2026-2032) | Revenue, COVID-19 IMPACT, Trends, Industry, Value, Outlook, Growth, Forecast, Size, Companies, Share & Analysis
Market Forecast By Material Type (Plastic, Polyethylene (PE), Polypropylene (PP), Polyethylene Terephthalate (PET), Paper & Paperboard, Metal, Wood, Others), By Packaging Types (Cartons, Wooden crates, Containers, Corrugated boxes, Barrels, IBCs, Strapping, Others), By End-users (Agriculture, Automotive, Building & Construction, Chemicals & Pharmaceuticals, Food & Beverages, Metallurgical, Electrical & Electronics, Others) And Competitive Landscape
| Product Code: ETC006667 | Publication Date: Jun 2023 | Product Type: Report | ||
| Publisher: 6Wresearch | Author: Ravi Bhandari | No. of Pages: 70 | No. of Figures: 35 | No. of Tables: 5 |
Lebanon Transport Packaging Market Summary
The lebanon transport packaging market was estimated at USD 180 Million in 2025 and is projected to reach USD 248 Million by 2032, growing at a CAGR of 5.6% from 2026 to 2032.
Lebanon Transport Packaging Market Growth Rate Analysis (2021-2032)
The Lebanon transport packaging market has maintained stable growth, displaying a 5.4% increase in 2021, followed by a slight decline to 5.2% in 2022 due to supply chain disruptions. However, demand rebounded to 5.3% in 2023, bolstered by advancements in logistics technology and a growing e-commerce sector. The trend continued with a projected 5.7% growth in 2024, driven by increased investments in sustainable packaging solutions and robust consumer demand. Fluctuations in growth rates, such as the dip to 5.1% in 2031, can be attributed to market adjustments and regulatory changes impacting production practices. Nonetheless, the forecast suggests resilience with consistent growth around 5.6% through 2032, reflecting ongoing infrastructural developments and a commitment to energy transition in the packaging sector.
Lebanon Transport Packaging Market Year-wise Growth Rate and Key Drivers
This graph highlights how the Lebanon Transport Packaging Market has steadily grown over the past five years, supported by major growth factors.
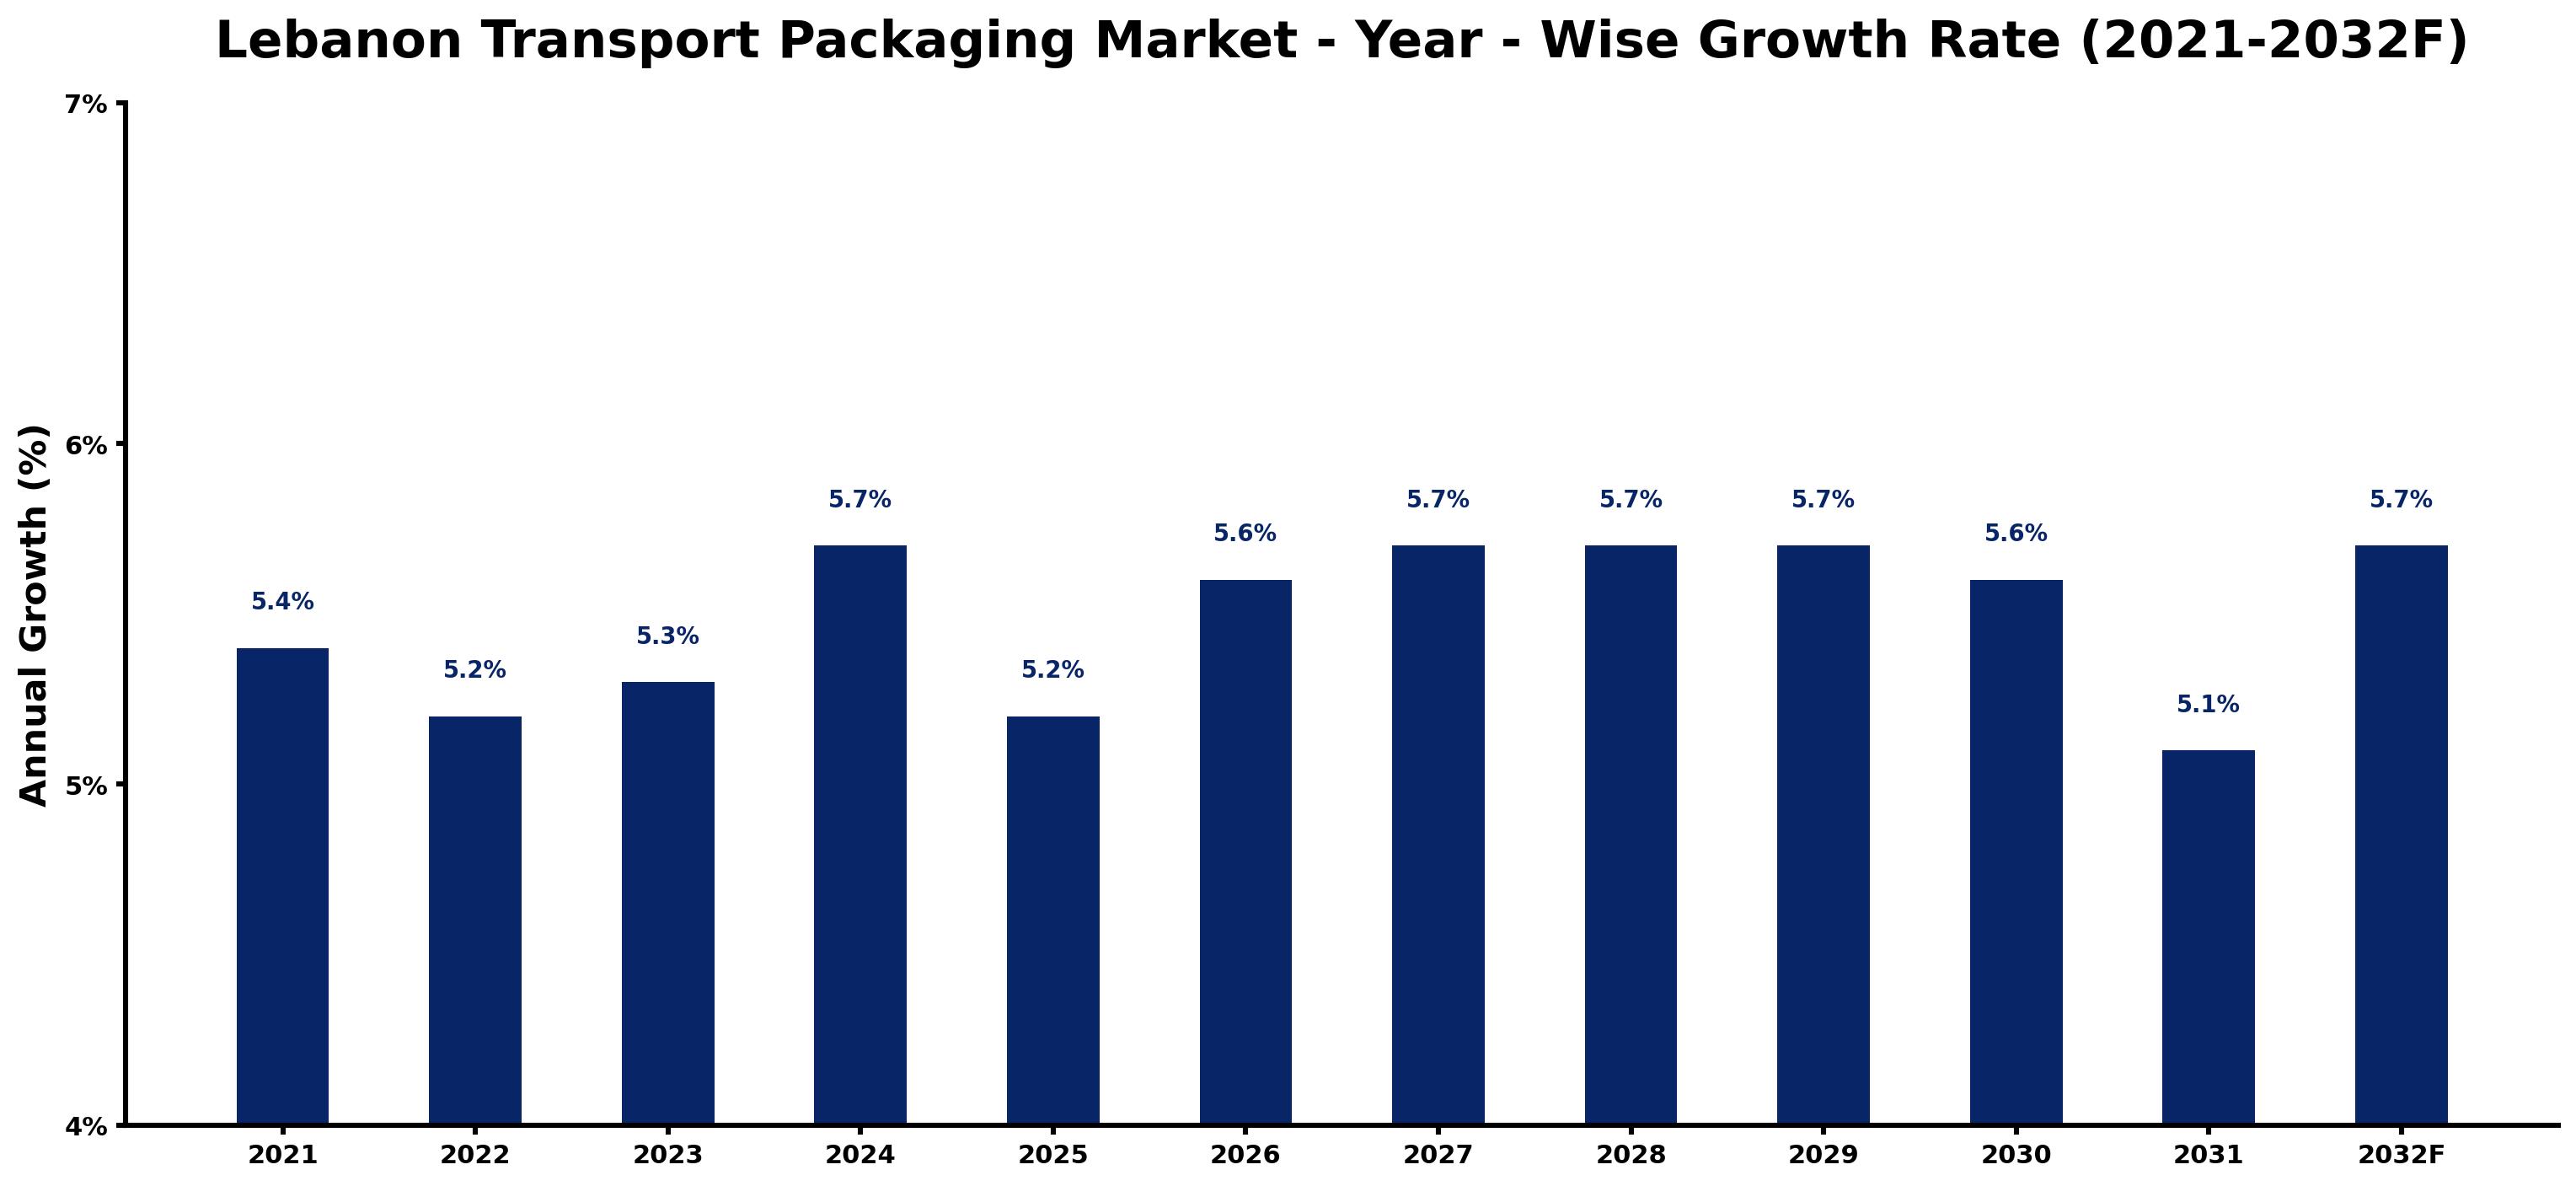
The table below presents the year wise growth rates along with the key drivers influencing the market
| Year | Growth Rate | Major Drivers |
| 2021 | 5.4% | Post-lockdown retail projects spurred a significant need for reliable transport packaging solutions. |
| 2022 | 5.2% | E-commerce expansion led to diversified packaging requirements, enhancing market dynamics significantly. |
| 2023 | 5.3% | Supply chain disruptions prompted businesses to rethink packaging efficiency and sustainability. |
| 2024 | 5.7% | Investment in local manufacturing capabilities prioritized cost-effective and eco-friendly packaging materials. |
| 2025 | 5.2% | Innovation in biodegradable packaging options gained traction among environmentally conscious consumers. |
| 2026 | 5.6% | Increased urbanization compelled logistics companies to seek optimized transport packaging strategies. |
| 2027 | 5.7% | Emerging technologies in packaging design attracted substantial interest from regional investors. |
| 2028 | 5.7% | Consumer preferences shifted towards personalized packaging, impacting production methodologies markedly. |
| 2029 | 5.7% | International trade agreements opened new markets for Lebanese transport packaging manufacturers. |
| 2030 | 5.6% | Stringent environmental regulations pushed companies to adopt greener packaging alternatives extensively. |
| 2031 | 5.1% | Unprecedented growth in the food delivery sector reshaped packaging requirements dramatically. |
| 2032 | 5.7% | Digital transformation initiatives improved inventory management and packaging efficiency across industries. |
Note - Market size estimations and growth projections presented in this report are based on 6Wresearch's advanced forecasting approach, validated with industry datasets as of June 2026.
Lebanon Transport Packaging Market Synopsis
The Lebanon Transport Packaging Market is projected to reach 5.6% and witness significant growth during the forecast period (2026-2032). This growth can primarily be attributed to rapid industrialization and rising trade activities within the country. The demand for protective packaging materials, including corrugated boxes and bubble wraps, is expected to surge as businesses respond to the higher risk of product damage during transportation. Additionally, advancements in shipping technology have broadened the scope for lightweight and cost-effective transport packaging solutions, enhancing the protection against both physical and chemical damages while ensuring optimal product visibility.
Lebanon Transport Packaging Market Growth Drivers
Several factors are driving the growth of the Lebanon Transport Packaging Market. Firstly, the increasing preference for convenience products among consumers is compelling manufacturers to adopt innovative packaging practices. This shift leads to greater demand for advanced packaging solutions, tailored to enhance customer experience and safety during transportation. Secondly, urbanization trends and evolving lifestyle preferences have sparked a growth in online retailing activities, creating a demand for reliable delivery services. High-quality packaging materials are essential for ensuring safe product delivery, further propelling market expansion. Thirdly, the rise in e-commerce activities in Lebanon necessitates the use of effective transport packaging to ensure product integrity. Moreover, enhanced logistical frameworks and investment in distribution networks are facilitating more efficient transport operations, thereby boosting the overall demand for transport packaging solutions.
Lebanon Transport Packaging Market Trends and Opportunities
The evolving landscape of the Lebanon Transport Packaging Market presents numerous trends and opportunities. One of the key trends is the growing emphasis on sustainability within the packaging sector. Companies are increasingly looking for eco-friendly materials that not only protect products but also meet environmental regulations. Additionally, technological innovations, such as smart packaging solutions that provide real-time tracking and product condition monitoring, are gaining traction. This trend reflects a shift towards increased transparency and consumer engagement during the shipping process.
There are also immense opportunities in developing specialized packaging solutions tailored to specific industries, such as pharmaceuticals and perishables, where product integrity is critical. Furthermore, collaboration between packaging manufacturers and logistics providers could lead to the development of more efficient supply chain processes, enhancing the overall packaging experience. The burgeoning market for lightweight packaging solutions further highlights the opportunity for innovation, as businesses strive to reduce shipping costs while ensuring product safety.
Lebanon Transport Packaging Market Challenges and Restraints
Despite the promising growth, the Lebanon Transport Packaging Market faces several challenges and restraints. The economic instability in Lebanon can impact consumer spending and ultimately affect packaging demand. Furthermore, fluctuations in raw material prices can create uncertainty for manufacturers and may hinder their ability to offer competitive pricing. Logistic challenges, including inadequate infrastructure and transportation networks, can also impede the efficiency of product delivery and packaging usage. Companies must navigate these obstacles while striving for innovation in their packaging solutions.
Additionally, regulatory hurdles concerning packaging materials can create complexities for businesses, particularly those looking to introduce eco-friendly options. Compliance with changing standards can require significant investment in research and development, posing a barrier for smaller companies entering the market. Lastly, the need for continuous adaptation to rapidly changing consumer preferences adds pressure on manufacturers, who must invest in R&D to remain competitive.
Lebanon Transport Packaging Market Government Investment and Initiatives
The government of Lebanon is increasingly recognizing the importance of the transport packaging sector in fostering economic growth and trade efficiency. Various initiatives are being explored, including public investment in infrastructure that supports logistics and transport operations. Such developments aim to facilitate smoother product deliveries and enhance market competitiveness. The government is also focusing on regulatory frameworks that encourage investment in sustainable packaging solutions, aligning with global environmental standards.
Furthermore, initiatives to promote local manufacturing capabilities in the packaging sector are on the rise. These initiatives could enhance job creation while reducing dependency on imported packaging materials. By supporting local production, the government aims to stimulate the economy and ensure that industries have access to high-quality packaging solutions that are both effective and convenient. Collaborative efforts between public and private sectors are expected to amplify these investments, making the Lebanon Transport Packaging Market more robust in the coming years.
Lebanon Transport Packaging Market Latest Developments (May 2025 - June 2026)
The Lebanon Transport Packaging Market has witnessed notable developments between May 2025 and June 2026. Various stakeholders have been investing in research and development to innovate packaging solutions that cater to the diverse needs of consumers and industries. Initiatives focusing on the adoption of biodegradable materials have gained momentum, reflecting the growing consumer demand for environmentally friendly options.
Moreover, industry players have started implementing advanced technology solutions in packaging processes, enhancing efficiency and product safety during transit. The integration of smart packaging solutions offering tracking capabilities has become particularly prominent, indicating a move towards enhanced transparency in the supply chain.
In addition, the local market has started to witness partnerships aimed at improving distribution networks, thereby optimizing overall logistics and transport packaging efficiencies. This collaborative approach not only addresses current market challenges but also positions companies to better respond to future consumer trends and demands.
Lebanon Transport Packaging Market - Key Attractiveness of the Report
- 10 Years of Market Numbers
- Historical Data Starting from 2022 to 2025
- Base Year: 2025
- Forecast Data until 2032
- Key Performance Indicators Impacting the Market
- Major Upcoming Developments and Projects
Key Highlights of the Report:
- Lebanon Transport Packaging Market Outlook
- Market Size of Lebanon Transport Packaging Market, 2025
- Forecast of Lebanon Transport Packaging Market, 2032F
- Historical Data and Forecast of Lebanon Transport Packaging Revenues & Volume for the Period 2022-2032F
- Lebanon Transport Packaging Market Trend Evolution
- Lebanon Transport Packaging Market Drivers and Challenges
- Lebanon Transport Packaging Price Trends
- Lebanon Transport Packaging Porter's Five Forces
- Lebanon Transport Packaging Industry Life Cycle
- Historical Data and Forecast of Lebanon Transport Packaging Market Revenues & Volume By Material Type for the Period 2022-2032F
- Historical Data and Forecast of Lebanon Transport Packaging Market Revenues & Volume By Plastic for the Period 2022-2032F
- Historical Data and Forecast of Lebanon Transport Packaging Market Revenues & Volume By Polyethylene (PE) for the Period 2022-2032F
- Historical Data and Forecast of Lebanon Transport Packaging Market Revenues & Volume By Polypropylene (PP) for the Period 2022-2032F
- Historical Data and Forecast of Lebanon Transport Packaging Market Revenues & Volume By Polyethylene Terephthalate (PET) for the Period 2022-2032F
- Historical Data and Forecast of Lebanon Transport Packaging Market Revenues & Volume By Paper & Paperboard for the Period 2022-2032F
- Historical Data and Forecast of Lebanon Transport Packaging Market Revenues & Volume By Metal for the Period 2022-2032F
- Historical Data and Forecast of Lebanon Transport Packaging Market Revenues & Volume By Wood for the Period 2022-2032F
- Historical Data and Forecast of Lebanon Plastic Transport Packaging Market Revenues & Volume By Others for the Period 2022-2032F
- Historical Data and Forecast of Lebanon Transport Packaging Market Revenues & Volume By Packaging Types for the Period 2022-2032F
- Historical Data and Forecast of Lebanon Transport Packaging Market Revenues & Volume By Cartons for the Period 2022-2032F
- Historical Data and Forecast of Lebanon Transport Packaging Market Revenues & Volume By Wooden crates for the Period 2022-2032F
- Historical Data and Forecast of Lebanon Transport Packaging Market Revenues & Volume By Containers for the Period 2022-2032F
- Historical Data and Forecast of Lebanon Transport Packaging Market Revenues & Volume By Corrugated boxes for the Period 2022-2032F
- Historical Data and Forecast of Lebanon Transport Packaging Market Revenues & Volume By Barrels for the Period 2022-2032F
- Historical Data and Forecast of Lebanon Transport Packaging Market Revenues & Volume By IBCs for the Period 2022-2032F
- Historical Data and Forecast of Lebanon Transport Packaging Market Revenues & Volume By Strapping for the Period 2022-2032F
- Historical Data and Forecast of Lebanon Transport Packaging Market Revenues & Volume By Others for the Period 2022-2032F
- Historical Data and Forecast of Lebanon Transport Packaging Market Revenues & Volume By End-users for the Period 2022-2032F
- Historical Data and Forecast of Lebanon Transport Packaging Market Revenues & Volume By Agriculture for the Period 2022-2032F
- Historical Data and Forecast of Lebanon Transport Packaging Market Revenues & Volume By Automotive for the Period 2022-2032F
- Historical Data and Forecast of Lebanon Transport Packaging Market Revenues & Volume By Building & Construction for the Period 2022-2032F
- Historical Data and Forecast of Lebanon Transport Packaging Market Revenues & Volume By Chemicals & Pharmaceuticals for the Period 2022-2032F
- Historical Data and Forecast of Lebanon Transport Packaging Market Revenues & Volume By Food & Beverages for the Period 2022-2032F
- Historical Data and Forecast of Lebanon Transport Packaging Market Revenues & Volume By Metallurgical for the Period 2022-2032F
- Historical Data and Forecast of Lebanon Transport Packaging Market Revenues & Volume By Electrical & Electronics for the Period 2022-2032F
- Historical Data and Forecast of Lebanon Transport Packaging Market Revenues & Volume By Others for the Period 2022-2032F
- Lebanon Transport Packaging Import Export Trade Statistics
- Market Opportunity Assessment By Material Type
- Market Opportunity Assessment By Packaging Types
- Market Opportunity Assessment By End-users
- Lebanon Transport Packaging Top Companies Market Share
- Lebanon Transport Packaging Competitive Benchmarking By Technical and Operational Parameters
- Lebanon Transport Packaging Company Profiles
- Lebanon Transport Packaging Key Strategic Recommendations
Frequently Asked Questions About the Market Study (FAQs):
The market growth is driven by rapid industrialization, increasing trade activities, and a growing demand for protective packaging materials.
Technological advancements are leading to the development of lightweight, cost-effective packaging solutions that provide better protection and visibility for products during transit.
Key challenges include economic instability, fluctuating raw material prices, and regulatory hurdles that can impact production and pricing strategies.
The government is focusing on investments in infrastructure and sustainable packaging initiatives to support local manufacturing and improve trade efficiency.
6Wresearch actively monitors the Lebanon Transport Packaging Market and publishes its comprehensive annual report, highlighting emerging trends, growth drivers, revenue analysis, and forecast outlook. Our insights help businesses to make data-backed strategic decisions with ongoing market dynamics. Our analysts track relevent industries related to the Lebanon Transport Packaging Market, allowing our clients with actionable intelligence and reliable forecasts tailored to emerging regional needs.
Yes, we provide customisation as per your requirements. To learn more, feel free to contact us on sales@6wresearch.com
1 Executive Summary |
2 Introduction |
2.1 Key Highlights of the Report |
2.2 Report Description |
2.3 Market Scope & Segmentation |
2.4 Research Methodology |
2.5 Assumptions |
3 Lebanon Transport Packaging Market Overview |
3.1 Lebanon Country Macro Economic Indicators |
3.2 Lebanon Transport Packaging Market Revenues & Volume, 2022 & 2032F |
3.3 Lebanon Transport Packaging Market - Industry Life Cycle |
3.4 Lebanon Transport Packaging Market - Porter's Five Forces |
3.5 Lebanon Transport Packaging Market Revenues & Volume Share, By Material Type, 2022 & 2032F |
3.6 Lebanon Transport Packaging Market Revenues & Volume Share, By Packaging Types, 2022 & 2032F |
3.7 Lebanon Transport Packaging Market Revenues & Volume Share, By End-users, 2022 & 2032F |
4 Lebanon Transport Packaging Market Dynamics |
4.1 Impact Analysis |
4.2 Market Drivers |
4.3 Market Restraints |
5 Lebanon Transport Packaging Market Trends |
6 Lebanon Transport Packaging Market, By Types |
6.1 Lebanon Transport Packaging Market, By Material Type |
6.1.1 Overview and Analysis |
6.1.2 Lebanon Transport Packaging Market Revenues & Volume, By Material Type, 2022-2032F |
6.1.3 Lebanon Transport Packaging Market Revenues & Volume, By Plastic, 2022-2032F |
6.1.4 Lebanon Transport Packaging Market Revenues & Volume, By Polyethylene (PE), 2022-2032F |
6.1.5 Lebanon Transport Packaging Market Revenues & Volume, By Polypropylene (PP), 2022-2032F |
6.1.6 Lebanon Transport Packaging Market Revenues & Volume, By Polyethylene Terephthalate (PET), 2022-2032F |
6.1.7 Lebanon Transport Packaging Market Revenues & Volume, By Paper & Paperboard, 2022-2032F |
6.1.8 Lebanon Transport Packaging Market Revenues & Volume, By Metal, 2022-2032F |
6.1.9 Lebanon Transport Packaging Market Revenues & Volume, By Others, 2022-2032F |
6.1.10 Lebanon Transport Packaging Market Revenues & Volume, By Others, 2022-2032F |
6.2 Lebanon Transport Packaging Market, By Packaging Types |
6.2.1 Overview and Analysis |
6.2.2 Lebanon Transport Packaging Market Revenues & Volume, By Cartons, 2022-2032F |
6.2.3 Lebanon Transport Packaging Market Revenues & Volume, By Wooden crates, 2022-2032F |
6.2.4 Lebanon Transport Packaging Market Revenues & Volume, By Containers, 2022-2032F |
6.2.5 Lebanon Transport Packaging Market Revenues & Volume, By Corrugated boxes, 2022-2032F |
6.2.6 Lebanon Transport Packaging Market Revenues & Volume, By Barrels, 2022-2032F |
6.2.7 Lebanon Transport Packaging Market Revenues & Volume, By IBCs, 2022-2032F |
6.2.8 Lebanon Transport Packaging Market Revenues & Volume, By Others, 2022-2032F |
6.2.9 Lebanon Transport Packaging Market Revenues & Volume, By Others, 2022-2032F |
6.3 Lebanon Transport Packaging Market, By End-users |
6.3.1 Overview and Analysis |
6.3.2 Lebanon Transport Packaging Market Revenues & Volume, By Agriculture, 2022-2032F |
6.3.3 Lebanon Transport Packaging Market Revenues & Volume, By Automotive, 2022-2032F |
6.3.4 Lebanon Transport Packaging Market Revenues & Volume, By Building & Construction, 2022-2032F |
6.3.5 Lebanon Transport Packaging Market Revenues & Volume, By Chemicals & Pharmaceuticals, 2022-2032F |
6.3.6 Lebanon Transport Packaging Market Revenues & Volume, By Food & Beverages, 2022-2032F |
6.3.7 Lebanon Transport Packaging Market Revenues & Volume, By Metallurgical, 2022-2032F |
6.3.8 Lebanon Transport Packaging Market Revenues & Volume, By Others, 2022-2032F |
6.3.9 Lebanon Transport Packaging Market Revenues & Volume, By Others, 2022-2032F |
7 Lebanon Transport Packaging Market Import-Export Trade Statistics |
7.1 Lebanon Transport Packaging Market Export to Major Countries |
7.2 Lebanon Transport Packaging Market Imports from Major Countries |
8 Lebanon Transport Packaging Market Key Performance Indicators |
9 Lebanon Transport Packaging Market - Opportunity Assessment |
9.1 Lebanon Transport Packaging Market Opportunity Assessment, By Material Type, 2022 & 2032F |
9.2 Lebanon Transport Packaging Market Opportunity Assessment, By Packaging Types, 2022 & 2032F |
9.3 Lebanon Transport Packaging Market Opportunity Assessment, By End-users, 2022 & 2032F |
10 Lebanon Transport Packaging Market - Competitive Landscape |
10.1 Lebanon Transport Packaging Market Revenue Share, By Companies, 2025 |
10.2 Lebanon Transport Packaging Market Competitive Benchmarking, By Operating and Technical Parameters |
11 Company Profiles |
12 Recommendations |
13 Disclaimer |
Global Go To Market Strategy - 2030
Export potential enables firms to identify high-growth global markets with greater confidence by combining advanced trade intelligence with a structured quantitative methodology. The framework analyzes emerging demand trends and country-level import patterns while integrating macroeconomic and trade datasets such as GDP and population forecasts, bilateral import–export flows, tariff structures, elasticity differentials between developed and developing economies, geographic distance, and import demand projections. Using weighted trade values from 2020–2024 as the base period to project country-to-country export potential for 2030, these inputs are operationalized through calculated drivers such as gravity model parameters, tariff impact factors, and projected GDP per-capita growth. Through an analysis of hidden potentials, demand hotspots, and market conditions that are most favorable to success, this method enables firms to focus on target countries, maximize returns, and global expansion with data, backed by accuracy.
By factoring in the projected importer demand gap that is currently unmet and could be potential opportunity, it identifies the potential for the Exporter (Country) among 190 countries, against the general trade analysis, which identifies the biggest importer or exporter.
To discover high-growth global markets and optimize your business strategy:
Click Here
Pricing
- Single User License$ 1,995
- Department License$ 2,400
- Site License$ 3,120
- Global License$ 3,795

Leadership Perspectives from Industry Events
Search
Thought Leadership and Analyst Meet


Our Clients
6WResearch In News
- India Air Conditioner Market Set for Strong Rebound in 2026 After Weather-Led Correction and GST-Driven Recovery: 6Wresearch
- ADAS in India: How Automatic Emergency Braking, Blind Spot Detection & Driver Monitoring are Transforming Road Safety
- Doha a strategic location for EV manufacturing hub: IPA Qatar
- Demand for luxury TVs surging in the GCC, says Samsung
- Empowering Growth: The Thriving Journey of Bangladesh’s Cable Industry
- Demand for luxury TVs surging in the GCC, says Samsung
Latest Reports
- Nicaragua RPG Gaming Market (2026-2032)
- New Zealand RPG Gaming Market (2026-2032)
- Netherlands RPG Gaming Market (2026-2032)
- Nauru RPG Gaming Market (2026-2032)
- Namibia RPG Gaming Market (2026-2032)
- Mozambique RPG Gaming Market (2026-2032)
- Montenegro RPG Gaming Market (2026-2032)
- Mongolia RPG Gaming Market (2026-2032)
- Monaco RPG Gaming Market (2026-2032)
- Micronesia RPG Gaming Market (2026-2032)
Industry Events and Analyst Meet

HIMTEX 2026

India Refining Summit 2026

India EV Show 2026

EV tech India Expo 2026

Auto Tech Asia 2026
Whitepaper
- Middle East & Africa Commercial Security Market Click here to view more.
- Middle East & Africa Fire Safety Systems & Equipment Market Click here to view more.
- GCC Drone Market Click here to view more.
- Middle East Lighting Fixture Market Click here to view more.
- GCC Physical & Perimeter Security Market Click here to view more.