Lebanon Wood Flooring Market (2026-2032) | Forecast, Value, Outlook, Revenue, Growth, Analysis, Industry, Companies, Share, Size & Trends
Market Forecast By Product Type (Solid Wood, Engineered Wood), By Distribution Channel (Home Centers, Flagship Stores, Specialty Stores, Online, Other), By End-User (Residential, Commercial) And Competitive Landscape
| Product Code: ETC041488 | Publication Date: Jan 2021 | Updated Date: Jun 2026 | Product Type: Report | |
| Publisher: 6Wresearch | Author: Ravi Bhandari | No. of Pages: 70 | No. of Figures: 35 | No. of Tables: 5 |
Lebanon Wood Flooring Market Summary
The lebanon wood flooring market was estimated at USD 389 Million in 2025 and is projected to reach USD 521 Million by 2032, growing at a CAGR of 4.7% from 2026 to 2032.
Lebanon Wood Flooring Market Year-wise Growth Rate and Key Drivers
This graph highlights how the Lebanon Wood Flooring Market has steadily grown over the past five years, supported by major growth factors.
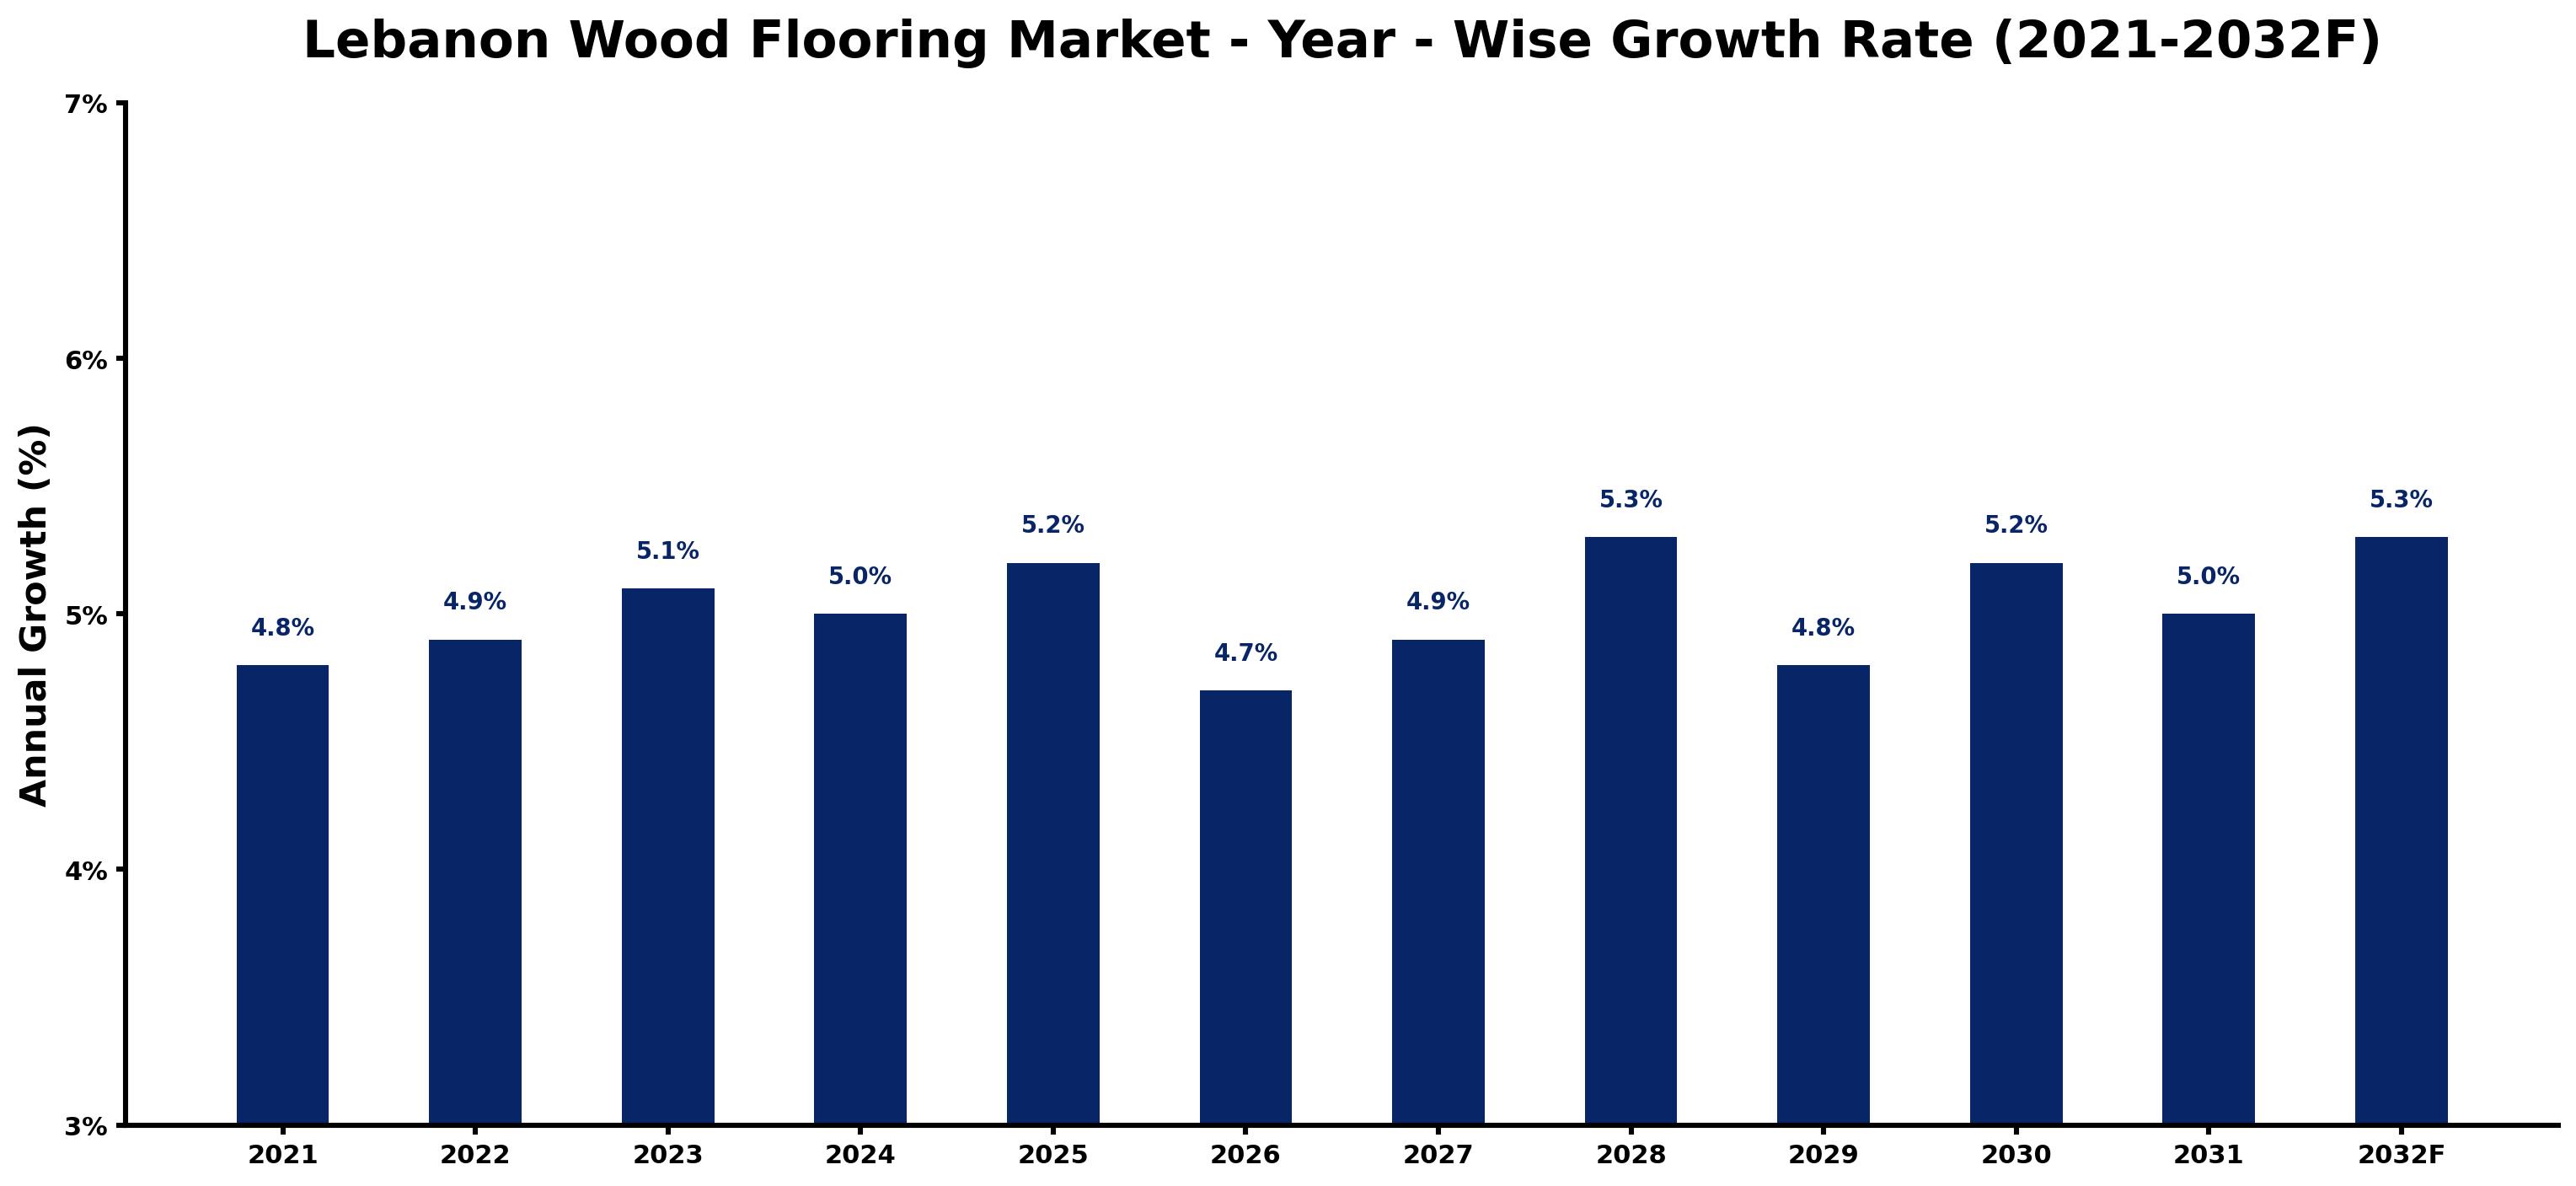
The table below presents the year wise growth rates along with the key drivers influencing the market
| Year | Growth Rate | Major Drivers |
| 2021 | 4.8% | Post-lockdown retail projects stimulated a rebound in construction and renovation activities. |
| 2022 | 4.9% | Local wood sources gained traction, driving sustainability awareness among consumers and builders. |
| 2023 | 5.1% | Increased tourism prompted hospitality sector investments in high-quality wood flooring options. |
| 2024 | 5.0% | Emerging urban centers began witnessing a shift towards luxury residential developments. |
| 2025 | 5.2% | E-commerce platforms facilitated easier access to diverse wood flooring products for consumers. |
| 2026 | 4.7% | Construction regulations started emphasizing green building practices, boosting eco-friendly flooring demand. |
| 2027 | 4.9% | Renovation projects surged as Lebanese families sought aesthetic improvements for their homes. |
| 2028 | 5.3% | Technological innovations enhanced wood flooring production, improving efficiency and reducing costs. |
| 2029 | 4.8% | A shift towards open-space living design drove demand for versatile flooring solutions. |
| 2030 | 5.2% | Expectations for premium design led to collaborations between designers and flooring manufacturers. |
| 2031 | 5.0% | Consumer education initiatives highlighted maintenance benefits, increasing flooring longevity and customer satisfaction. |
| 2032 | 5.3% | Urban revitalization efforts focused on historical preservation, favoring traditional wood flooring applications. |
Note - Market size estimations and growth projections presented in this report are based on 6Wresearch's advanced forecasting approach, validated with industry datasets as of June 2026.
Key Highlights of the Report:
- Lebanon Wood Flooring Market Outlook
- Market Size of Lebanon Wood Flooring Market, 2025
- Forecast of Lebanon Wood Flooring Market, 2032F
- Historical Data and Forecast of Lebanon Wood Flooring Revenues & Volume for the Period 2022-2032F
- Lebanon Wood Flooring Market Trend Evolution
- Lebanon Wood Flooring Market Drivers and Challenges
- Lebanon Wood Flooring Price Trends
- Lebanon Wood Flooring Porter's Five Forces
- Lebanon Wood Flooring Industry Life Cycle
- Historical Data and Forecast of Lebanon Wood Flooring Market Revenues & Volume By Product Type for the Period 2022-2032F
- Historical Data and Forecast of Lebanon Wood Flooring Market Revenues & Volume By Solid Wood for the Period 2022-2032F
- Historical Data and Forecast of Lebanon Wood Flooring Market Revenues & Volume By Engineered Wood for the Period 2022-2032F
- Historical Data and Forecast of Lebanon Wood Flooring Market Revenues & Volume By Distribution Channel for the Period 2022-2032F
- Historical Data and Forecast of Lebanon Wood Flooring Market Revenues & Volume By Home Centers for the Period 2022-2032F
- Historical Data and Forecast of Lebanon Wood Flooring Market Revenues & Volume By Flagship Stores for the Period 2022-2032F
- Historical Data and Forecast of Lebanon Wood Flooring Market Revenues & Volume By Specialty Stores for the Period 2022-2032F
- Historical Data and Forecast of Lebanon Wood Flooring Market Revenues & Volume By Online for the Period 2022-2032F
- Historical Data and Forecast of Lebanon Wood Flooring Market Revenues & Volume By Other for the Period 2022-2032F
- Historical Data and Forecast of Lebanon Wood Flooring Market Revenues & Volume By End-User for the Period 2022-2032F
- Historical Data and Forecast of Lebanon Wood Flooring Market Revenues & Volume By Residential for the Period 2022-2032F
- Historical Data and Forecast of Lebanon Wood Flooring Market Revenues & Volume By Commercial for the Period 2022-2032F
- Lebanon Wood Flooring Import Export Trade Statistics
- Market Opportunity Assessment By Product Type
- Market Opportunity Assessment By Distribution Channel
- Market Opportunity Assessment By End-User
- Lebanon Wood Flooring Top Companies Market Share
- Lebanon Wood Flooring Competitive Benchmarking By Technical and Operational Parameters
- Lebanon Wood Flooring Company Profiles
- Lebanon Wood Flooring Key Strategic Recommendations
Frequently Asked Questions About the Market Study (FAQs):
6Wresearch actively monitors the Lebanon Wood Flooring Market and publishes its comprehensive annual report, highlighting emerging trends, growth drivers, revenue analysis, and forecast outlook. Our insights help businesses to make data-backed strategic decisions with ongoing market dynamics. Our analysts track relevent industries related to the Lebanon Wood Flooring Market, allowing our clients with actionable intelligence and reliable forecasts tailored to emerging regional needs.
Yes, we provide customisation as per your requirements. To learn more, feel free to contact us on sales@6wresearch.com
1 Executive Summary |
2 Introduction |
2.1 Key Highlights of the Report |
2.2 Report Description |
2.3 Market Scope & Segmentation |
2.4 Research Methodology |
2.5 Assumptions |
3 Lebanon Wood Flooring Market Overview |
3.1 Lebanon Country Macro Economic Indicators |
3.2 Lebanon Wood Flooring Market Revenues & Volume, 2022 & 2032F |
3.3 Lebanon Wood Flooring Market - Industry Life Cycle |
3.4 Lebanon Wood Flooring Market - Porter's Five Forces |
3.5 Lebanon Wood Flooring Market Revenues & Volume Share, By Product Type, 2022 & 2032F |
3.6 Lebanon Wood Flooring Market Revenues & Volume Share, By Distribution Channel, 2022 & 2032F |
3.7 Lebanon Wood Flooring Market Revenues & Volume Share, By End-User, 2022 & 2032F |
4 Lebanon Wood Flooring Market Dynamics |
4.1 Impact Analysis |
4.2 Market Drivers |
4.3 Market Restraints |
5 Lebanon Wood Flooring Market Trends |
6 Lebanon Wood Flooring Market, By Types |
6.1 Lebanon Wood Flooring Market, By Product Type |
6.1.1 Overview and Analysis |
6.1.2 Lebanon Wood Flooring Market Revenues & Volume, By Product Type, 2022 - 2032F |
6.1.3 Lebanon Wood Flooring Market Revenues & Volume, By Solid Wood, 2022 - 2032F |
6.1.4 Lebanon Wood Flooring Market Revenues & Volume, By Engineered Wood, 2022 - 2032F |
6.2 Lebanon Wood Flooring Market, By Distribution Channel |
6.2.1 Overview and Analysis |
6.2.2 Lebanon Wood Flooring Market Revenues & Volume, By Home Centers, 2022 - 2032F |
6.2.3 Lebanon Wood Flooring Market Revenues & Volume, By Flagship Stores, 2022 - 2032F |
6.2.4 Lebanon Wood Flooring Market Revenues & Volume, By Specialty Stores, 2022 - 2032F |
6.2.5 Lebanon Wood Flooring Market Revenues & Volume, By Online, 2022 - 2032F |
6.2.6 Lebanon Wood Flooring Market Revenues & Volume, By Other, 2022 - 2032F |
6.3 Lebanon Wood Flooring Market, By End-User |
6.3.1 Overview and Analysis |
6.3.2 Lebanon Wood Flooring Market Revenues & Volume, By Residential, 2022 - 2032F |
6.3.3 Lebanon Wood Flooring Market Revenues & Volume, By Commercial, 2022 - 2032F |
7 Lebanon Wood Flooring Market Import-Export Trade Statistics |
7.1 Lebanon Wood Flooring Market Export to Major Countries |
7.2 Lebanon Wood Flooring Market Imports from Major Countries |
8 Lebanon Wood Flooring Market Key Performance Indicators |
9 Lebanon Wood Flooring Market - Opportunity Assessment |
9.1 Lebanon Wood Flooring Market Opportunity Assessment, By Product Type, 2022 & 2032F |
9.2 Lebanon Wood Flooring Market Opportunity Assessment, By Distribution Channel, 2022 & 2032F |
9.3 Lebanon Wood Flooring Market Opportunity Assessment, By End-User, 2022 & 2032F |
10 Lebanon Wood Flooring Market - Competitive Landscape |
10.1 Lebanon Wood Flooring Market Revenue Share, By Companies, 2025 |
10.2 Lebanon Wood Flooring Market Competitive Benchmarking, By Operating and Technical Parameters |
11 Company Profiles |
12 Recommendations |
13 Disclaimer |
Global Go To Market Strategy - 2030
Export potential enables firms to identify high-growth global markets with greater confidence by combining advanced trade intelligence with a structured quantitative methodology. The framework analyzes emerging demand trends and country-level import patterns while integrating macroeconomic and trade datasets such as GDP and population forecasts, bilateral import–export flows, tariff structures, elasticity differentials between developed and developing economies, geographic distance, and import demand projections. Using weighted trade values from 2020–2024 as the base period to project country-to-country export potential for 2030, these inputs are operationalized through calculated drivers such as gravity model parameters, tariff impact factors, and projected GDP per-capita growth. Through an analysis of hidden potentials, demand hotspots, and market conditions that are most favorable to success, this method enables firms to focus on target countries, maximize returns, and global expansion with data, backed by accuracy.
By factoring in the projected importer demand gap that is currently unmet and could be potential opportunity, it identifies the potential for the Exporter (Country) among 190 countries, against the general trade analysis, which identifies the biggest importer or exporter.
To discover high-growth global markets and optimize your business strategy:
Click Here
Pricing
- Single User License$ 1,995
- Department License$ 2,400
- Site License$ 3,120
- Global License$ 3,795

Leadership Perspectives from Industry Events
Search
Thought Leadership and Analyst Meet


Our Clients
6WResearch In News
- India Air Conditioner Market Set for Strong Rebound in 2026 After Weather-Led Correction and GST-Driven Recovery: 6Wresearch
- ADAS in India: How Automatic Emergency Braking, Blind Spot Detection & Driver Monitoring are Transforming Road Safety
- Doha a strategic location for EV manufacturing hub: IPA Qatar
- Demand for luxury TVs surging in the GCC, says Samsung
- Empowering Growth: The Thriving Journey of Bangladesh’s Cable Industry
- Demand for luxury TVs surging in the GCC, says Samsung
Latest Reports
- Nicaragua RPG Gaming Market (2026-2032)
- New Zealand RPG Gaming Market (2026-2032)
- Netherlands RPG Gaming Market (2026-2032)
- Nauru RPG Gaming Market (2026-2032)
- Namibia RPG Gaming Market (2026-2032)
- Mozambique RPG Gaming Market (2026-2032)
- Montenegro RPG Gaming Market (2026-2032)
- Mongolia RPG Gaming Market (2026-2032)
- Monaco RPG Gaming Market (2026-2032)
- Micronesia RPG Gaming Market (2026-2032)
Industry Events and Analyst Meet

EV India Expo 2026

HIMTEX 2026

India Refining Summit 2026

India EV Show 2026

EV tech India Expo 2026
Whitepaper
- Middle East & Africa Commercial Security Market Click here to view more.
- Middle East & Africa Fire Safety Systems & Equipment Market Click here to view more.
- GCC Drone Market Click here to view more.
- Middle East Lighting Fixture Market Click here to view more.
- GCC Physical & Perimeter Security Market Click here to view more.