Lithuania 2 Hydroxypropanoic Acid Market (2026-2032) | Size, Supply, Investment Trends, Demand, Opportunities, Drivers, Value, Analysis, Forecast, Pricing Analysis, Trends, Restraints, Segments, Strategic Insights, Outlook, Competition, Competitive, Growth, Industry, Segmentation, Companies, Share, Revenue, Strategy, Challenges, Consumer Insights
Market Forecast By Application (Bioplastics, Industrial, Food & Beverage, Pharmaceuticals, Cosmetics), By End-Use (Packaging, Healthcare), By Grade (Food, Industrial, Pharmaceutical), By Production Method (Synthetic, Fermentation) And Competitive Landscape
| Product Code: ETC11431866 | Publication Date: Apr 2025 | Updated Date: Apr 2026 | Product Type: Market Research Report | |
| Publisher: 6Wresearch | Author: Bhawna Singh | No. of Pages: 65 | No. of Figures: 34 | No. of Tables: 19 |
Lithuania 2 Hydroxypropanoic Acid Market Size (2020-2030)
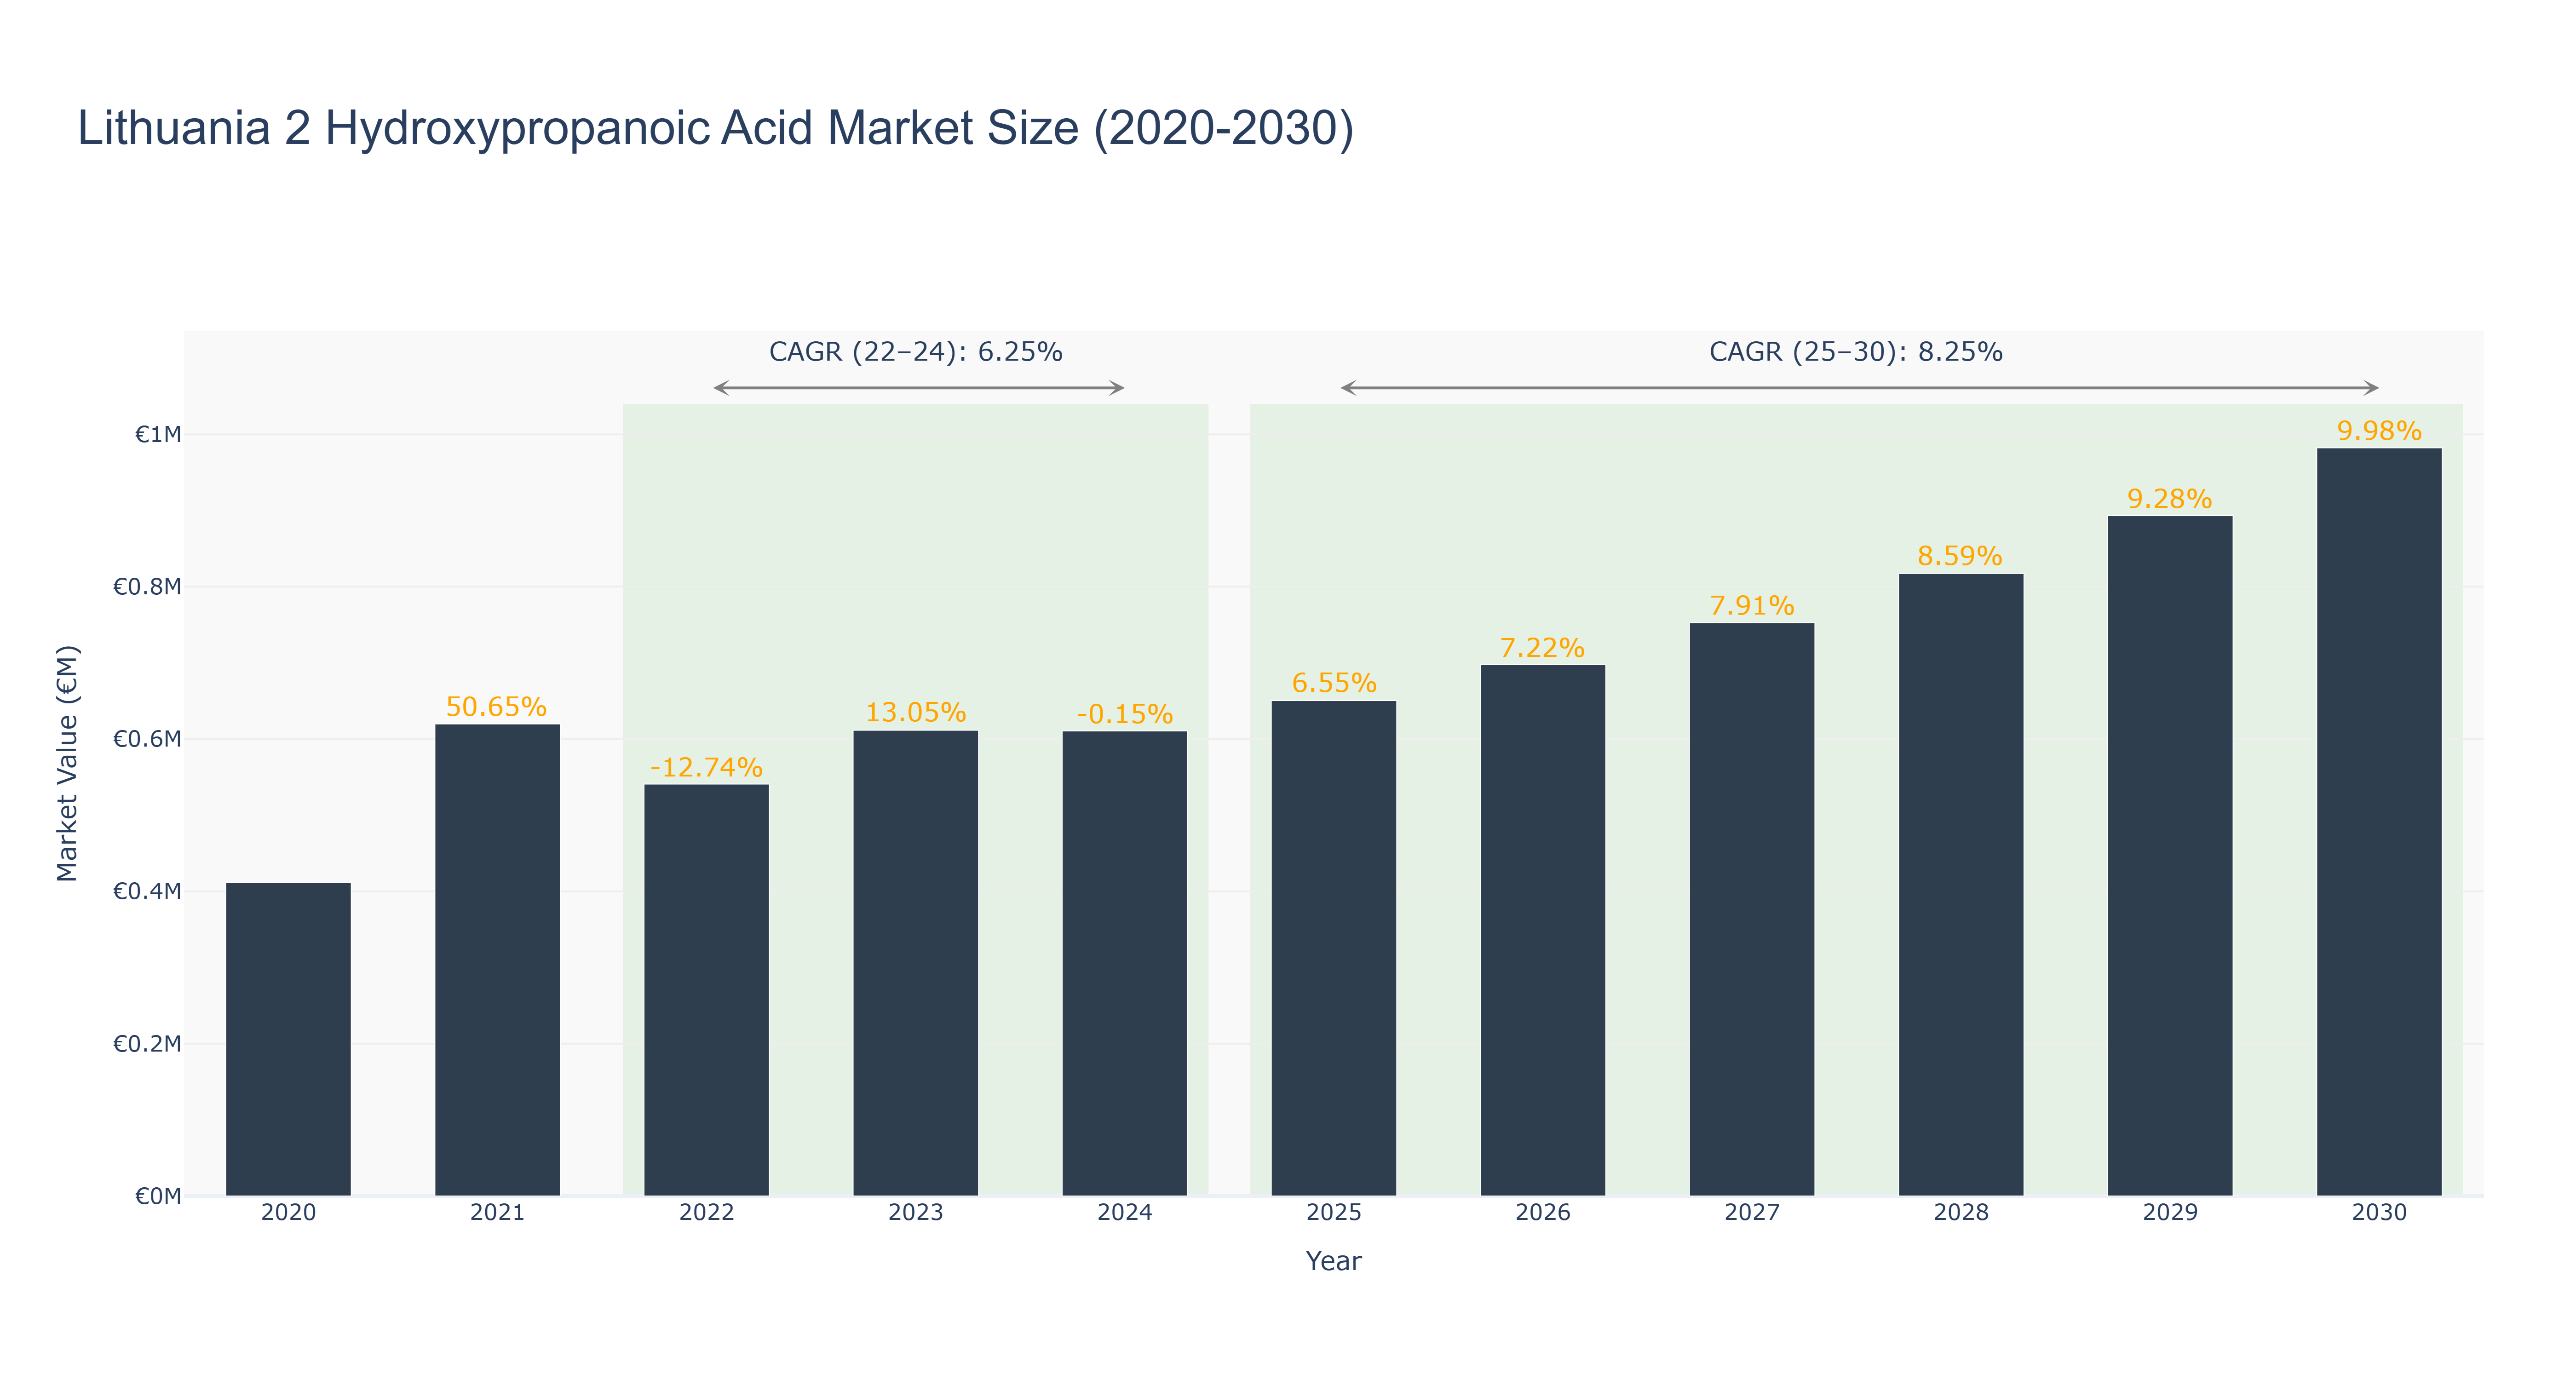
The Lithuania 2 Hydroxypropanoic Acid Market has shown a notable growth trend over the years. The peak market size was €0.98 million in 2030, with a steady increase from €0.41 million in 2020. The market experienced a slight decline in 2022 due to external factors but rebounded with a strong growth rate of 9.98% in 2030. The CAGR for the period 2022-24 was 6.25%, while the CAGR for 2025-30 is projected at 8.25%. The market's growth can be attributed to increasing demand for eco-friendly chemicals and advancements in biotechnology. Looking ahead, Lithuania is set to invest in research and development projects focusing on sustainable chemical production methods, positioning the market for further expansion and innovation.
Lithuania 2 Hydroxypropanoic Acid Market: Production & Trade Performance (2019-2025)
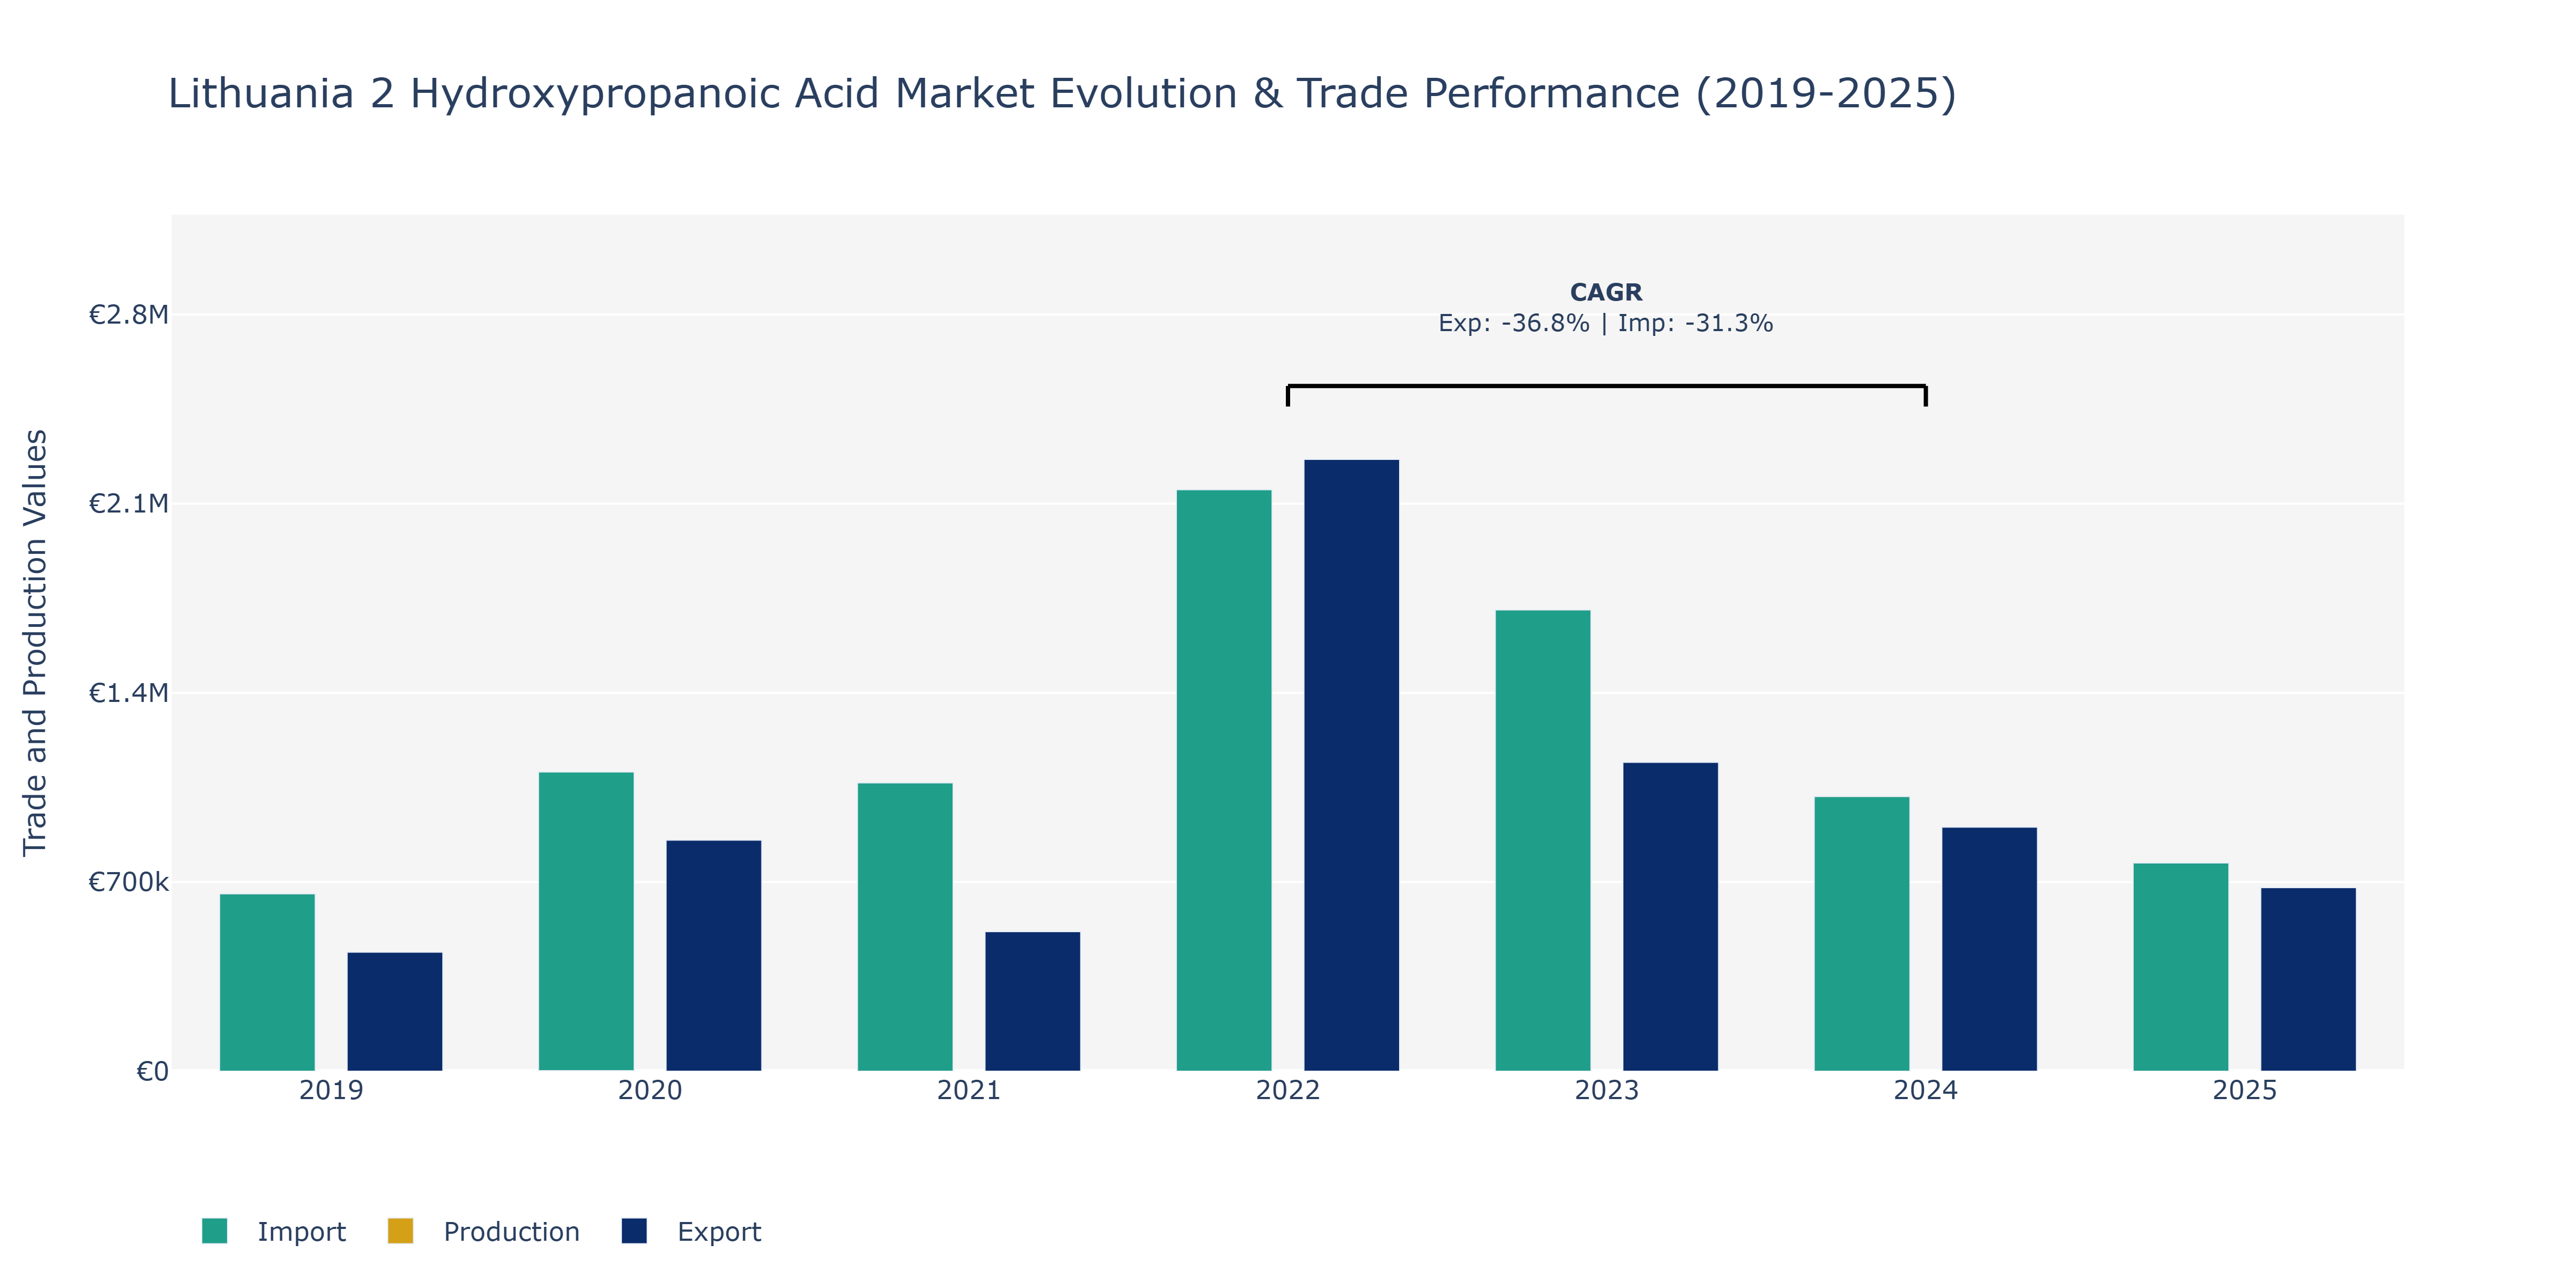
In the Lithuania 2 Hydroxypropanoic Acid market, Exports exhibited notable fluctuations over the years. Starting at €440.47 thousand in 2019, they surged to €2.26 million in 2022, indicating a substantial increase. However, a sharp decline to €903.25 thousand in 2024 followed this peak, highlighting the market's volatility. Imports also experienced fluctuations, with a peak of €1.11 million in 2020, followed by a gradual decrease to €770.24 thousand in 2025. These trends could be influenced by various factors such as changing global demand for 2 Hydroxypropanoic Acid, shifts in raw material prices, and evolving regulatory environments impacting trade dynamics. The decline in exports and imports post-peak years might indicate market stabilization or recalibration due to external factors affecting the industry, necessitating strategic adjustments by market players to maintain competitiveness.
Key Highlights of the Report:
- Lithuania 2 Hydroxypropanoic Acid Market Outlook
- Market Size of Lithuania 2 Hydroxypropanoic Acid Market, 2025
- Forecast of Lithuania 2 Hydroxypropanoic Acid Market, 2032
- Historical Data and Forecast of Lithuania 2 Hydroxypropanoic Acid Revenues & Volume for the Period 2022 - 2032F
- Lithuania 2 Hydroxypropanoic Acid Market Trend Evolution
- Lithuania 2 Hydroxypropanoic Acid Market Drivers and Challenges
- Lithuania 2 Hydroxypropanoic Acid Price Trends
- Lithuania 2 Hydroxypropanoic Acid Porter's Five Forces
- Lithuania 2 Hydroxypropanoic Acid Industry Life Cycle
- Historical Data and Forecast of Lithuania 2 Hydroxypropanoic Acid Market Revenues & Volume By Application for the Period 2022 - 2032F
- Historical Data and Forecast of Lithuania 2 Hydroxypropanoic Acid Market Revenues & Volume By Bioplastics for the Period 2022 - 2032F
- Historical Data and Forecast of Lithuania 2 Hydroxypropanoic Acid Market Revenues & Volume By Industrial for the Period 2022 - 2032F
- Historical Data and Forecast of Lithuania 2 Hydroxypropanoic Acid Market Revenues & Volume By Food & Beverage for the Period 2022 - 2032F
- Historical Data and Forecast of Lithuania 2 Hydroxypropanoic Acid Market Revenues & Volume By Pharmaceuticals for the Period 2022 - 2032F
- Historical Data and Forecast of Lithuania 2 Hydroxypropanoic Acid Market Revenues & Volume By Cosmetics for the Period 2022 - 2032F
- Historical Data and Forecast of Lithuania 2 Hydroxypropanoic Acid Market Revenues & Volume By End-Use for the Period 2022 - 2032F
- Historical Data and Forecast of Lithuania 2 Hydroxypropanoic Acid Market Revenues & Volume By Packaging for the Period 2022 - 2032F
- Historical Data and Forecast of Lithuania 2 Hydroxypropanoic Acid Market Revenues & Volume By Healthcare for the Period 2022 - 2032F
- Historical Data and Forecast of Lithuania 2 Hydroxypropanoic Acid Market Revenues & Volume By Grade for the Period 2022 - 2032F
- Historical Data and Forecast of Lithuania 2 Hydroxypropanoic Acid Market Revenues & Volume By Food for the Period 2022 - 2032F
- Historical Data and Forecast of Lithuania 2 Hydroxypropanoic Acid Market Revenues & Volume By Industrial for the Period 2022 - 2032F
- Historical Data and Forecast of Lithuania 2 Hydroxypropanoic Acid Market Revenues & Volume By Pharmaceutical for the Period 2022 - 2032F
- Historical Data and Forecast of Lithuania 2 Hydroxypropanoic Acid Market Revenues & Volume By Production Method for the Period 2022 - 2032F
- Historical Data and Forecast of Lithuania 2 Hydroxypropanoic Acid Market Revenues & Volume By Synthetic for the Period 2022 - 2032F
- Historical Data and Forecast of Lithuania 2 Hydroxypropanoic Acid Market Revenues & Volume By Fermentation for the Period 2022 - 2032F
- Lithuania 2 Hydroxypropanoic Acid Import Export Trade Statistics
- Market Opportunity Assessment By Application
- Market Opportunity Assessment By End-Use
- Market Opportunity Assessment By Grade
- Market Opportunity Assessment By Production Method
- Lithuania 2 Hydroxypropanoic Acid Top Companies Market Share
- Lithuania 2 Hydroxypropanoic Acid Competitive Benchmarking By Technical and Operational Parameters
- Lithuania 2 Hydroxypropanoic Acid Company Profiles
- Lithuania 2 Hydroxypropanoic Acid Key Strategic Recommendations
Frequently Asked Questions About the Market Study (FAQs):
6Wresearch actively monitors the Lithuania 2 Hydroxypropanoic Acid Market and publishes its comprehensive annual report, highlighting emerging trends, growth drivers, revenue analysis, and forecast outlook. Our insights help businesses to make data-backed strategic decisions with ongoing market dynamics. Our analysts track relevent industries related to the Lithuania 2 Hydroxypropanoic Acid Market, allowing our clients with actionable intelligence and reliable forecasts tailored to emerging regional needs.
Yes, we provide customisation as per your requirements. To learn more, feel free to contact us on sales@6wresearch.com
1 Executive Summary |
2 Introduction |
2.1 Key Highlights of the Report |
2.2 Report Description |
2.3 Market Scope & Segmentation |
2.4 Research Methodology |
2.5 Assumptions |
3 Lithuania 2 Hydroxypropanoic Acid Market Overview |
3.1 Lithuania Country Macro Economic Indicators |
3.2 Lithuania 2 Hydroxypropanoic Acid Market Revenues & Volume, 2022 & 2032F |
3.3 Lithuania 2 Hydroxypropanoic Acid Market - Industry Life Cycle |
3.4 Lithuania 2 Hydroxypropanoic Acid Market - Porter's Five Forces |
3.5 Lithuania 2 Hydroxypropanoic Acid Market Revenues & Volume Share, By Application, 2022 & 2032F |
3.6 Lithuania 2 Hydroxypropanoic Acid Market Revenues & Volume Share, By End-Use, 2022 & 2032F |
3.7 Lithuania 2 Hydroxypropanoic Acid Market Revenues & Volume Share, By Grade, 2022 & 2032F |
3.8 Lithuania 2 Hydroxypropanoic Acid Market Revenues & Volume Share, By Production Method, 2022 & 2032F |
4 Lithuania 2 Hydroxypropanoic Acid Market Dynamics |
4.1 Impact Analysis |
4.2 Market Drivers |
4.2.1 Growing demand for sustainable and bio-based chemicals in various industries |
4.2.2 Increasing awareness about the environmental benefits of 2 hydroxypropanoic acid |
4.2.3 Favorable government regulations promoting the use of eco-friendly chemicals |
4.3 Market Restraints |
4.3.1 High initial investment required for setting up production facilities |
4.3.2 Limited availability of raw materials for manufacturing 2 hydroxypropanoic acid |
4.3.3 Intense competition from alternative chemical products |
5 Lithuania 2 Hydroxypropanoic Acid Market Trends |
6 Lithuania 2 Hydroxypropanoic Acid Market, By Types |
6.1 Lithuania 2 Hydroxypropanoic Acid Market, By Application |
6.1.1 Overview and Analysis |
6.1.2 Lithuania 2 Hydroxypropanoic Acid Market Revenues & Volume, By Application, 2022 - 2032F |
6.1.3 Lithuania 2 Hydroxypropanoic Acid Market Revenues & Volume, By Bioplastics, 2022 - 2032F |
6.1.4 Lithuania 2 Hydroxypropanoic Acid Market Revenues & Volume, By Industrial, 2022 - 2032F |
6.1.5 Lithuania 2 Hydroxypropanoic Acid Market Revenues & Volume, By Food & Beverage, 2022 - 2032F |
6.1.6 Lithuania 2 Hydroxypropanoic Acid Market Revenues & Volume, By Pharmaceuticals, 2022 - 2032F |
6.1.7 Lithuania 2 Hydroxypropanoic Acid Market Revenues & Volume, By Cosmetics, 2022 - 2032F |
6.2 Lithuania 2 Hydroxypropanoic Acid Market, By End-Use |
6.2.1 Overview and Analysis |
6.2.2 Lithuania 2 Hydroxypropanoic Acid Market Revenues & Volume, By Packaging, 2022 - 2032F |
6.2.3 Lithuania 2 Hydroxypropanoic Acid Market Revenues & Volume, By Healthcare, 2022 - 2032F |
6.3 Lithuania 2 Hydroxypropanoic Acid Market, By Grade |
6.3.1 Overview and Analysis |
6.3.2 Lithuania 2 Hydroxypropanoic Acid Market Revenues & Volume, By Food, 2022 - 2032F |
6.3.3 Lithuania 2 Hydroxypropanoic Acid Market Revenues & Volume, By Industrial, 2022 - 2032F |
6.3.4 Lithuania 2 Hydroxypropanoic Acid Market Revenues & Volume, By Pharmaceutical, 2022 - 2032F |
6.4 Lithuania 2 Hydroxypropanoic Acid Market, By Production Method |
6.4.1 Overview and Analysis |
6.4.2 Lithuania 2 Hydroxypropanoic Acid Market Revenues & Volume, By Synthetic, 2022 - 2032F |
6.4.3 Lithuania 2 Hydroxypropanoic Acid Market Revenues & Volume, By Fermentation, 2022 - 2032F |
7 Lithuania 2 Hydroxypropanoic Acid Market Import-Export Trade Statistics |
7.1 Lithuania 2 Hydroxypropanoic Acid Market Export to Major Countries |
7.2 Lithuania 2 Hydroxypropanoic Acid Market Imports from Major Countries |
8 Lithuania 2 Hydroxypropanoic Acid Market Key Performance Indicators |
8.1 Research and development investment in new applications of 2 hydroxypropanoic acid |
8.2 Percentage of market share within the bio-based chemicals sector |
8.3 Number of partnerships or collaborations with key industry players for market expansion |
8.4 Adoption rate of 2 hydroxypropanoic acid in different end-user industries |
8.5 Environmental impact assessments and certifications obtained by manufacturers |
9 Lithuania 2 Hydroxypropanoic Acid Market - Opportunity Assessment |
9.1 Lithuania 2 Hydroxypropanoic Acid Market Opportunity Assessment, By Application, 2022 & 2032F |
9.2 Lithuania 2 Hydroxypropanoic Acid Market Opportunity Assessment, By End-Use, 2022 & 2032F |
9.3 Lithuania 2 Hydroxypropanoic Acid Market Opportunity Assessment, By Grade, 2022 & 2032F |
9.4 Lithuania 2 Hydroxypropanoic Acid Market Opportunity Assessment, By Production Method, 2022 & 2032F |
10 Lithuania 2 Hydroxypropanoic Acid Market - Competitive Landscape |
10.1 Lithuania 2 Hydroxypropanoic Acid Market Revenue Share, By Companies, 2025 |
10.2 Lithuania 2 Hydroxypropanoic Acid Market Competitive Benchmarking, By Operating and Technical Parameters |
11 Company Profiles |
12 Recommendations |
13 Disclaimer |
Global Go To Market Strategy - 2030
Export potential enables firms to identify high-growth global markets with greater confidence by combining advanced trade intelligence with a structured quantitative methodology. The framework analyzes emerging demand trends and country-level import patterns while integrating macroeconomic and trade datasets such as GDP and population forecasts, bilateral import–export flows, tariff structures, elasticity differentials between developed and developing economies, geographic distance, and import demand projections. Using weighted trade values from 2020–2024 as the base period to project country-to-country export potential for 2030, these inputs are operationalized through calculated drivers such as gravity model parameters, tariff impact factors, and projected GDP per-capita growth. Through an analysis of hidden potentials, demand hotspots, and market conditions that are most favorable to success, this method enables firms to focus on target countries, maximize returns, and global expansion with data, backed by accuracy.
By factoring in the projected importer demand gap that is currently unmet and could be potential opportunity, it identifies the potential for the Exporter (Country) among 190 countries, against the general trade analysis, which identifies the biggest importer or exporter.
To discover high-growth global markets and optimize your business strategy:
Click Here
Pricing
- Single User License$ 1,995
- Department License$ 2,400
- Site License$ 3,120
- Global License$ 3,795

Leadership Perspectives from Industry Events
Search
Thought Leadership and Analyst Meet


Our Clients
6WResearch In News
- Doha a strategic location for EV manufacturing hub: IPA Qatar
- Demand for luxury TVs surging in the GCC, says Samsung
- Empowering Growth: The Thriving Journey of Bangladesh’s Cable Industry
- Demand for luxury TVs surging in the GCC, says Samsung
- Video call with a traditional healer? Once unthinkable, it’s now common in South Africa
- Intelligent Buildings To Smooth GCC’s Path To Net Zero
Latest Reports
- Taiwan Airport Wireless Infrastructure Market (2026-2032)
- Vietnam Airport Wireless Infrastructure Market (2026-2032)
- Thailand Airport Wireless Infrastructure Market (2026-2032)
- South Korea Airport Wireless Infrastructure Market (2026-2032)
- Romania Airport Wireless Infrastructure Market (2026-2032)
- Qatar Airport Wireless Infrastructure Market (2026-2032)
- Philippines Airport Wireless Infrastructure Market (2026-2032)
- Japan Airport Wireless Infrastructure Market (2026-2032)
- Taiwan Airport Winter Services Market (2026-2032)
- Vietnam Airport Winter Services Market (2026-2032)
Industry Events and Analyst Meet

HIMTEX 2026

India Refining Summit 2026

India EV Show 2026

EV tech India Expo 2026

Auto Tech Asia 2026
Whitepaper
- Middle East & Africa Commercial Security Market Click here to view more.
- Middle East & Africa Fire Safety Systems & Equipment Market Click here to view more.
- GCC Drone Market Click here to view more.
- Middle East Lighting Fixture Market Click here to view more.
- GCC Physical & Perimeter Security Market Click here to view more.