Lithuania Allopurinol Market (2026-2032) | Outlook, Competitive Landscape, Companies, Size & Revenue, Growth, Trends, Analysis, Share, Industry, Forecast, Segmentation, Value
Market Forecast By Drug Class (Antigout Agents, Antihyperuricemic Agents), By Application (Gout, Kidney Stones, Others, Demographic, Adult, Pediatric), By Dosage Form (Intravenous Powder for Injection, Oral Tablet), By End-Users (Clinic, Hospital, Others), By Distribution Channel (Hospital Pharmacy, Retail Pharmacy, Online Pharmacy) And Competitive Landscape
| Product Code: ETC8034033 | Publication Date: Sep 2024 | Updated Date: Apr 2026 | Product Type: Market Research Report | |
| Publisher: 6Wresearch | Author: Sumit Sagar | No. of Pages: 75 | No. of Figures: 35 | No. of Tables: 20 |
Lithuania Allopurinol Market Size (2020-2030)
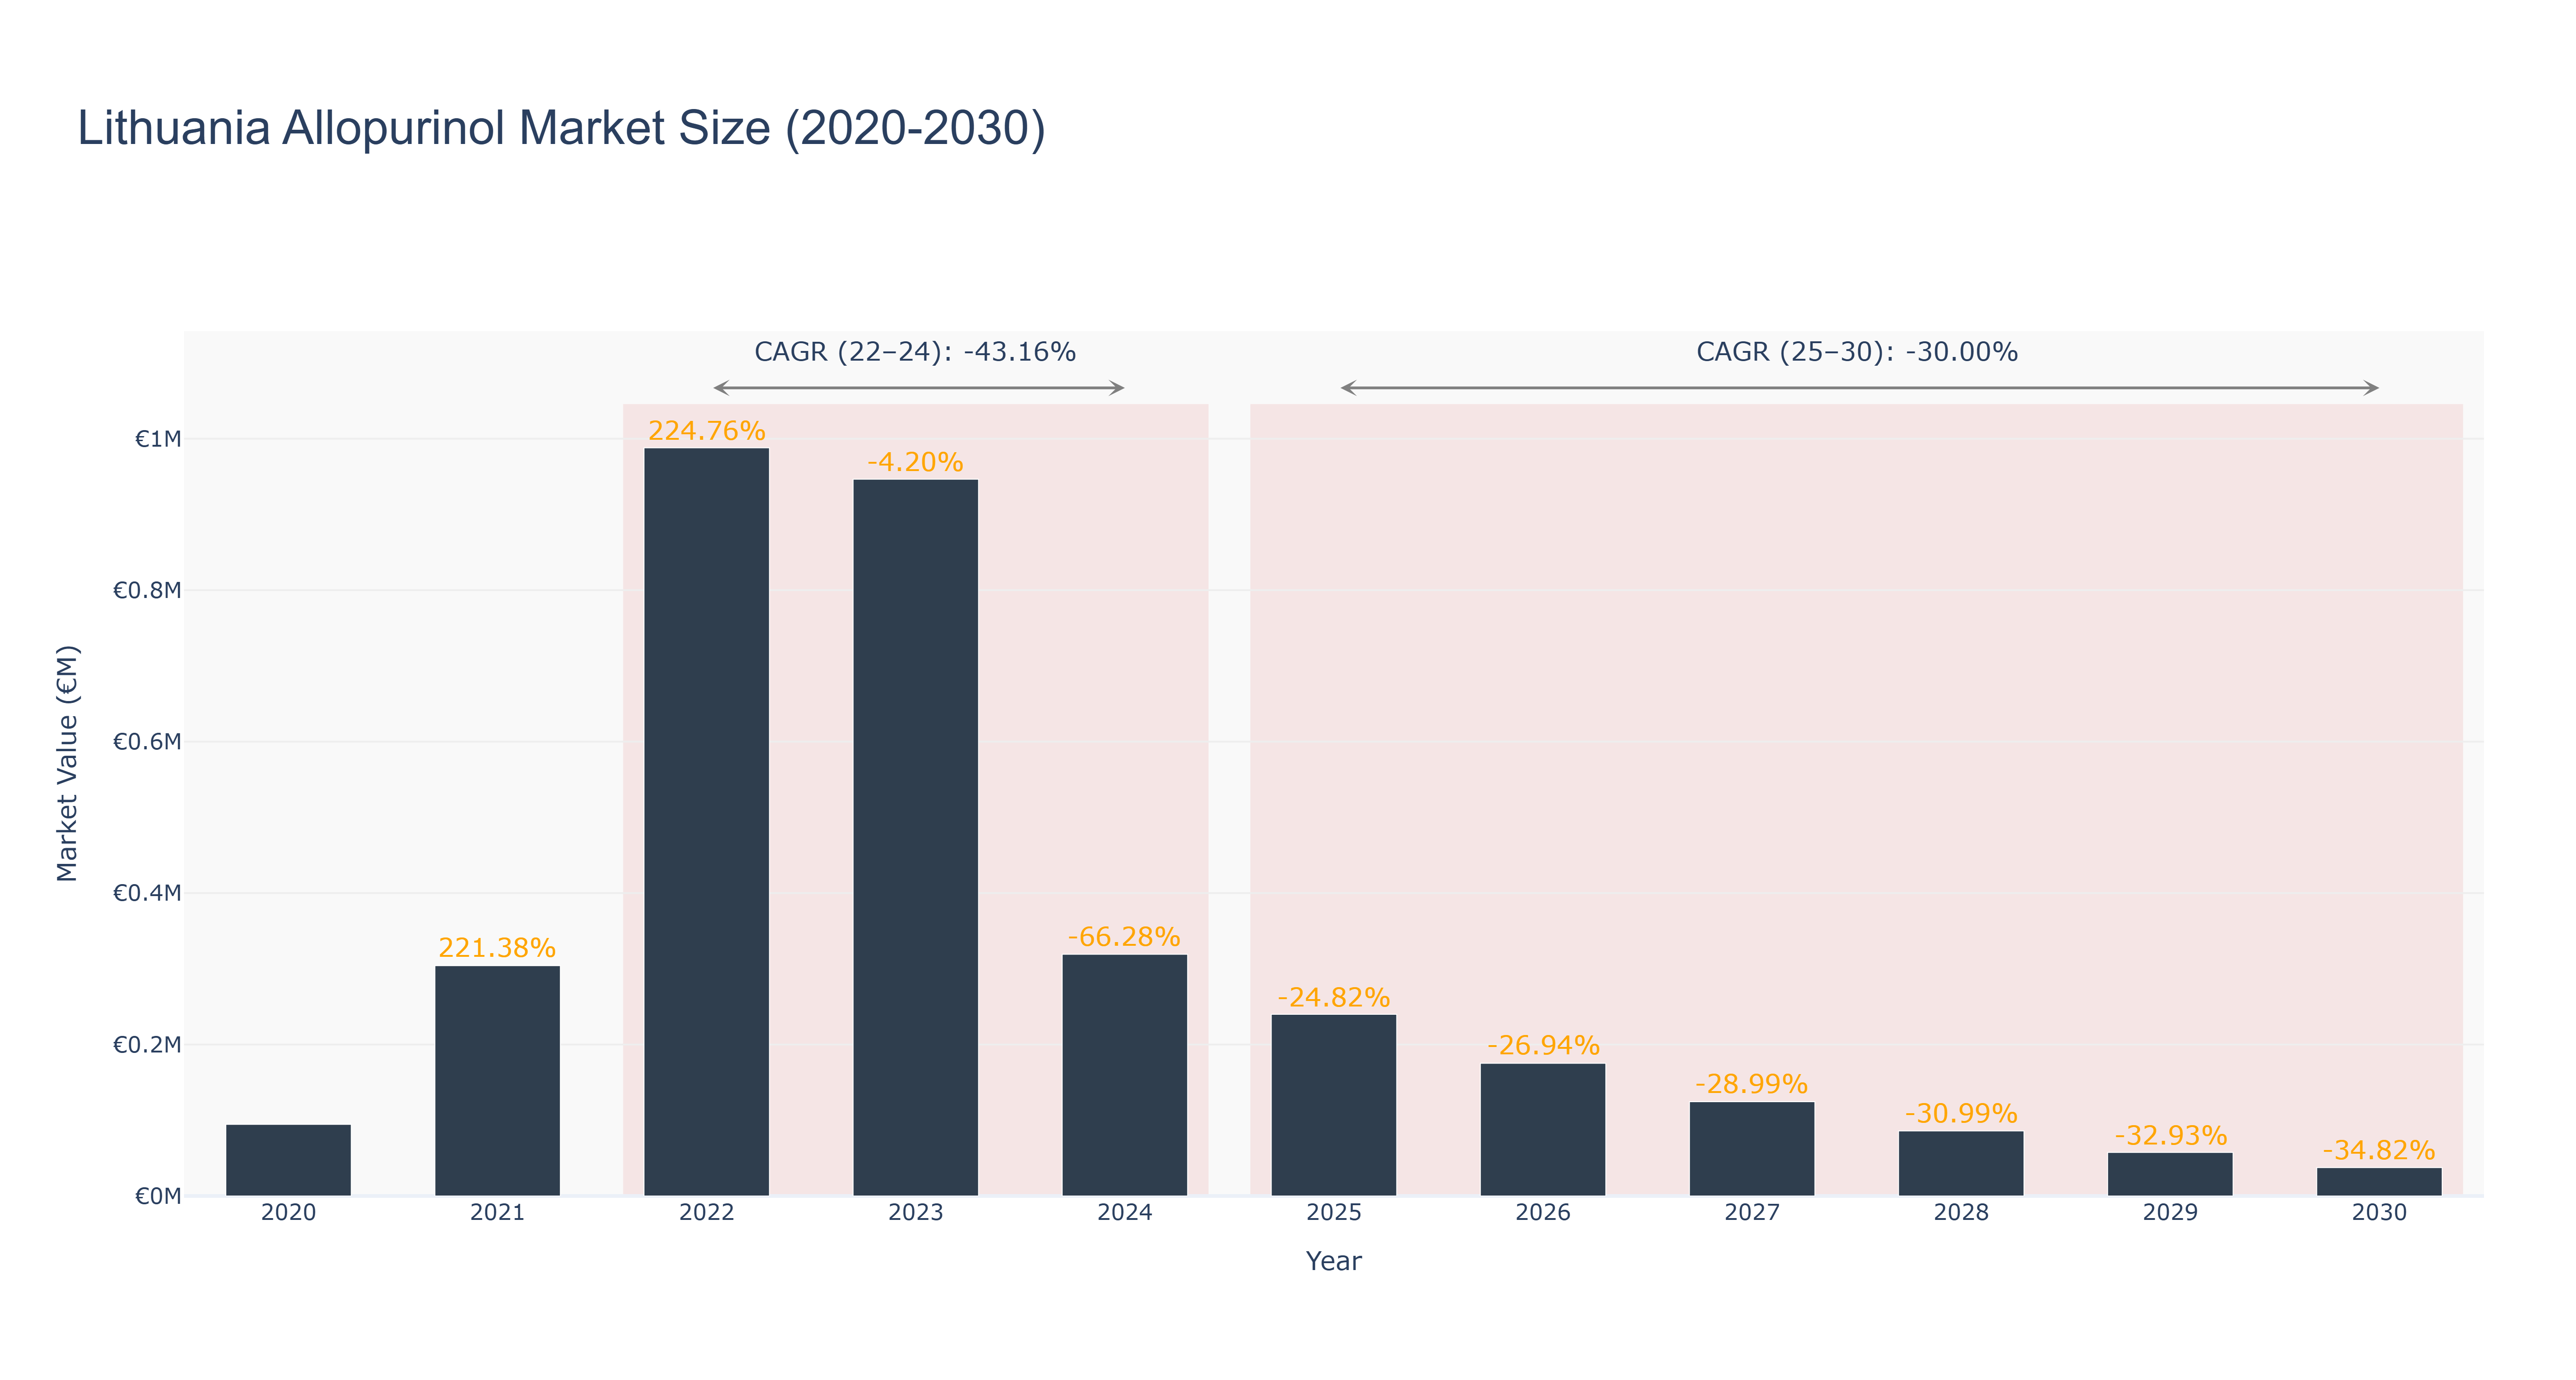
The Lithuania Allopurinol Market has experienced a significant fluctuation in market size over the years. The peak market size was recorded in 2022 at €0.99 million, followed by a sharp decline to €0.32 million in 2024. The market is forecasted to continue decreasing to €0.04 million by 2030, with a CAGR of -30.0% from 2025 to 2030. The decline in market size can be attributed to factors such as patent expirations, generic competition, and changing treatment guidelines impacting the demand for Allopurinol medication. To counter this trend, pharmaceutical companies in Lithuania are focusing on developing innovative formulations and expanding their market reach through strategic partnerships with healthcare providers. These efforts aim to revitalize the market and drive growth in the coming years. Industry drivers for the Lithuania Allopurinol Market include the rising prevalence of gout and other related conditions, increasing awareness about the benefits of Allopurinol in managing these diseases, and the aging population contributing to the demand for such medications.
Lithuania Allopurinol Market: Production & Trade Performance (2019-2025)
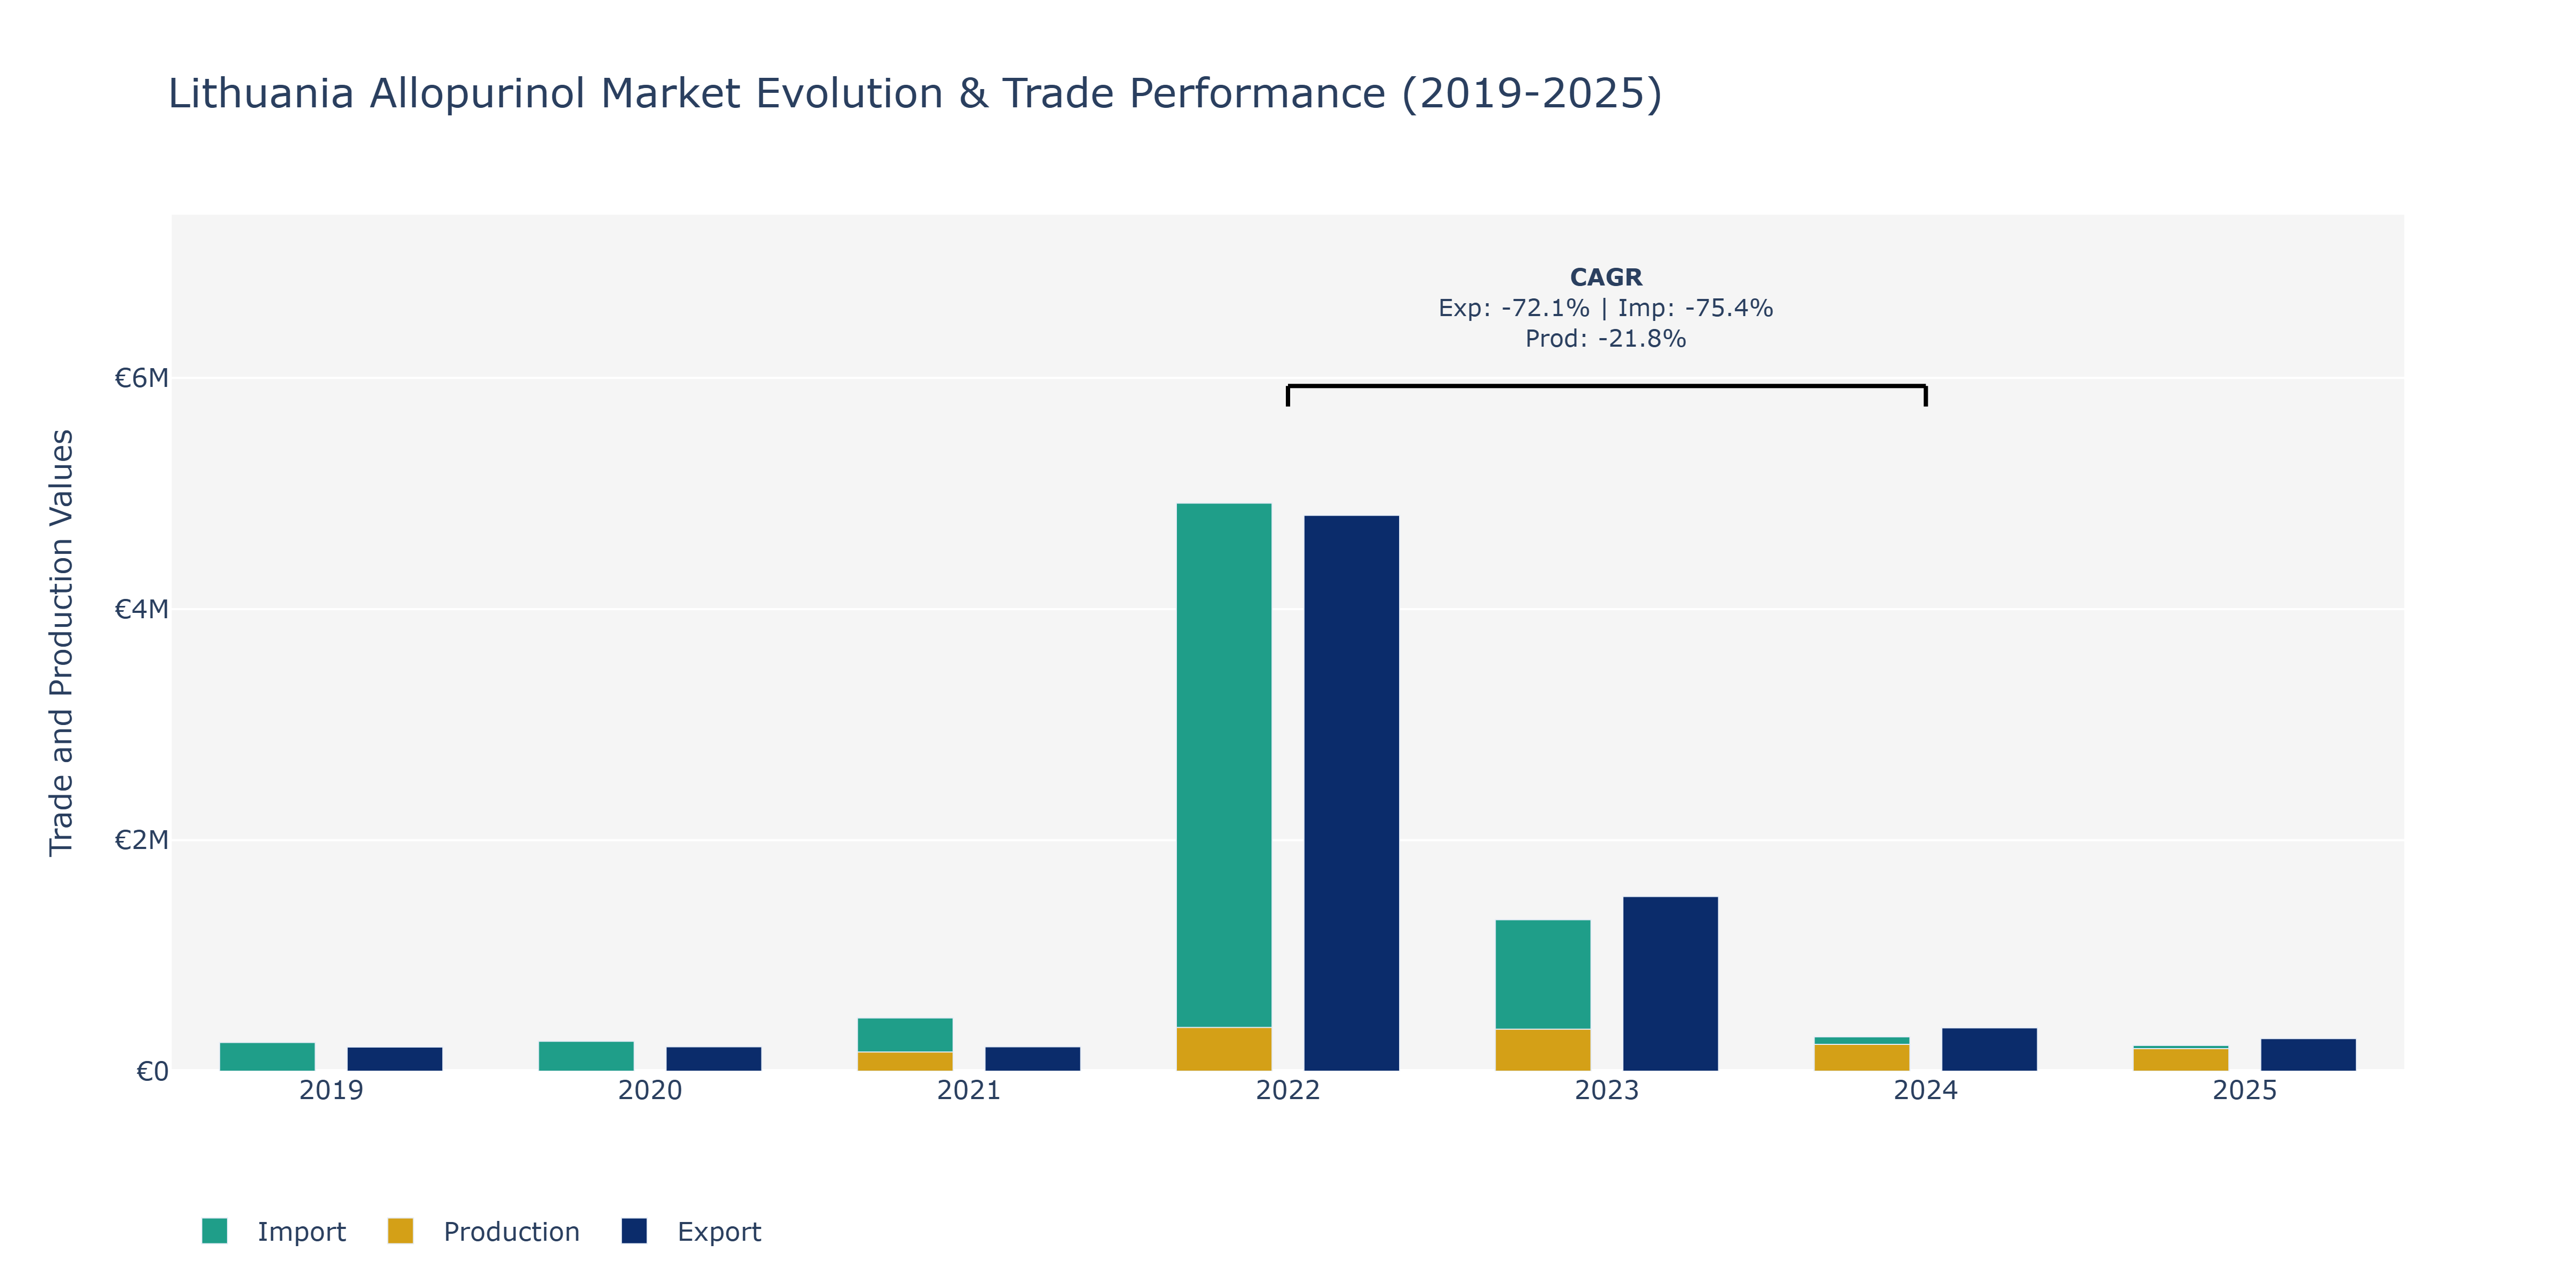
In the Lithuania Allopurinol market, from 2019 to 2025, the data reveals dynamic trends in exports, imports, and production. Exports remained relatively stable from 2019 to 2021 around €209.19 thousand to €211.36 thousand before experiencing a substantial increase in 2022 to €4.81 million, indicating a significant surge in demand for Lithuanian Allopurinol products internationally. In contrast, imports followed a similar pattern, with a notable spike in 2021 to €461.28 thousand, suggesting a shift in sourcing strategies. Production value peaked in 2021 at €166 million before declining in the subsequent years, possibly due to adjustments in manufacturing capacities. Real-world developments such as increased global recognition of Lithuanian pharmaceuticals and strategic trade partnerships could have influenced these shifts, driving both export and import activities while production levels adapted to market demands.
Key Highlights of the Report:
- Lithuania Allopurinol Market Outlook
- Market Size of Lithuania Allopurinol Market, 2025
- Forecast of Lithuania Allopurinol Market, 2032
- Historical Data and Forecast of Lithuania Allopurinol Revenues & Volume for the Period 2022 - 2032
- Lithuania Allopurinol Market Trend Evolution
- Lithuania Allopurinol Market Drivers and Challenges
- Lithuania Allopurinol Price Trends
- Lithuania Allopurinol Porter's Five Forces
- Lithuania Allopurinol Industry Life Cycle
- Historical Data and Forecast of Lithuania Allopurinol Market Revenues & Volume By Drug Class for the Period 2022 - 2032
- Historical Data and Forecast of Lithuania Allopurinol Market Revenues & Volume By Antigout Agents for the Period 2022 - 2032
- Historical Data and Forecast of Lithuania Allopurinol Market Revenues & Volume By Antihyperuricemic Agents for the Period 2022 - 2032
- Historical Data and Forecast of Lithuania Allopurinol Market Revenues & Volume By Application for the Period 2022 - 2032
- Historical Data and Forecast of Lithuania Allopurinol Market Revenues & Volume By Gout for the Period 2022 - 2032
- Historical Data and Forecast of Lithuania Allopurinol Market Revenues & Volume By Kidney Stones for the Period 2022 - 2032
- Historical Data and Forecast of Lithuania Allopurinol Market Revenues & Volume By Others for the Period 2022 - 2032
- Historical Data and Forecast of Lithuania Allopurinol Market Revenues & Volume By Demographic for the Period 2022 - 2032
- Historical Data and Forecast of Lithuania Allopurinol Market Revenues & Volume By Adult for the Period 2022 - 2032
- Historical Data and Forecast of Lithuania Allopurinol Market Revenues & Volume By Pediatric for the Period 2022 - 2032
- Historical Data and Forecast of Lithuania Allopurinol Market Revenues & Volume By Dosage Form for the Period 2022 - 2032
- Historical Data and Forecast of Lithuania Allopurinol Market Revenues & Volume By Intravenous Powder for Injection for the Period 2022 - 2032
- Historical Data and Forecast of Lithuania Allopurinol Market Revenues & Volume By Oral Tablet for the Period 2022 - 2032
- Historical Data and Forecast of Lithuania Allopurinol Market Revenues & Volume By End-Users for the Period 2022 - 2032
- Historical Data and Forecast of Lithuania Allopurinol Market Revenues & Volume By Clinic for the Period 2022 - 2032
- Historical Data and Forecast of Lithuania Allopurinol Market Revenues & Volume By Hospital for the Period 2022 - 2032
- Historical Data and Forecast of Lithuania Allopurinol Market Revenues & Volume By Others for the Period 2022 - 2032
- Historical Data and Forecast of Lithuania Allopurinol Market Revenues & Volume By Distribution Channel for the Period 2022 - 2032
- Historical Data and Forecast of Lithuania Allopurinol Market Revenues & Volume By Hospital Pharmacy for the Period 2022 - 2032
- Historical Data and Forecast of Lithuania Allopurinol Market Revenues & Volume By Retail Pharmacy for the Period 2022 - 2032
- Historical Data and Forecast of Lithuania Allopurinol Market Revenues & Volume By Online Pharmacy for the Period 2022 - 2032
- Lithuania Allopurinol Import Export Trade Statistics
- Market Opportunity Assessment By Drug Class
- Market Opportunity Assessment By Application
- Market Opportunity Assessment By Dosage Form
- Market Opportunity Assessment By End-Users
- Market Opportunity Assessment By Distribution Channel
- Lithuania Allopurinol Top Companies Market Share
- Lithuania Allopurinol Competitive Benchmarking By Technical and Operational Parameters
- Lithuania Allopurinol Company Profiles
- Lithuania Allopurinol Key Strategic Recommendations
Frequently Asked Questions About the Market Study (FAQs):
6Wresearch actively monitors the Lithuania Allopurinol Market and publishes its comprehensive annual report, highlighting emerging trends, growth drivers, revenue analysis, and forecast outlook. Our insights help businesses to make data-backed strategic decisions with ongoing market dynamics. Our analysts track relevent industries related to the Lithuania Allopurinol Market, allowing our clients with actionable intelligence and reliable forecasts tailored to emerging regional needs.
Yes, we provide customisation as per your requirements. To learn more, feel free to contact us on sales@6wresearch.com
1 Executive Summary |
2 Introduction |
2.1 Key Highlights of the Report |
2.2 Report Description |
2.3 Market Scope & Segmentation |
2.4 Research Methodology |
2.5 Assumptions |
3 Lithuania Allopurinol Market Overview |
3.1 Lithuania Country Macro Economic Indicators |
3.2 Lithuania Allopurinol Market Revenues & Volume, 2022 & 2032F |
3.3 Lithuania Allopurinol Market - Industry Life Cycle |
3.4 Lithuania Allopurinol Market - Porter's Five Forces |
3.5 Lithuania Allopurinol Market Revenues & Volume Share, By Drug Class, 2022 & 2032F |
3.6 Lithuania Allopurinol Market Revenues & Volume Share, By Application, 2022 & 2032F |
3.7 Lithuania Allopurinol Market Revenues & Volume Share, By Dosage Form, 2022 & 2032F |
3.8 Lithuania Allopurinol Market Revenues & Volume Share, By End-Users, 2022 & 2032F |
3.9 Lithuania Allopurinol Market Revenues & Volume Share, By Distribution Channel, 2022 & 2032F |
4 Lithuania Allopurinol Market Dynamics |
4.1 Impact Analysis |
4.2 Market Drivers |
4.2.1 Increasing prevalence of gout and other related conditions in Lithuania |
4.2.2 Growing awareness about the benefits of allopurinol in managing hyperuricemia and gout |
4.2.3 Rising geriatric population in Lithuania leading to higher demand for gout medication |
4.3 Market Restraints |
4.3.1 Stringent regulatory requirements for the approval and marketing of pharmaceutical products in Lithuania |
4.3.2 Limited access to healthcare facilities, particularly in rural areas, affecting the reach of allopurinol |
4.3.3 Competition from alternative treatments and medications for gout management |
5 Lithuania Allopurinol Market Trends |
6 Lithuania Allopurinol Market, By Types |
6.1 Lithuania Allopurinol Market, By Drug Class |
6.1.1 Overview and Analysis |
6.1.2 Lithuania Allopurinol Market Revenues & Volume, By Drug Class, 2022 - 2032F |
6.1.3 Lithuania Allopurinol Market Revenues & Volume, By Antigout Agents, 2022 - 2032F |
6.1.4 Lithuania Allopurinol Market Revenues & Volume, By Antihyperuricemic Agents, 2022 - 2032F |
6.2 Lithuania Allopurinol Market, By Application |
6.2.1 Overview and Analysis |
6.2.2 Lithuania Allopurinol Market Revenues & Volume, By Gout, 2022 - 2032F |
6.2.3 Lithuania Allopurinol Market Revenues & Volume, By Kidney Stones, 2022 - 2032F |
6.2.4 Lithuania Allopurinol Market Revenues & Volume, By Others, 2022 - 2032F |
6.2.5 Lithuania Allopurinol Market Revenues & Volume, By Demographic, 2022 - 2032F |
6.2.6 Lithuania Allopurinol Market Revenues & Volume, By Adult, 2022 - 2032F |
6.2.7 Lithuania Allopurinol Market Revenues & Volume, By Pediatric, 2022 - 2032F |
6.3 Lithuania Allopurinol Market, By Dosage Form |
6.3.1 Overview and Analysis |
6.3.2 Lithuania Allopurinol Market Revenues & Volume, By Intravenous Powder for Injection, 2022 - 2032F |
6.3.3 Lithuania Allopurinol Market Revenues & Volume, By Oral Tablet, 2022 - 2032F |
6.4 Lithuania Allopurinol Market, By End-Users |
6.4.1 Overview and Analysis |
6.4.2 Lithuania Allopurinol Market Revenues & Volume, By Clinic, 2022 - 2032F |
6.4.3 Lithuania Allopurinol Market Revenues & Volume, By Hospital, 2022 - 2032F |
6.4.4 Lithuania Allopurinol Market Revenues & Volume, By Others, 2022 - 2032F |
6.5 Lithuania Allopurinol Market, By Distribution Channel |
6.5.1 Overview and Analysis |
6.5.2 Lithuania Allopurinol Market Revenues & Volume, By Hospital Pharmacy, 2022 - 2032F |
6.5.3 Lithuania Allopurinol Market Revenues & Volume, By Retail Pharmacy, 2022 - 2032F |
6.5.4 Lithuania Allopurinol Market Revenues & Volume, By Online Pharmacy, 2022 - 2032F |
7 Lithuania Allopurinol Market Import-Export Trade Statistics |
7.1 Lithuania Allopurinol Market Export to Major Countries |
7.2 Lithuania Allopurinol Market Imports from Major Countries |
8 Lithuania Allopurinol Market Key Performance Indicators |
8.1 Average prescription rate of allopurinol per healthcare facility |
8.2 Number of healthcare professionals trained on the benefits and usage of allopurinol |
8.3 Patient adherence rate to allopurinol treatment plans |
8.4 Number of gout-related hospitalizations or emergency room visits where allopurinol was prescribed |
8.5 Percentage of gout patients achieving target uric acid levels with allopurinol therapy |
9 Lithuania Allopurinol Market - Opportunity Assessment |
9.1 Lithuania Allopurinol Market Opportunity Assessment, By Drug Class, 2022 & 2032F |
9.2 Lithuania Allopurinol Market Opportunity Assessment, By Application, 2022 & 2032F |
9.3 Lithuania Allopurinol Market Opportunity Assessment, By Dosage Form, 2022 & 2032F |
9.4 Lithuania Allopurinol Market Opportunity Assessment, By End-Users, 2022 & 2032F |
9.5 Lithuania Allopurinol Market Opportunity Assessment, By Distribution Channel, 2022 & 2032F |
10 Lithuania Allopurinol Market - Competitive Landscape |
10.1 Lithuania Allopurinol Market Revenue Share, By Companies, 2025 |
10.2 Lithuania Allopurinol Market Competitive Benchmarking, By Operating and Technical Parameters |
11 Company Profiles |
12 Recommendations |
13 Disclaimer |
Export potential assessment - trade Analytics for 2030
Export potential enables firms to identify high-growth global markets with greater confidence by combining advanced trade intelligence with a structured quantitative methodology. The framework analyzes emerging demand trends and country-level import patterns while integrating macroeconomic and trade datasets such as GDP and population forecasts, bilateral import–export flows, tariff structures, elasticity differentials between developed and developing economies, geographic distance, and import demand projections. Using weighted trade values from 2020–2024 as the base period to project country-to-country export potential for 2030, these inputs are operationalized through calculated drivers such as gravity model parameters, tariff impact factors, and projected GDP per-capita growth. Through an analysis of hidden potentials, demand hotspots, and market conditions that are most favorable to success, this method enables firms to focus on target countries, maximize returns, and global expansion with data, backed by accuracy.
By factoring in the projected importer demand gap that is currently unmet and could be potential opportunity, it identifies the potential for the Exporter (Country) among 190 countries, against the general trade analysis, which identifies the biggest importer or exporter.
To discover high-growth global markets and optimize your business strategy:
Click Here
Pricing
- Single User License$ 1,995
- Department License$ 2,400
- Site License$ 3,120
- Global License$ 3,795

Search
Thought Leadership and Analyst Meet


Our Clients
Latest Reports
- India Ultrasonic Smart Water Meter Market (2026-2032) | Outlook, Competition, Drivers, Trends, Demand, Competitive, Strategic Insights, Companies, Challenges, Strategy, Consumer Insights, Analysis, Opportunities, Growth, Size, Share, Industry, Revenue, Segments, Value, Segmentation, Supply, Forecast, Restraints,
- India Electromagnetic Bulk Flow Meter Market (2026-2032) | Analysis, Challenges, Strategic Insights, Supply, Forecast, Growth, Share, Consumer Insights, Competitive, Value, Outlook, Size & Demand,
- India Battery Powered Bulk Flow Meter Market (2026-2032) | Outlook, Analysis, Competitive Landscape, Growth, Size, Trends, Value, Revenue, Companies, Segmentation, Share & Forecast
- Bosnia and Herzegovina Fuel-Efficient Winglets Market (2026-2032) | Growth, Competition, Strategy, Restraints, Trends, Challenges, segmentation, Value, Outlook, Investment Opportunities, Analysis, Revenue, Companies, Insights, Pricing, Size, Drivers, Demand, Share, Forecast
- Canada Cloud CFD Market (2026-2032) | Size & Revenue, Industry, Growth, Competitive Landscape, Forecast, Segmentation, Value, Outlook, Trends, Share, Analysis, Companies
- Taiwan Food Delivery Platform Market (2026-2032) | Companies, Outlook, Analysis, Trends, Value, Revenue, Segmentation, Share, Forecast, Competitive Landscape, Growth, Size & Forecast
- United Kingdom (UK) Long-term Care Insurance Market (2026-2032) | Growth, Share, Consumer Insights, Drivers, Opportunities, Competition, Pricing Analysis, Segments, Restraints, Companies, Competitive, Value, Outlook, Size, Demand, Analysis, Challenges, Strategic Insights, Investment Trends, Revenue, Trends, Supply, Forecast
- United Kingdom (UK) Long Term Care Market (2026-2032) | Companies, Outlook, Analysis, Trends, Value, Revenue, Segmentation, Share, Forecast, Competitive Landscape, Growth, Size & Forecast
- Iraq Insulation and Waterproofing Market (2026-2032) | Outlook, Drivers, Growth, Size, Share, Industry, Revenue, Trends, Demand, Competitive, Strategic Insights, Opportunities, Segments, Companies, Challenges, Strategy, Consumer Insights, Analysis, Investment Trends, Value, Segmentation, Forecast, Restraints
- India Switchgear Market Outlook (2026-2032) | Size, Share, Trends, Growth, Revenue, Forecast, Analysis, Value, Outlook
Industry Events and Analyst Meet

India EV Show 2026

EV tech India Expo 2026

Auto Tech Asia 2026

Battery Tech India 2026

Smart Production Solutions Guangzhou 2026
Whitepaper
- Middle East & Africa Commercial Security Market Click here to view more.
- Middle East & Africa Fire Safety Systems & Equipment Market Click here to view more.
- GCC Drone Market Click here to view more.
- Middle East Lighting Fixture Market Click here to view more.
- GCC Physical & Perimeter Security Market Click here to view more.
6WResearch In News
- Doha a strategic location for EV manufacturing hub: IPA Qatar
- Demand for luxury TVs surging in the GCC, says Samsung
- Empowering Growth: The Thriving Journey of Bangladesh’s Cable Industry
- Demand for luxury TVs surging in the GCC, says Samsung
- Video call with a traditional healer? Once unthinkable, it’s now common in South Africa
- Intelligent Buildings To Smooth GCC’s Path To Net Zero